
수록 모음: 투자자 발표자료 사례 · 일본 기업 IR 자료 예시
Mitsubishi Chemical Group (TSE 4188) H1 FY2026 earnings presentation (2027年3月期 第2四半期(中間期)決算説明), a 28-page Japanese-language deck dated November 5, 2026 and originally published on TDnet (Tokyo Stock Exchange Timely Disclosure). It covers interim results for April–September 2026: revenue of ¥2,037.1 billion (20,371億円, +13%), core operating income (コア営業利益, IFRS) of ¥202.8 billion (2,028億円, +61%) and interim profit attributable to owners of the parent of ¥90.2 billion (902億円, −18%). It also raises the full-year forecast for core operating income from 3,050億円 to 3,400億円 and for net profit attributable to owners from 1,270億円 to 1,450億円, while keeping the annual dividend at ¥32.
이 프레젠테이션의 표지를 스타일 참고 자료로 사용해 내 콘텐츠로 슬라이드를 만듭니다. 아래에서 원하는 페이지를 골라 그 레이아웃을 참고로 쓸 수도 있습니다.
빠른 탐색
태그
슬라이드 공유
Mitsubishi Chemical Group (TSE 4188) H1 FY2026 earnings presentation (2027年3月期 第2四半期(中間期)決算説明), a 28-page Japanese-language deck dated November 5, 2026 and originally published on TDnet (Tokyo Stock Exchange Timely Disclosure). It covers interim results for April–September 2026: revenue of ¥2,037.1 billion (20,371億円, +13%), core operating income (コア営業利益, IFRS) of ¥202.8 billion (2,028億円, +61%) and interim profit attributable to owners of the parent of ¥90.2 billion (902億円, −18%). It also raises the full-year forecast for core operating income from 3,050億円 to 3,400億円 and for net profit attributable to owners from 1,270億円 to 1,450億円, while keeping the annual dividend at ¥32.
레이아웃, 주요 콘텐츠 및 시각적 요소를 포함한 각 슬라이드 페이지의 상세 보기.
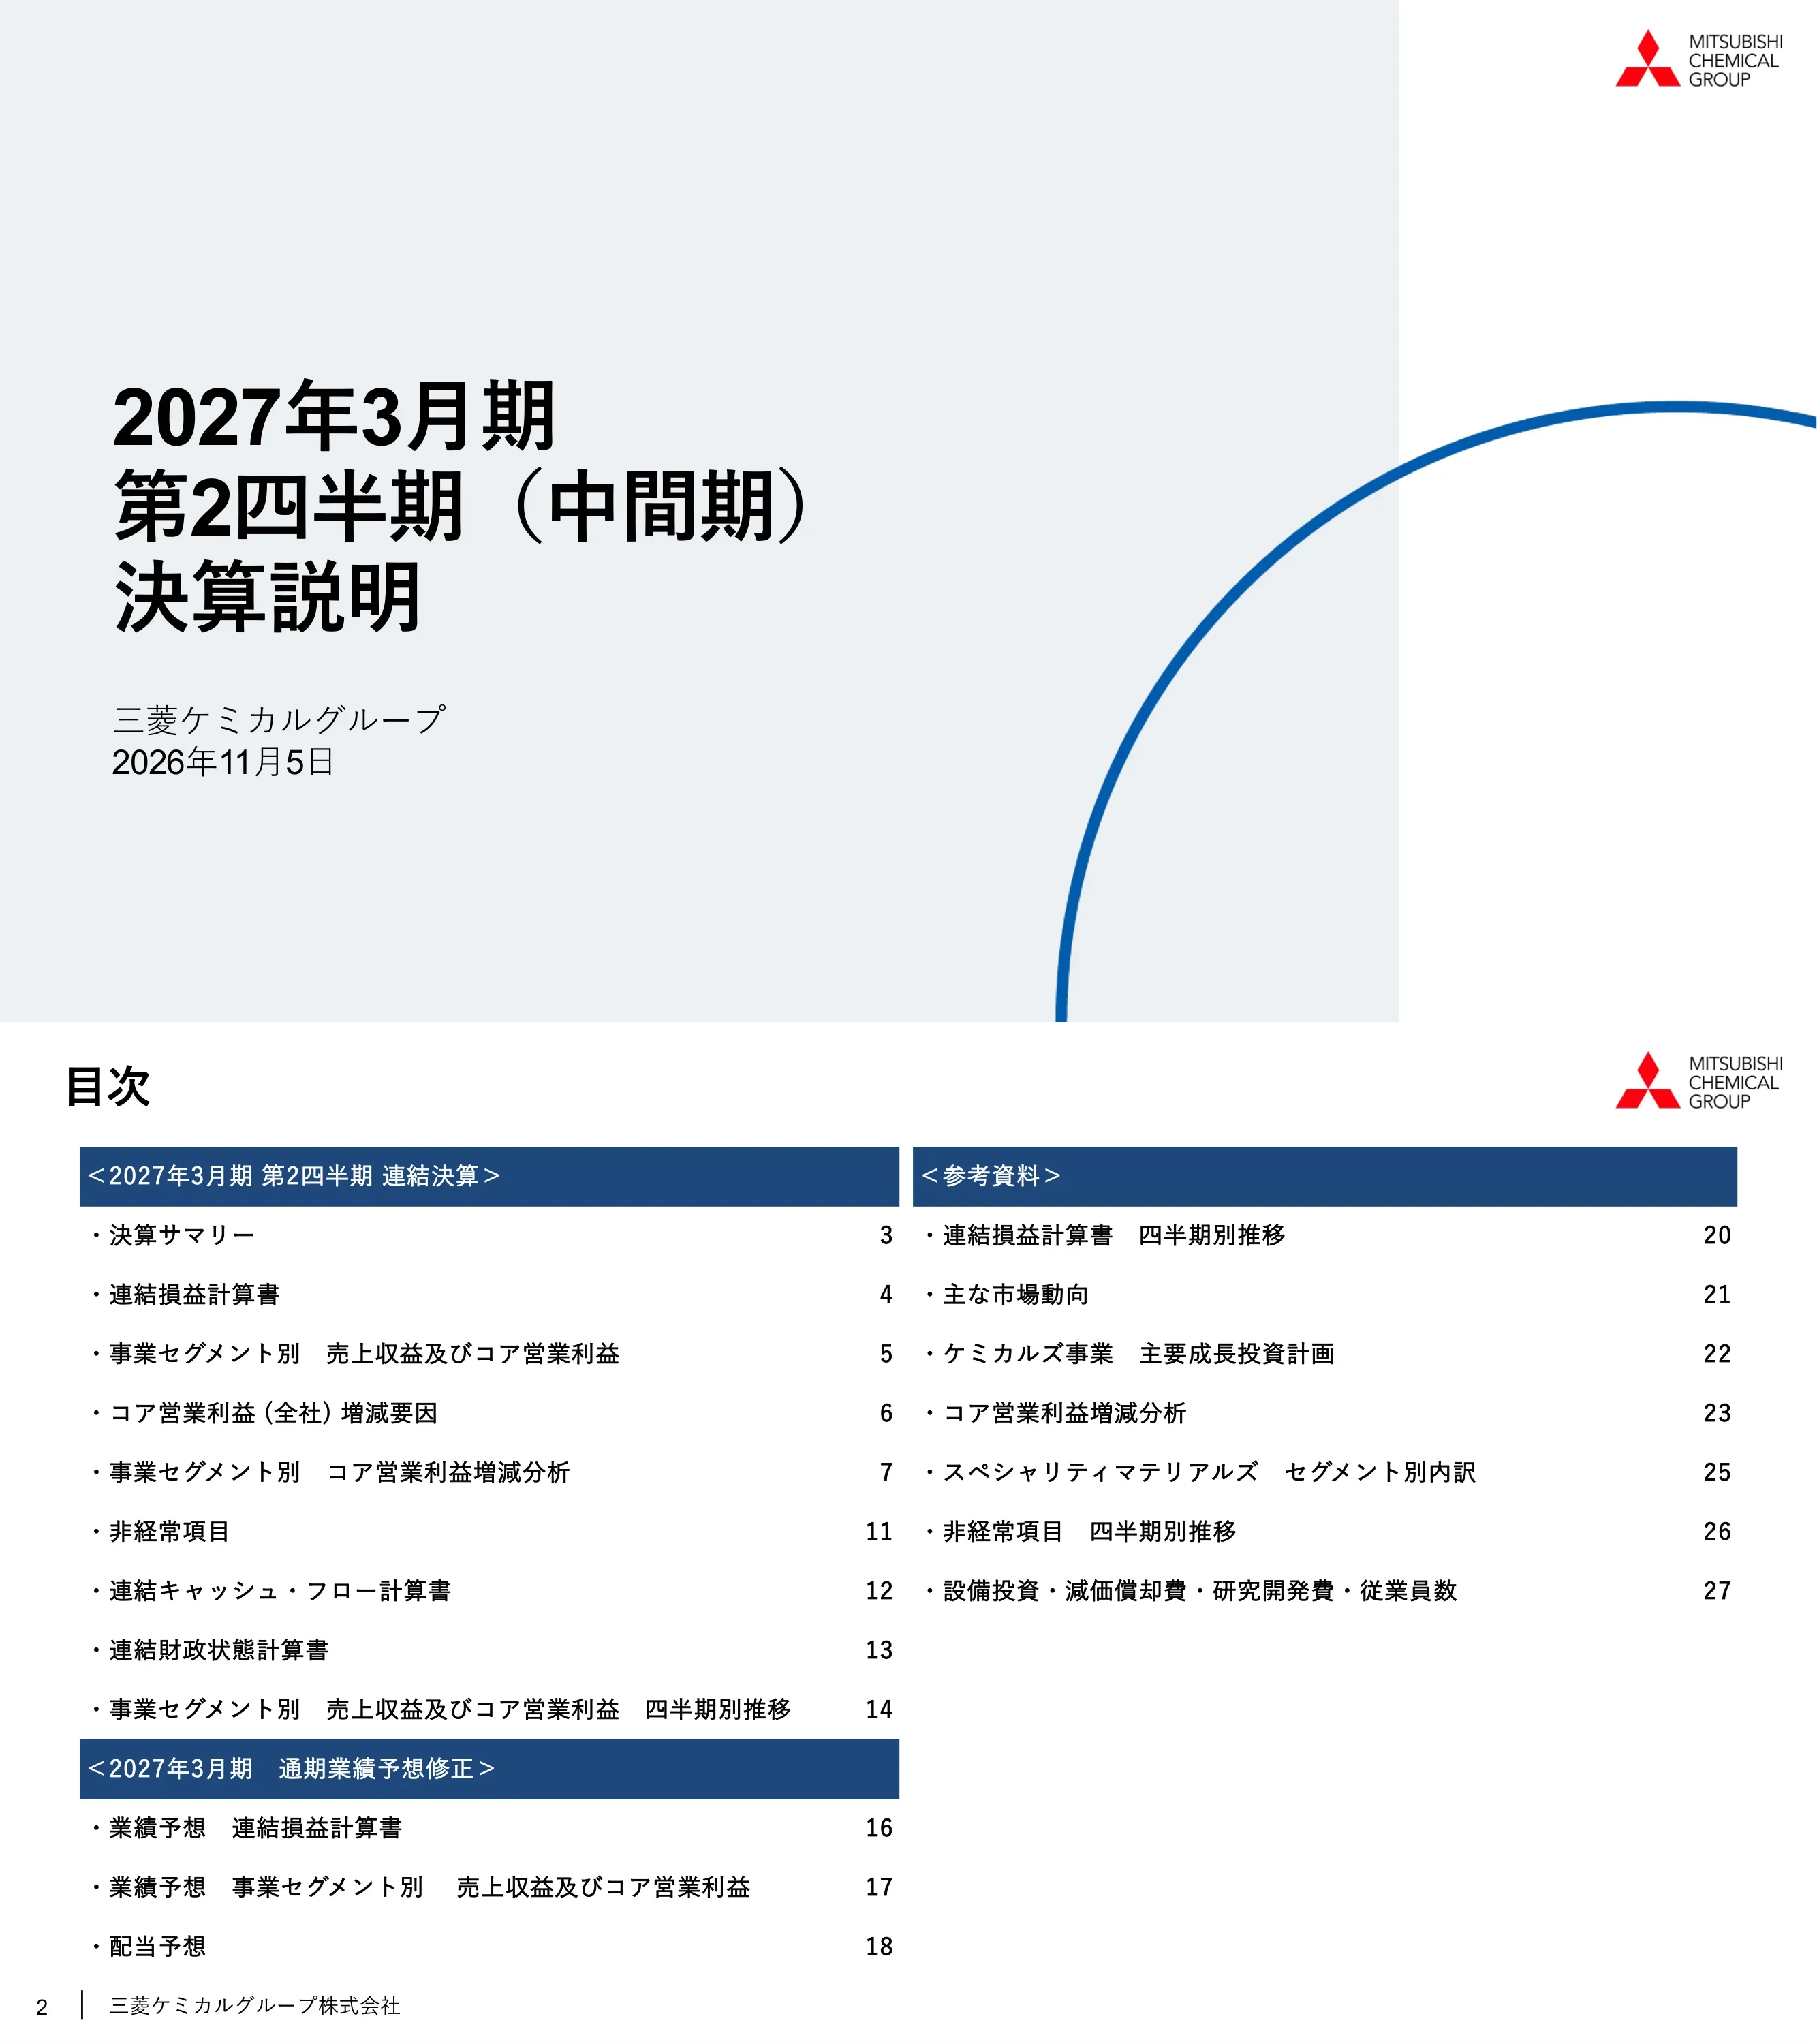
Japanese title slide reading 2027年3月期 第2四半期(中間期)決算説明 (FY ending March 2027 Q2 interim results briefing) for Mitsubishi Chemical Group, dated November 5, 2026.
Large left-aligned black title on a pale gray panel, company name and date below, white right strip with the Mitsubishi Chemical Group logo and a large blue arc
Agenda in three blocks: Q2 consolidated results (pages 3–14), the revised FY ending March 2027 forecast (pages 16–18) and reference materials (pages 20–27).
Two-column table of contents with navy section header bars and right-aligned page numbers
Text summary: chemicals core operating income 951億円 (+620億円) on semiconductor-related volume and cost cuts; group core operating income 2,028億円 (+767億円); interim profit attributable to owners 902億円 (−199億円, because the prior year included the gain on selling the former Mitsubishi Tanabe Pharma). The full-year forecast is raised to 3,400億円 core operating income and 1,450億円 net profit; the annual dividend stays at ¥32.
Two navy header bars (H1 results / full-year forecast), each followed by dense bullet paragraphs
H1 revenue 20,371億円 (+13%), core operating income 2,028億円 (+61%), non-recurring items −31億円, operating income 1,997億円 (+131%), profit before tax 1,824億円 (+165%), interim profit attributable to owners 902億円 (−18%). Average rate ¥160.0/$ versus ¥146.1/$; naphtha ¥108,300/kl versus ¥64,700/kl.
Financial table with prior-year, current-year, change and % change columns; FX and naphtha assumptions in a header strip; footnote defining core operating income
Specialty Materials core operating income 704億円 (+77%), MMA & Derivatives 90億円 (+143%), Basic Materials 141億円 (from −86億円), Chemicals total 951億円 (+187%), Industrial Gases 1,077億円 (+16%). An inset table shows inventory valuation gains of 391億円 versus −113億円 the year before.
Wide segment table with sub-segments indented under each segment, plus a small inventory valuation table at the bottom
Waterfall from 1,261億円 to 2,028億円 (+767億円): price spread +265, volume −10, cost reduction +281, other +231 (including the +504億円 inventory valuation swing). An adjoining table breaks the drivers down by segment; the FX effect is +131億円.
Waterfall chart on the left, driver table by segment on the right
Core operating income rose by 307億円, from 397 to 704億円 (price spread +220, volume +120, cost reduction +100, other −133). Gains came from film prices, films for multilayer ceramic capacitors, engineering plastics for semiconductor equipment, carbon-fiber parts for robotaxis and synthetic quartz; Water & Infrastructure fell 5億円.
Waterfall on the left; navy sub-segment bars with boxed driver tags (price spread / volume / cost reduction) and explanations on the right
Core operating income rose by 53億円, from 37 to 90億円: price spread +137 on higher MMA monomer market prices, volume −88 from lower operating rates and supply disruption linked to the Middle East situation. Functional Chemicals added 51億円 on spreads for additive applications.
Waterfall chart on the left, two commentary blocks on the right
Core operating income turned from −86億円 to 141億円 (+227億円). Price spread −153 (polyolefin price revision lag), volume −79 (larger turnarounds, cheap imports), cost +35, other +424 mainly from inventory valuation gains as naphtha rose. Carbon gained 101億円 on domestic coke volume.
Waterfall crossing a ±0 axis on the left, commentary for Basic Chemicals and Carbon on the right
Core operating income rose by 147億円, from 930 to 1,077億円 (price spread +28, volume +46, cost reduction +98, other −25), driven by demand in Asia and Oceania and by productivity gains from digital tools and plant optimization.
Waterfall chart on the left, one commentary block on the right
Non-recurring items improved from −396億円 to −31億円: gains on sale of fixed assets 137億円, reversal of impairment 21億円, impairment −73億円, special retirement benefits −32億円 (versus −323億円), disaster-related losses −16億円.
Single centered table with prior, current and change columns
Operating cash flow 1,578億円, investing cash flow −949億円 (capex −1,400億円, asset sales 464億円), free cash flow 629億円 versus 3,356億円 a year earlier, financing cash flow −1,640億円 including debt repayment of 1,310億円.
Two side-by-side tables: operating and investing on the left, financing and the change in cash on the right
Total assets 58,021億円 at September 30, 2026; interest-bearing debt fell to 18,880億円, net debt to 14,340億円 and net D/E to 0.79x; equity attributable to owners was 18,197億円.
Assets table on the left, liabilities and equity table on the right, with leverage metrics and footnotes underneath
Quarterly revenue and core operating income for every segment and sub-segment over the last six quarters. Group core operating income was 1,141億円 in Q1 and 887億円 in Q2 of FY2026.
Large dense matrix with a segment index on the left and a revenue/core operating income row pair per segment
Section break titled 2027年3月期 通期業績予想修正 (revised full-year forecast).
Same pale panel and blue arc as the cover, with the section title on the left
FY2026 forecast: revenue 40,600億円 (previously 38,000), core operating income 3,400億円 (previously 3,050, +12%), operating income 3,280億円, net profit attributable to owners 1,450億円 (previously 1,270, +14%). The H2 forecast assumes ¥155/$ and naphtha at ¥100,000/kl.
Table with H1 actual, H2 forecast, new full year, May 13 forecast, change, variance rate and a prior-year reference column
Segment forecasts: Specialty Materials core operating income 1,180億円 (up 280 from the May forecast), Basic Materials 110億円, Chemicals 1,350億円 (up 350), Industrial Gases unchanged at 2,050億円, MMA & Derivatives 100億円.
Dense matrix with segment index, revenue/core operating income row pairs and forecast columns
Policy: a 35% payout ratio target under the 'Medium-Term Management Plan 2029'. Interim dividend set at ¥16 and year-end forecast ¥16, for ¥32 per year (forecast payout ratio 30.0%). The chart shows dividends from FY2017 to FY2026.
Bullet text at the top; stacked bar chart of interim and year-end dividends with a payout-ratio line underneath
Section break titled 参考資料 (reference materials).
Pale panel with blue arc and the title on the left
Quarterly P&L for FY2025 and FY2026 to date, with FX and naphtha by quarter. FY2026 Q1 core operating income was 1,141億円 and Q2 887億円; the table also breaks out finance income and costs, including net interest.
Wide quarterly table with an assumptions strip at the top and shaded cumulative columns
Market outlook for EV/mobility (weaker auto output), semiconductors (strong demand from AI and leading-edge processes, expected to continue), electronics (soft TV demand), medical (steady) and food packaging (soft amid inflation and Middle East effects).
Four-column grid: market, key products, Q2 conditions, outlook from Q3
Timeline of capacity projects by year commercial operation starts, FY25 to FY28: an EUV dry resist precursor plant (US), Lithomax EUV resist polymer (Fukuoka), Soarnol capacity (UK), synthetic quartz expansion (Fukuoka), ultra-high-purity colloidal silica (Fukuoka), and engineering plastics plants in Thailand and Belgium.
Horizontal chevron timeline with project cards in columns, color-coded as next-generation/growth drivers or earnings base
Group core operating income fell from 1,141 to 887億円 (−254) between quarters: the MMA monomer market decline pushed MMA to a loss, Basic Chemicals swung to −23億円 on inventory valuation, and Films & Performance Materials fell on input costs and the Kumamoto earthquake.
Image-based table with a segment column, Q1/Q2/change columns and a wide text column of reasons
H2 core operating income is forecast at 1,372億円, versus 2,028億円 in H1 (−656). Specialty Materials is expected to fall by 228億円 on raw materials, turnarounds and the earthquake; Basic Materials by 172億円 on inventory valuation losses; Industrial Gases by 104億円, mainly on FX.
Image-based table in the same format as page 23
Quarterly revenue and core operating income for each Specialty Materials business (Films, Performance Materials, Engineering Shapes, Carbon Fiber & Composites, Semiconductor, Battery & Electronics, Water & Infrastructure), with mid-term plan targets to FY2029 (segment core operating income 1,550億円) and core operating margins.
Very dense matrix with quarterly actuals, forecast and target columns, plus a margin block on the right
Quarterly non-recurring items: FY2025 totaled −1,949億円 (including −614 impairment and −531 special retirement benefits); FY2026 H1 is −31億円, with a 128億円 gain on fixed asset sales in Q1.
Quarterly table with shaded cumulative columns
H1 capex 1,556億円, depreciation 1,401億円, R&D 255億円 and 56,588 employees at period end, broken down by segment (Industrial Gases has 20,850 employees).
Grouped-column table with paired prior/current half-year columns and a separate employee column
Forward-looking statements disclaimer: forecasts reflect currently available information, and results may differ because of demand, FX, naphtha and crude prices, market conditions, technology, product liability, litigation and regulation.
Centered paragraphs of Japanese text with a blue arc in the bottom-right corner
이 슬라이드 및 기본 프레젠테이션 콘텐츠에 대한 일반적인 질문.
The slides are in Japanese. They are Mitsubishi Chemical Group's 決算説明会資料 (earnings briefing materials) for the interim period of the fiscal year ending March 2027, released on November 5, 2026 through TDnet, the Tokyo Stock Exchange's Timely Disclosure network. This page summarizes the slides in English.
Mitsubishi Chemical Group's fiscal year runs from April to March. FY2026 is April 2026 – March 2027, which the company calls 2027年3月期 (the fiscal year ending March 2027). 'H1 FY2026' covers April–September 2026.
億円 is ¥100 million. H1 revenue of 20,371億円 equals about ¥2.04 trillion, and core operating income of 2,028億円 equals about ¥202.8 billion. The deck uses △ for negative numbers.
It is the company's main profit measure under IFRS: operating income excluding gains and losses from non-recurring factors, such as losses from business withdrawals or downsizing. In H1, core operating income was 2,028億円 and non-recurring items were −31億円, giving operating income of 1,997億円.
It raised the core operating income forecast from 3,050億円 to 3,400億円 and the forecast for profit attributable to owners of the parent from 1,270億円 to 1,450億円. Revenue guidance went up to 40,600億円. The annual dividend forecast stays at ¥32 per share (¥16 interim plus ¥16 year-end).
The segment waterfall slides (pages 6–10) show how to pair a profit bridge with commentary on each driver. Page 22 is a clean chevron timeline of investments, and page 18 combines stacked dividend bars with a payout-ratio line.
Yes. The original PDF is available here, along with a PPTX converted from it. Converted text uses stand-in fonts, so check the Japanese typography before reusing any slide.

Create Your Own Slides
Turn your ideas into professional presentations in seconds with 2slides AI.
전문 디자인을 참조하고, 스타일을 선택하며, 완벽한 텍스트 렌더링으로 슬라이드를 생성하세요. Nano Banana로 구동—지금 프레젠테이션 만들기를 시작하세요.


