
Microsoft's fourth quarter fiscal year 2026 results presentation (July 29, 2026) — a 23-slide earnings deck covering revenue of $90.0 billion up 18%, operating income of $40.6 billion up 18%, net income of $35.8 billion and diluted EPS of $4.81 up 32%, Microsoft Cloud revenue of $59.3 billion up 27%, commercial remaining performance obligations of $678 billion up 84%, capital expenditures up 70% to $41.0 billion with free cash flow down 23% to $19.6 billion, segment overviews for Productivity and Business Processes, Intelligent Cloud and More Personal Computing, and a nine-page appendix reconciling the impact of the OpenAI investment, constant currency and cash flow.
빠른 탐색
태그
슬라이드 공유
Microsoft's fourth quarter fiscal year 2026 results presentation (July 29, 2026) — a 23-slide earnings deck covering revenue of $90.0 billion up 18%, operating income of $40.6 billion up 18%, net income of $35.8 billion and diluted EPS of $4.81 up 32%, Microsoft Cloud revenue of $59.3 billion up 27%, commercial remaining performance obligations of $678 billion up 84%, capital expenditures up 70% to $41.0 billion with free cash flow down 23% to $19.6 billion, segment overviews for Productivity and Business Processes, Intelligent Cloud and More Personal Computing, and a nine-page appendix reconciling the impact of the OpenAI investment, constant currency and cash flow.
레이아웃, 주요 콘텐츠 및 시각적 요소를 포함한 각 슬라이드 페이지의 상세 보기.
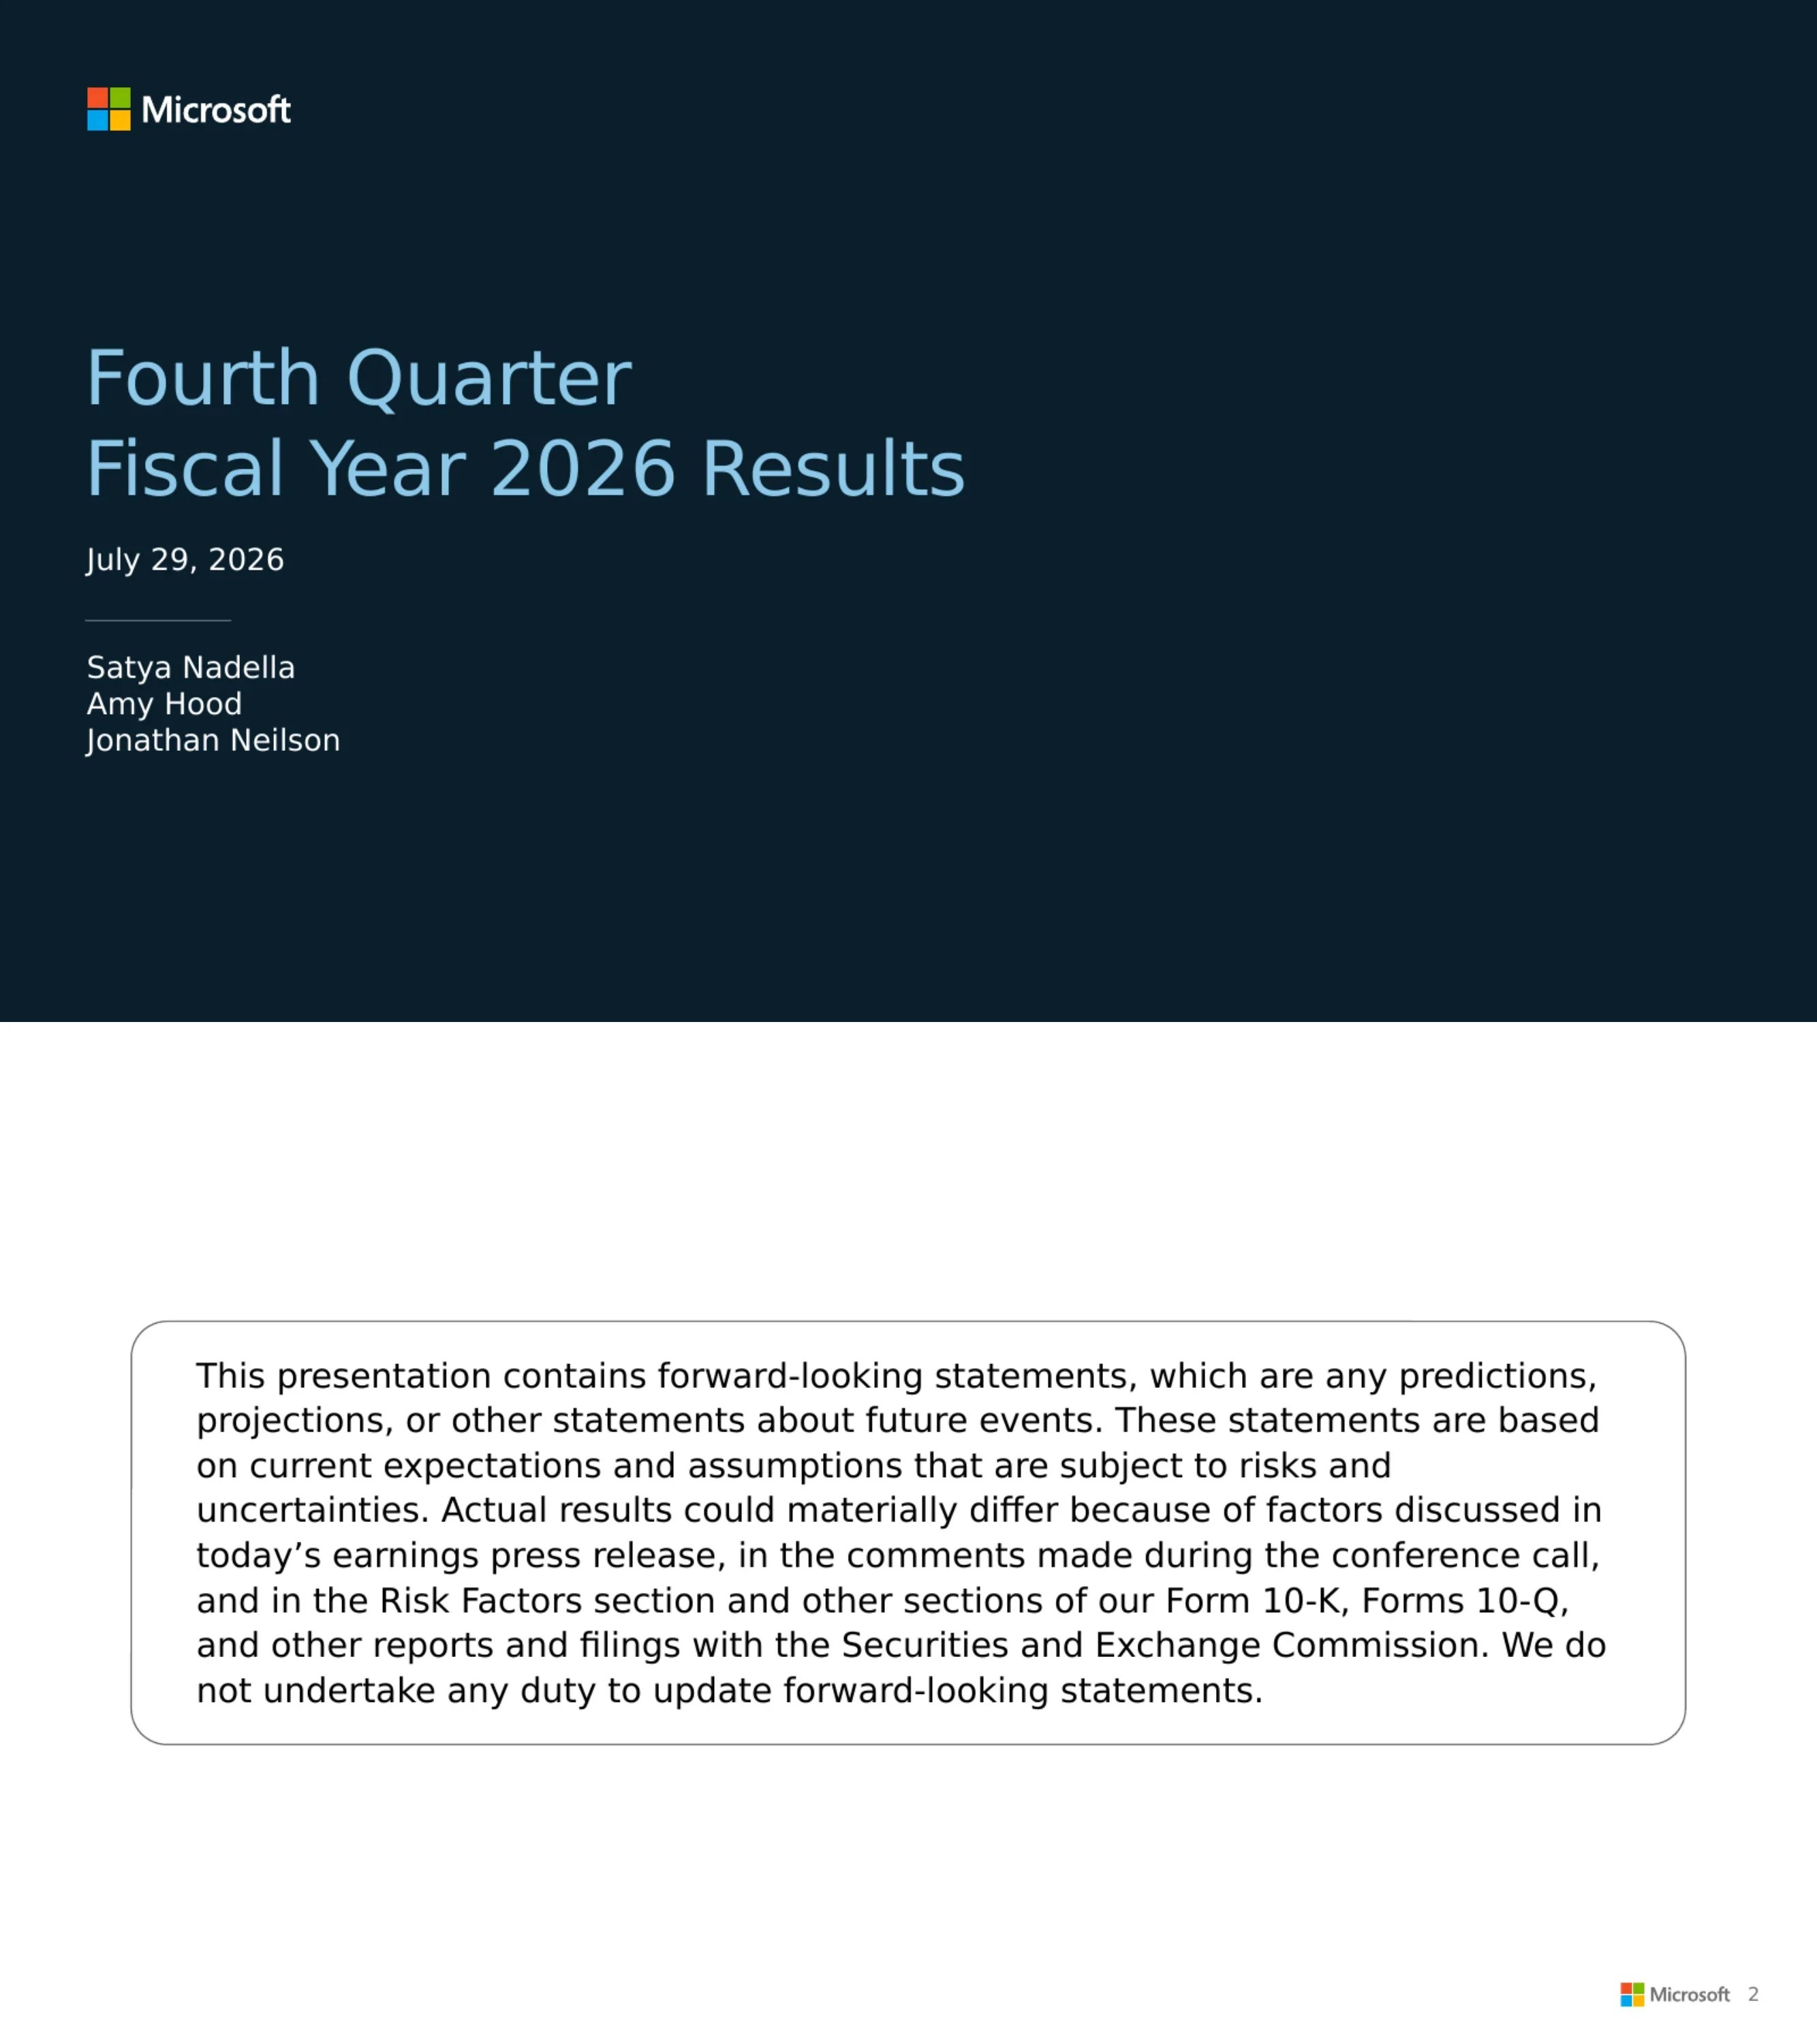
Cover slide for Microsoft's fourth quarter fiscal year 2026 results, dated July 29, 2026, with presenters Satya Nadella, Amy Hood and Jonathan Neilson.
Near-black navy field with the four-square Microsoft logo and wordmark at the top left; a two-line title in pale blue at left-centre; the date below it in white; a short hairline rule; then the three presenter names stacked in white.
Safe-harbour notice stating that forward-looking statements are based on current expectations and assumptions subject to risks, that actual results could differ because of factors discussed in the earnings press release, on the conference call and in the Risk Factors section of the Form 10-K and Forms 10-Q, and that Microsoft undertakes no duty to update them.
White slide with a single rounded-rectangle outline holding one paragraph of large body text, centred vertically. Microsoft logo and page number in the bottom right.
Four sections: Financial Summary and Highlights, Business Highlights, Segment Overview and Highlights, Appendix. A footer notes that all growth comparisons relate to the corresponding period of last fiscal year and that numbers may not foot due to rounding.
Rounded-rectangle container split by a vertical rule: the word 'Agenda' in bold at the left, the four section names stacked at the right. Italic footnote across the bottom of the slide.
The full quarter in one table, in billions except per share: Productivity and Business Processes $37.8B up 14% (14% CC), Intelligent Cloud $39.3B up 32% (31% CC), More Personal Computing $12.9B down 4% (down 5% CC), revenue $90.0B up 18% (17% CC). Cost of revenue $29.5B up 23%; gross margin $60.5B up 15%, gross margin percentage 67%, down 1 point; operating expense $19.9B up 10%; operating income $40.6B up 18%, operating income percentage 45%, flat; other income and expense $3.4B; net income $35.8B up 31%; diluted EPS $4.81 up 32%. The commentary column adds that Microsoft Cloud grew 27%, that the gross margin percentage fell on sales mix shift to Azure and AI infrastructure investment, that total headcount decreased 2% year over year, that other income was driven by a $3.2 billion gain on the Anthropic investment, and that the effective tax rate was 19%.
Left two-thirds: a three-column table (FY26 Q4, Growth, CC Growth) with alternating grey and white rows, segment lines indented above a bold revenue subtotal, and percentage rows set in italic. Right third: a blue 'Summary of Results' heading over eight commentary bullets. Italic footnote pointing to the appendix.
Two blocks. Impact from investments in OpenAI: other income and expense $3.4B as reported, $(0.6)B impact, $2.8B as adjusted, against $(1.7)B / $2.1B / $0.4B a year earlier; net income $35.8B / $(0.5)B / $35.3B against $27.2B / $1.6B / $28.8B, growing 31% on a GAAP basis but 22% non-GAAP; diluted EPS $4.81 / $(0.07) / $4.74 against $3.65 / $0.21 / $3.86, up 32% GAAP and 23% non-GAAP. Impact from discrete items relative to the April 29, 2026 guidance, a net benefit of $0.27 on diluted EPS: severance and impairment charges in XBOX, partially offset by lower-than-expected Voluntary Retirement Program expenses, cost $(0.5) billion of operating income and $(0.06) of EPS; the $3.2 billion Anthropic gain added $0.33; the discrete items together added $2.0 billion to net income inclusive of tax.
Upper half: a nine-column table grouping FY26 Q4, FY25 Q4 and Growth, each group split into as-reported, impact and as-adjusted. Lower half: four labelled grey rows — Operating Income, Other Income and Expense, Net Income, Diluted EPS — each with a bullet explaining its discrete item.
Cash returned to shareholders of $10.2 billion, comprising $6.8 billion of dividends and $3.4 billion of share repurchases. Capital expenditures including finance leases increased 70% to $41.0 billion, with roughly two-thirds for short-lived assets — primarily CPUs and GPUs supporting Azure demand, first-party apps and R&D — and the remainder for long-lived assets; cash paid for property and equipment was $35.8 billion, up 110%; finance leases, primarily for large datacenter sites, were $5.6 billion. Cash flow from operations was $55.4 billion, up 30%; free cash flow was $19.6 billion, down 23%. A trended table gives capital expenditures of $24.2B, $34.9B, $37.5B, $31.9B and $41.0B across the five quarters, cash paid for property and equipment of $17.1B, $19.4B, $29.9B, $30.9B and $35.8B, finance leases of $6.5B, $11.1B, $6.7B, $4.7B and $5.6B, and a short-lived asset mix moving from under half to about two-thirds.
Three blue subheadings — Cash Returned to Shareholders, Capital Expenditures, Cash Flow — each over its bullets, filling the upper two-thirds; a four-row trended table across five quarters occupies the lower third, with alternating row shading.
Commercial bookings grew 18% excluding the impact from OpenAI, and increased 10% (up 11% CC) including Azure commitments from OpenAI. Commercial remaining performance obligation of $678 billion grew 84%, with all sequential growth driven by customers outside frontier model companies; RPO increased 25% excluding OpenAI, has a weighted average duration of 2.3 years, and roughly 30% will be recognised in the next twelve months, up 37%, with the portion beyond twelve months up 112%. Microsoft Cloud revenue of $59.3 billion increased 27%; Microsoft Cloud gross margin percentage decreased to 65%. The investor metrics table gives commercial bookings growth of 37%/30%, 112%/111%, 230%/228%, (4)%/(6)% and 10%/11%; commercial RPO of $368B, $392B, $625B, $627B and $678B; Microsoft Cloud revenue of $46.7B, $49.1B, $51.5B, $54.5B and $59.3B; and Microsoft Cloud gross margin of 68%, 68%, 67%, 66% and 65%.
Two blue subheadings — Commercial Business and Microsoft Cloud — over their bullets in the upper half; a five-row investor metrics table across five quarters below, with alternating shading and a two-line definition footnote.
Revenue grew 14% driven by Microsoft 365 Commercial cloud; cost of revenue grew 16% on AI infrastructure investment supporting M365 Copilot seat and usage growth; gross margin dollars grew 14% (up 13% CC) with the percentage slightly down; operating expenses grew 11%; operating income grew 15% (up 14% CC) with margins slightly up on operating leverage. The trend chart shows segment revenue of $33.1B, $33.0B, $34.1B, $35.0B and $37.8B (+14%) with operating income of $19.0B, $20.4B, $20.6B, $21.0B and $21.9B (+15%, +14% CC).
Blue 'Results' heading over five bullets in the upper half; below, a rounded panel with a grey legend block at the left and five two-tone columns at the right — bright blue revenue above dark navy operating income — with totals above and operating income values reversed out inside.
Microsoft 365 Commercial cloud revenue grew 16% on an adjusted basis and 14% as reported, driven by revenue per user from premium offerings including M365 Copilot, which surpassed 30 million paid seats; Microsoft 365 Commercial seats grew 6%. Microsoft 365 Commercial products revenue grew 19%. Microsoft 365 Consumer cloud revenue grew 24% (up 22% CC) with subscriber growth of 7%. LinkedIn revenue grew 12% (up 10% CC) on Marketing Solutions. Dynamics 365 revenue grew 13% (up 12% CC). The metrics table gives five quarters of each growth rate in GAAP / CC pairs.
Four blue subheadings — Microsoft 365 Commercial, Microsoft 365 Consumer, LinkedIn, Dynamics — over their bullets; a five-row investor metrics table across five quarters beneath, with alternating shading.
Revenue grew 32% (up 31% CC) driven by Azure; cost of revenue grew 42% on AI infrastructure investment and increased GitHub Copilot usage; gross margin dollars grew 24% with the percentage down on sales mix shift to Azure and continued scaling of AI infrastructure ahead of demand; operating expenses grew 10%; operating income grew 31% with margins relatively unchanged. The trend chart shows segment revenue of $29.9B, $30.9B, $32.9B, $34.7B and $39.3B (+32%, +31% CC) with operating income of $12.1B, $13.4B, $13.9B, $13.8B and $16.0B (+31%).
The Productivity segment layout repeated exactly — Results bullets above, the same two-tone five-column chart in a rounded panel below with its grey legend block.
Azure and other cloud services revenue grew 43% on strong demand across all workloads; server products revenue was relatively unchanged (down 1% CC) as customers continue shifting to cloud, partially offset by higher purchasing of licenses running in multi-cloud environments; enterprise and partner services revenue grew 6% (up 5% CC) on Enterprise Support Services. Tables give Azure growth of 39%, 40%/39%, 39%/38%, 40%/39% and 43%; server products growth of (2)%/(3)%, 1%/0%, 2%/1%, 1%/(3)% and 0%/(1)%; and enterprise and partner services growth of 7%/6%, 5%/3%, 8%/7%, 7%/4% and 6%/5%.
Two blue subheadings over short bullets in the upper third; two separate tables beneath — a single-row Investor Metrics table for Azure and a two-row Trended Revenue Growth table — with generous empty space at the bottom.
Revenue declined 4% (down 5% CC) driven by XBOX and Windows OEM and Devices, partially offset by growth in Search advertising; cost of revenue declined 8% on lower amortisation of Activision intangibles; gross margin dollars declined 2% with the percentage up for the same reason; operating expenses grew 8% (up 7% CC) on R&D investment and XBOX impairment charges; operating income declined 14% (down 15% CC). The trend chart shows segment revenue of $13.5B, $13.8B, $14.3B, $13.2B and $12.9B (-4%, -5% CC) with operating income of $3.2B, $4.2B, $3.8B, $3.7B and $2.7B (-14%, -15% CC).
The same segment layout a third time, here with the chart running the other way — the final columns are the shortest in the series rather than the tallest.
Windows OEM and Devices declined 7% on lower PC market demand and a high prior-year comparable from Windows 10 end of support, partially offset by inventory builds. XBOX content and services revenue declined 10% against a prior year that benefited from strong first-party content; XBOX hardware revenue declined 13% (down 14% CC). Search advertising revenue excluding traffic acquisition costs grew 10% (up 9% CC) on higher revenue per search and search volume. The table gives five quarters of each.
Three blue subheadings — Windows OEM and Devices, XBOX, Search — over their bullets; a three-row metrics table across five quarters beneath, with alternating shading.
Section divider marking the start of the appendix.
Near-black navy field with the single word 'Appendix' in white at left-centre. Nothing else.
Introduction to the reconciliation section, listing the three reconciliations that follow: impact from investments in OpenAI, constant currency reconciliations, and cash flow reconciliation.
Rounded-rectangle container split by a vertical rule — the three-line heading at the left, two short paragraphs and a three-item bullet list at the right. Same construction as the agenda slide.
Reconciliation for the three months ended June 30, in millions except per share. Other income and expense $3,444 as reported, $(632) adjustment, $2,812 as adjusted for 2026, against $(1,707), $2,071 and $364 for 2025. Effective tax rate 19% with no adjustment for 2026 and 17% for 2025, a 2-point GAAP change. Net income $35,766, $(480), $35,286 for 2026 against $27,233, $1,575, $28,808 for 2025 — up 31% GAAP and 22% non-GAAP. Diluted EPS $4.81, $(0.07), $4.74 against $3.65, $0.21, $3.86 — up 32% GAAP and 23% non-GAAP.
Ten-column table grouped under 2026, 2025 and Percentage Change Y/Y headers with blue column labels, horizontal rules only, bold row labels at the left, and a three-line non-GAAP caveat at the bottom.
For the three months ended June 30, in millions: revenue $90,007 against $76,441, up 18% GAAP with a $391 constant currency impact and 17% CC growth; cost of revenue $29,525 against $24,014, up 23% with $125 impact and 22% CC; gross margin $60,482 against $52,427, up 15% with $266 impact and 15% CC; operating expenses $19,879 against $18,104, up 10% with a $(3) impact and 10% CC; operating income $40,603 against $34,323, up 18% with $269 impact and 18% CC; net income $35,766 GAAP and $35,286 adjusted against $27,233 and $28,808, up 31% GAAP and 22% non-GAAP; diluted EPS $4.81 and $4.74 against $3.65 and $3.86, up 32% and 23%.
Nine-column table with as-reported and as-adjusted pairs for each year plus four change columns, blue headers, horizontal rules only, and a four-line explanation of the constant currency method at the bottom.
Three months ended June 30, in millions: Productivity and Business Processes $37,847 against $33,112, up 14% GAAP with a $244 impact and 14% CC; Intelligent Cloud $39,306 against $29,878, up 32% with an $80 impact and 31% CC; More Personal Computing $12,854 against $13,451, down 4% with a $67 impact and down 5% CC.
Compact five-column table filling the upper third of the slide, blue headers, horizontal rules only, the same method footnote at the bottom and the rest left empty.
Percentage changes for the three months ended June 30, 2026. Segment cost of revenue: Productivity and Business Processes 16% GAAP, 0% currency impact, 16% CC; Intelligent Cloud 42%, 0%, 42%; More Personal Computing (8)%, 0%, (8)%. Segment gross margin: Productivity and Business Processes 14%, (1)%, 13%; Intelligent Cloud 24%, 0%, 24%; More Personal Computing (2)%, 0%, (2)%.
Two three-row tables stacked with blue subheadings, each with the same three percentage columns, horizontal rules only, and the shared method footnote.
Percentage changes for the three months ended June 30, 2026. Segment operating expense: Productivity and Business Processes 11% GAAP, 0%, 11% CC; Intelligent Cloud 10%, 0%, 10%; More Personal Computing 8%, (1)%, 7%. Segment operating income: Productivity and Business Processes 15%, (1)%, 14%; Intelligent Cloud 31%, 0%, 31%; More Personal Computing (14)%, (1)%, (15)%.
The previous slide's construction repeated — two stacked three-row tables under blue subheadings with the same columns and footnote.
Fifteen product and service lines for the three months ended June 30, 2026, each with GAAP growth, currency impact and constant currency growth: commercial bookings 10%/1%/11%; commercial RPO 84%/0%/84%; Microsoft Cloud revenue 27%/0%/27%; Microsoft 365 Commercial cloud 14%/0%/14%; Microsoft 365 Commercial products 19%/0%/19%; Microsoft 365 Consumer cloud 24%/(2)%/22%; LinkedIn 12%/(2)%/10%; Dynamics 365 13%/(1)%/12%; Azure and other cloud services 43%/0%/43%; server products 0%/(1)%/(1)%; enterprise and partner services 6%/(1)%/5%; Windows OEM and Devices (7)%/0%/(7)%; XBOX content and services (10)%/0%/(10)%; XBOX hardware (13)%/(1)%/(14)%; Search advertising excluding traffic acquisition costs 10%/(1)%/9%.
Single fifteen-row table with three percentage columns, hairline rules between rows, blue column headers, and the shared method footnote — the densest slide in the deck.
Three months ended June 30, in millions: net cash from operations (GAAP) $55,441 against $42,647, up 30%; additions to property and equipment $(35,802) against $(17,079), up 110%; free cash flow $19,639 against $25,568, down 23%. A footnote states that free cash flow is included as an additional clarifying item and should not be considered a substitute for GAAP measures.
Three-row table with four columns across the upper third, bold GAAP and free cash flow rows, the additions line indented between them, and the non-GAAP caveat at the bottom of an otherwise empty slide.
Closing slide carrying only the Microsoft logo and copyright line.
Near-black navy field with the four-square logo and wordmark at the top left and the copyright notice at the bottom left. Nothing between them.
이 슬라이드 및 기본 프레젠테이션 콘텐츠에 대한 일반적인 질문.
The full 23-slide Microsoft FY26 Q4 results presentation as both PowerPoint and PDF, plus a page-by-page preview. Unlike most decks here, the PowerPoint is Microsoft's own published file rather than a conversion — every table, chart and layout comes apart cleanly for editing. The PDF was generated from that PowerPoint.
Yes. The PowerPoint is the file Microsoft published on its investor relations site for the quarter ended June 30, 2026, presented on July 29, 2026 by Satya Nadella, Amy Hood and Jonathan Neilson.
Revenue $90.0 billion, up 18%; operating income $40.6 billion, up 18%, at a 45% margin; net income $35.8 billion, up 31%; diluted EPS $4.81, up 32%. Microsoft Cloud revenue was $59.3 billion, up 27%, and commercial remaining performance obligation reached $678 billion, up 84%.
The deck strips it out explicitly. Excluding the OpenAI impact, net income grew 22% rather than 31% and diluted EPS grew 23% rather than 32%; commercial bookings grew 18% excluding OpenAI but 10% including the Azure commitments, and RPO grew 25% excluding OpenAI against 84% including it. Slides 5 and 16 carry the full reconciliation.
Capital expenditure. Cash flow from operations rose 30% to $55.4 billion, but additions to property and equipment rose 110% to $35.8 billion, so free cash flow fell 23% to $19.6 billion. Including finance leases, total capital expenditures were $41.0 billion, up 70%, with roughly two-thirds going to short-lived assets — mainly CPUs and GPUs.
It restates the current period using the prior period's exchange rates, so growth reflects the business rather than the dollar. Microsoft gives both figures for every line, and slides 17 through 21 show the reconciliation — including the currency impact in dollars, not just the adjusted percentage.
It is one of the cleanest multi-segment templates available. The structure holds up for any company with more than one reporting segment: full P&L with commentary beside it, one slide isolating anything unusual in the quarter, cash and capital highlights, then two slides per segment — overview with a trend chart, highlights with the product metrics — and reconciliations in the appendix.
Discipline about where numbers live. Tables carry the figures, bullets carry the reasons, and the two sit side by side instead of competing. The only chart type in the whole deck is a two-tone stacked column, used identically for all three segments, so by the third one the reader is comparing rather than decoding. Dividers are near-black navy; everything else is white with blue headings.
Original PowerPoint published by Microsoft alongside the FY26 Q4 earnings release on July 29, 2026.

Create Your Own Slides
Turn your ideas into professional presentations in seconds with 2slides AI.
전문 디자인을 참조하고, 스타일을 선택하며, 완벽한 텍스트 렌더링으로 슬라이드를 생성하세요. Nano Banana로 구동—지금 프레젠테이션 만들기를 시작하세요.
Your AI Agent for slides. Save time, shine faster with intelligent presentation creation.




© 2026 2slides. All rights reserved.