
수록 모음: 투자자 발표자료 사례 · 인도 기업 IR 자료 예시
Maruti Suzuki India Q2 FY27 and H1 FY27 standalone financial results presentation (27 October 2026), filed with BSE/NSE: sales volume, net sales, operating EBITDA/EBIT, PBT and PAT versus Q2 FY26, Q1 FY27 and H1 FY26, key cost ratios as a percentage of net sales, margin drivers, and domestic/export and segment-wise vehicle sales volumes.
이 프레젠테이션의 표지를 스타일 참고 자료로 사용해 내 콘텐츠로 슬라이드를 만듭니다. 아래에서 원하는 페이지를 골라 그 레이아웃을 참고로 쓸 수도 있습니다.
빠른 탐색
태그
슬라이드 공유
Maruti Suzuki India Q2 FY27 and H1 FY27 standalone financial results presentation (27 October 2026), filed with BSE/NSE: sales volume, net sales, operating EBITDA/EBIT, PBT and PAT versus Q2 FY26, Q1 FY27 and H1 FY26, key cost ratios as a percentage of net sales, margin drivers, and domestic/export and segment-wise vehicle sales volumes.
레이아웃, 주요 콘텐츠 및 시각적 요소를 포함한 각 슬라이드 페이지의 상세 보기.
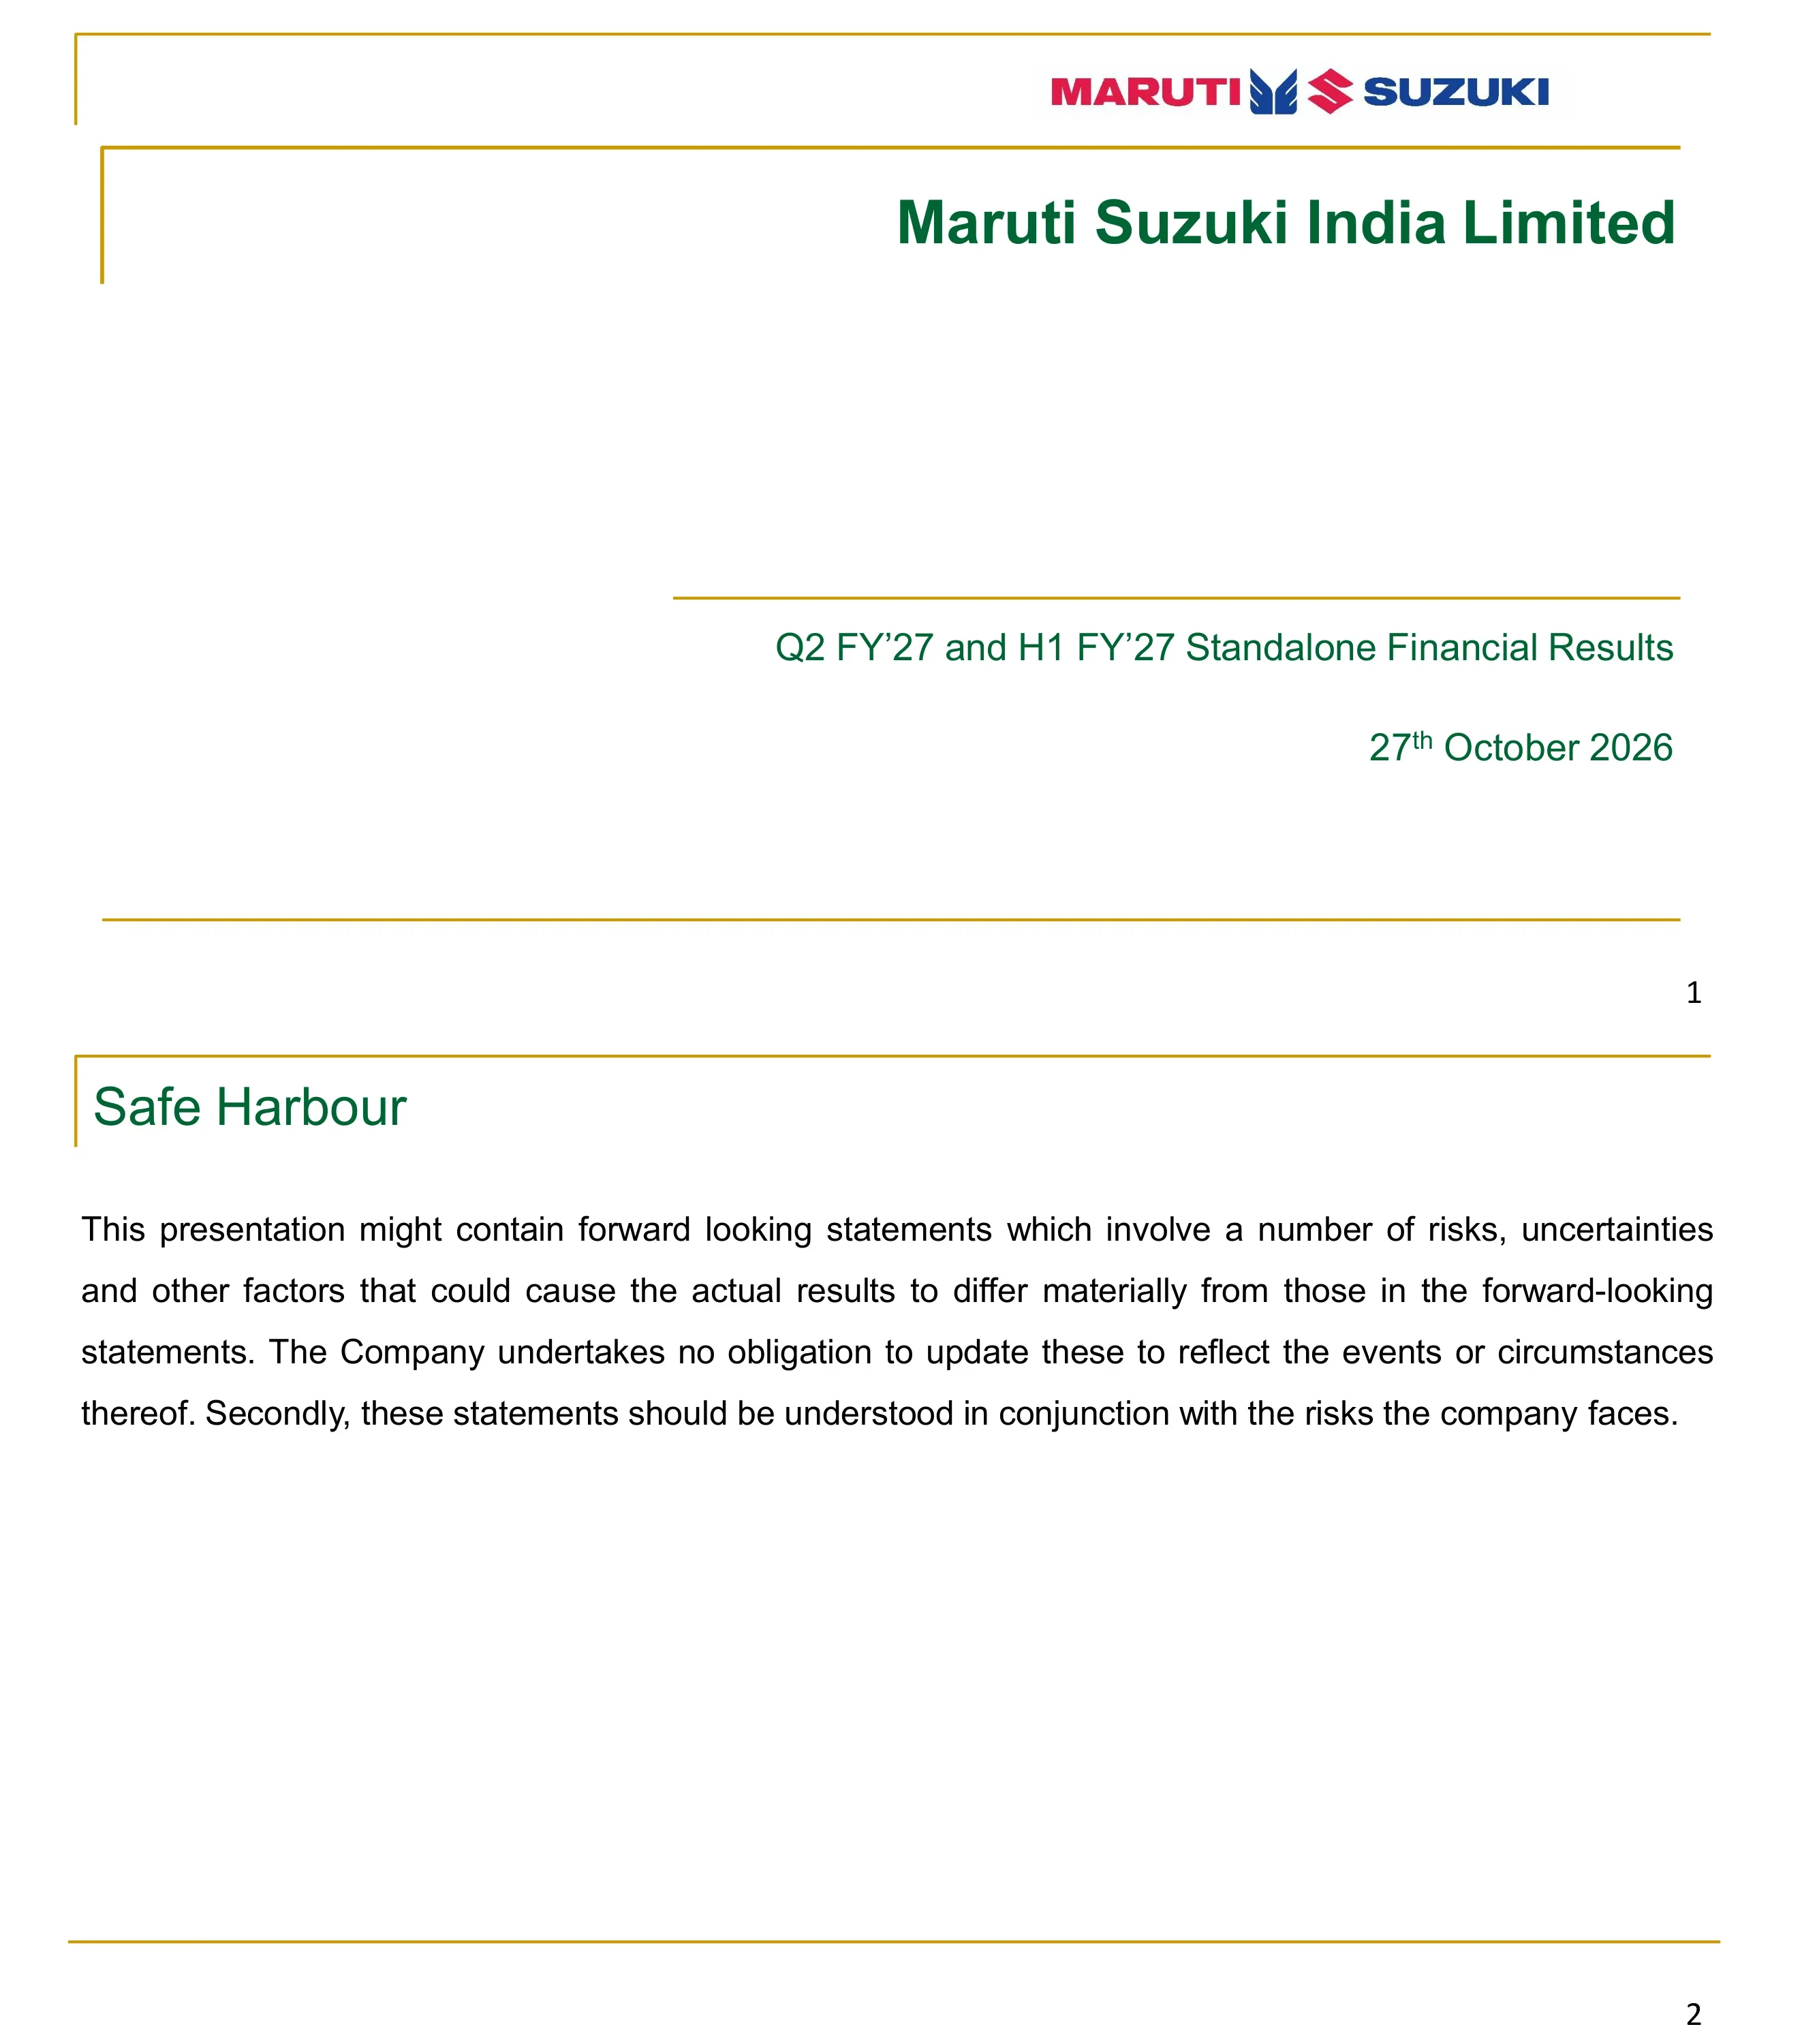
Cover slide with the Maruti Suzuki logo, company name, the subtitle 'Q2 FY'27 and H1 FY'27 Standalone Financial Results' and the date 27th October 2026.
Right-aligned title block: logo top right, large green company name under a gold frame line, subtitle and date lower right above a gold rule; generous white space on the left.
Forward-looking statements disclaimer: actual results may differ materially due to risks and uncertainties; the company undertakes no obligation to update the statements, which should be read with the risks the company faces.
Standard content layout: green title top left inside a gold corner bracket, one justified paragraph across the slide width, gold rule at the bottom and page number.
Agenda in four sections: Q2 FY'27 vs Q2 FY'26, Q2 FY'27 vs Q1 FY'27 and H1 FY'27 vs H1 FY'26 (each with a ratio comparison), then Sales Volume. A note explains that Suzuki Motor Gujarat (SMG), a wholly owned subsidiary, amalgamated with MSIL from 1 December 2025 with an appointed date of 1 April 2025, so prior periods are restated; footnotes state all figures are in INR million except sales volume and ratios, and ratios may be approximate due to rounding.
Numbered list with gold numerals and green arrow sub-bullets, an italic bold-labelled note block at the bottom and two small footnotes beneath the gold rule.
Section break introducing the year-on-year quarter comparison of Q2 FY'27 against Q2 FY'26.
Centered three-line text stack ('Q2 FY'27 / w.r.t. / Q2 FY'26') inside the gold frame lines.
Sales volume 696,654 vs 550,874 units (+26.5%); net sales INR 506,155 million vs 401,358 million (+26.1%); operating EBITDA 47,633 vs 50,848 (-6.3%); operating EBIT 28,037 vs 33,820 (-17.1%); PBT 31,658 vs 42,909 (-26.2%); PAT 24,149 vs 33,028 (-26.9%). Figures except sales volume are in INR million.
Three-column table (metric, Q2 FY'27, Q2 FY'26) with a yellow header row, and a separate column of percentage changes with green up arrows or red down arrows to the right.
Material cost 79.9% vs 75.7% (+420 bps); employee cost 4.6% vs 5.1% (-50); other expenses 11.5% vs 12.0% (-50); other operating income 5.4% vs 5.5% (-10); operating EBITDA margin 9.4% vs 12.7% (-330); depreciation 3.9% vs 4.2% (-40); operating EBIT 5.5% vs 8.4% (-290); interest 0.1% unchanged; non-operating income 0.8% vs 2.4% (-160); PBT 6.3% vs 10.7% (-440); PAT 4.8% vs 8.2% (-340).
Four-column ratio table (parameter, current, prior, change in bps) with yellow header, Op. EBITDA and PAT rows highlighted in yellow, and red/green arrows beside each change; colour legend at bottom left.
Key reasons for margin movement. Negative factors: adverse commodity prices in the context of the West Asia conflict, adverse foreign exchange movement, lower non-operating income due to mark-to-market losses on invested surplus. Positive factors: improved realization, favourable operating leverage, cost reduction efforts.
Text slide with a bold 'Key reasons for margin movement' lead-in, then two bold sub-headings (Negative Factors, Positive Factors) each followed by gold square bullets.
Section break introducing the sequential (quarter-on-quarter) comparison of Q2 FY'27 against Q1 FY'27.
Centered three-line text stack inside the gold frame lines, identical to the other dividers.
Sales volume 696,654 vs 682,724 units (+2.0%); net sales INR 506,155 million vs 499,591 million (+1.3%); operating EBITDA 47,633 vs 43,111 (+10.5%); operating EBIT 28,037 vs 25,311 (+10.8%); PBT 31,658 vs 43,413 (-27.1%); PAT 24,149 vs 33,521 (-28.0%).
Same highlights table design as page 5 with yellow header and green/red arrow change column.
Material cost 79.9% vs 80.5% (-60 bps); employee cost 4.6% vs 4.9% (-30); other expenses 11.5% vs 11.0% (+50); other operating income 5.4% vs 5.0% (+40); operating EBITDA 9.4% vs 8.6% (+80); depreciation 3.9% vs 3.6% (+30); operating EBIT 5.5% vs 5.1% (+40); interest 0.1% unchanged; non-operating income 0.8% vs 3.7% (-290); PBT 6.3% vs 8.7% (-240); PAT 4.8% vs 6.7% (-190).
Ratio table matching page 6, with highlighted EBITDA and PAT rows, bps change column and red/green arrows plus legend.
Negative factors: adverse commodity prices in the context of the West Asia conflict, adverse foreign exchange movement, higher manufacturing overheads, higher depreciation due to a new facility and new model dies, lower non-operating income due to mark-to-market losses on invested surplus. Positive factors: improved realization, favourable Fixed Cost Incidence (FCI) due to inventory accretion, cost reduction efforts.
Same two-group bullet layout as page 7, with five negative and three positive bullets.
Section break introducing the half-year comparison of H1 FY'27 (April–September 2026) against H1 FY'26.
Centered three-line text stack inside the gold frame lines.
Sales volume 1,379,378 vs 1,078,735 units (+27.9%); net sales INR 1,005,746 million vs 767,564 million (+31.0%); operating EBITDA 91,750 vs 97,054 (-5.5%); operating EBIT 54,354 vs 64,469 (-15.7%); PBT 75,071 vs 91,969 (-18.4%); PAT 57,670 vs 70,609 (-18.3%).
Same highlights table design with yellow header and arrow change column.
Material cost 80.2% vs 75.1% (+510 bps); employee cost 4.8% vs 5.3% (-50); other expenses 11.1% vs 12.3% (-120); other operating income 5.2% vs 5.4% (-20); operating EBITDA 9.1% vs 12.6% (-350); depreciation 3.7% vs 4.2% (-50); operating EBIT 5.4% vs 8.4% (-300); interest 0.1% unchanged; non-operating income 2.2% vs 3.7% (-150); PBT 7.5% vs 12.0% (-450); PAT 5.7% vs 9.2% (-350).
Ratio table matching pages 6 and 10, with highlighted EBITDA and PAT rows, bps change column, red/green arrows and legend.
Total sales: domestic 588,535 units in Q2 FY'27 (+33.6% YoY, 84.5% of total) and 1,146,523 in H1 (+31.6%, 83.1%); exports 108,119 in Q2 (-2.1%, 15.5%) and 232,855 in H1 (+12.2%, 16.9%); total 696,654 (+26.5%) and 1,379,378 (+27.9%). Domestic segments in Q2: passenger cars (Mini, Compact, Mid-size) 281,308 (+31.9%, 47.8%), UVs 236,807 (+52.3%, 40.2%), vans 36,897 (+11.3%), LCV 10,441 (+23.5%), sales to other OEM 23,082 (-23.2%); H1 UVs 455,692 (+43.6%).
Two stacked tables with yellow two-tier headers (Q2 FY'27 and H1 FY'27, each with Number / YoY Growth % / share columns); vertical side labels 'Total Sales' and 'Domestic Sales'; bold total rows.
Closing slide with 'Thank You' centered.
Centered single line of text inside the gold frame lines.
이 슬라이드 및 기본 프레젠테이션 콘텐츠에 대한 일반적인 질문.
Per the deck, Q2 FY27 sales volume was 696,654 units (+26.5% YoY) and net sales were INR 506,155 million (+26.1%). Operating EBITDA fell 6.3% to INR 47,633 million and PAT fell 26.9% to INR 24,149 million, with the operating EBITDA margin at 9.4% versus 12.7% a year earlier.
The company cites adverse commodity prices in the context of the West Asia conflict, adverse foreign exchange movement and lower non-operating income from mark-to-market losses on invested surplus. Material cost rose to 79.9% of net sales from 75.7%. Improved realization, operating leverage and cost reduction partly offset these.
Indian companies use an April–March fiscal year, so FY27 runs from April 2026 to March 2027. Q2 FY27 covers July–September 2026 and H1 FY27 covers April–September 2026. The results were presented on 27 October 2026.
It is Maruti Suzuki India's standalone results presentation filed with BSE/NSE (the Indian stock exchanges). The exchange cover letter has been removed, leaving the 16-page presentation itself.
Suzuki Motor Gujarat (SMG), a wholly owned subsidiary, amalgamated with Maruti Suzuki India from 1 December 2025 with an appointed date of 1 April 2025, so financial statements for the relevant earlier periods were restated for comparison.
Utility vehicles grew fastest: 236,807 domestic UV units in Q2 FY27, up 52.3% YoY and 40.2% of domestic sales. Passenger cars rose 31.9% to 281,308 units, while exports dipped 2.1% to 108,119 units and sales to other OEMs fell 23.2%.
Yes. The page offers the original PDF and an editable PPTX converted from the PDF, so the tables and text can be adjusted in PowerPoint. Because it is a machine conversion, minor layout differences from the PDF are possible.
It is a compact model: a highlights table, a ratio table with basis-point changes and red/green arrows, and a negative-vs-positive margin factors slide, repeated for YoY, QoQ and half-year comparisons, followed by a segment volume table. The clean white, gold and green design is easy to adapt.
Official investor relations page with quarterly results and presentations

Create Your Own Slides
Turn your ideas into professional presentations in seconds with 2slides AI.
전문 디자인을 참조하고, 스타일을 선택하며, 완벽한 텍스트 렌더링으로 슬라이드를 생성하세요. Nano Banana로 구동—지금 프레젠테이션 만들기를 시작하세요.


