
Lam Research's June quarter 2026 financial results (July 29, 2026) — a 27-slide deck covering record quarterly revenue of $6.72 billion and non-GAAP EPS of $1.82, full fiscal 2026 revenue of $23.23 billion and EPS of $5.82, a revenue mix with memory at 46% of systems revenue and Taiwan at 27% by region, Customer Support Business Group revenue of $2.47 billion, the argument that AI is expanding Lam's served available market toward the high-30s percent of wafer fabrication equipment spending, expectations for CY26 WFE spending in the low $150 billion range, September quarter guidance of $8.10 billion, and a seven-page reconciliation appendix plus a glossary.
빠른 탐색
태그
슬라이드 공유
Lam Research's June quarter 2026 financial results (July 29, 2026) — a 27-slide deck covering record quarterly revenue of $6.72 billion and non-GAAP EPS of $1.82, full fiscal 2026 revenue of $23.23 billion and EPS of $5.82, a revenue mix with memory at 46% of systems revenue and Taiwan at 27% by region, Customer Support Business Group revenue of $2.47 billion, the argument that AI is expanding Lam's served available market toward the high-30s percent of wafer fabrication equipment spending, expectations for CY26 WFE spending in the low $150 billion range, September quarter guidance of $8.10 billion, and a seven-page reconciliation appendix plus a glossary.
레이아웃, 주요 콘텐츠 및 시각적 요소를 포함한 각 슬라이드 페이지의 상세 보기.
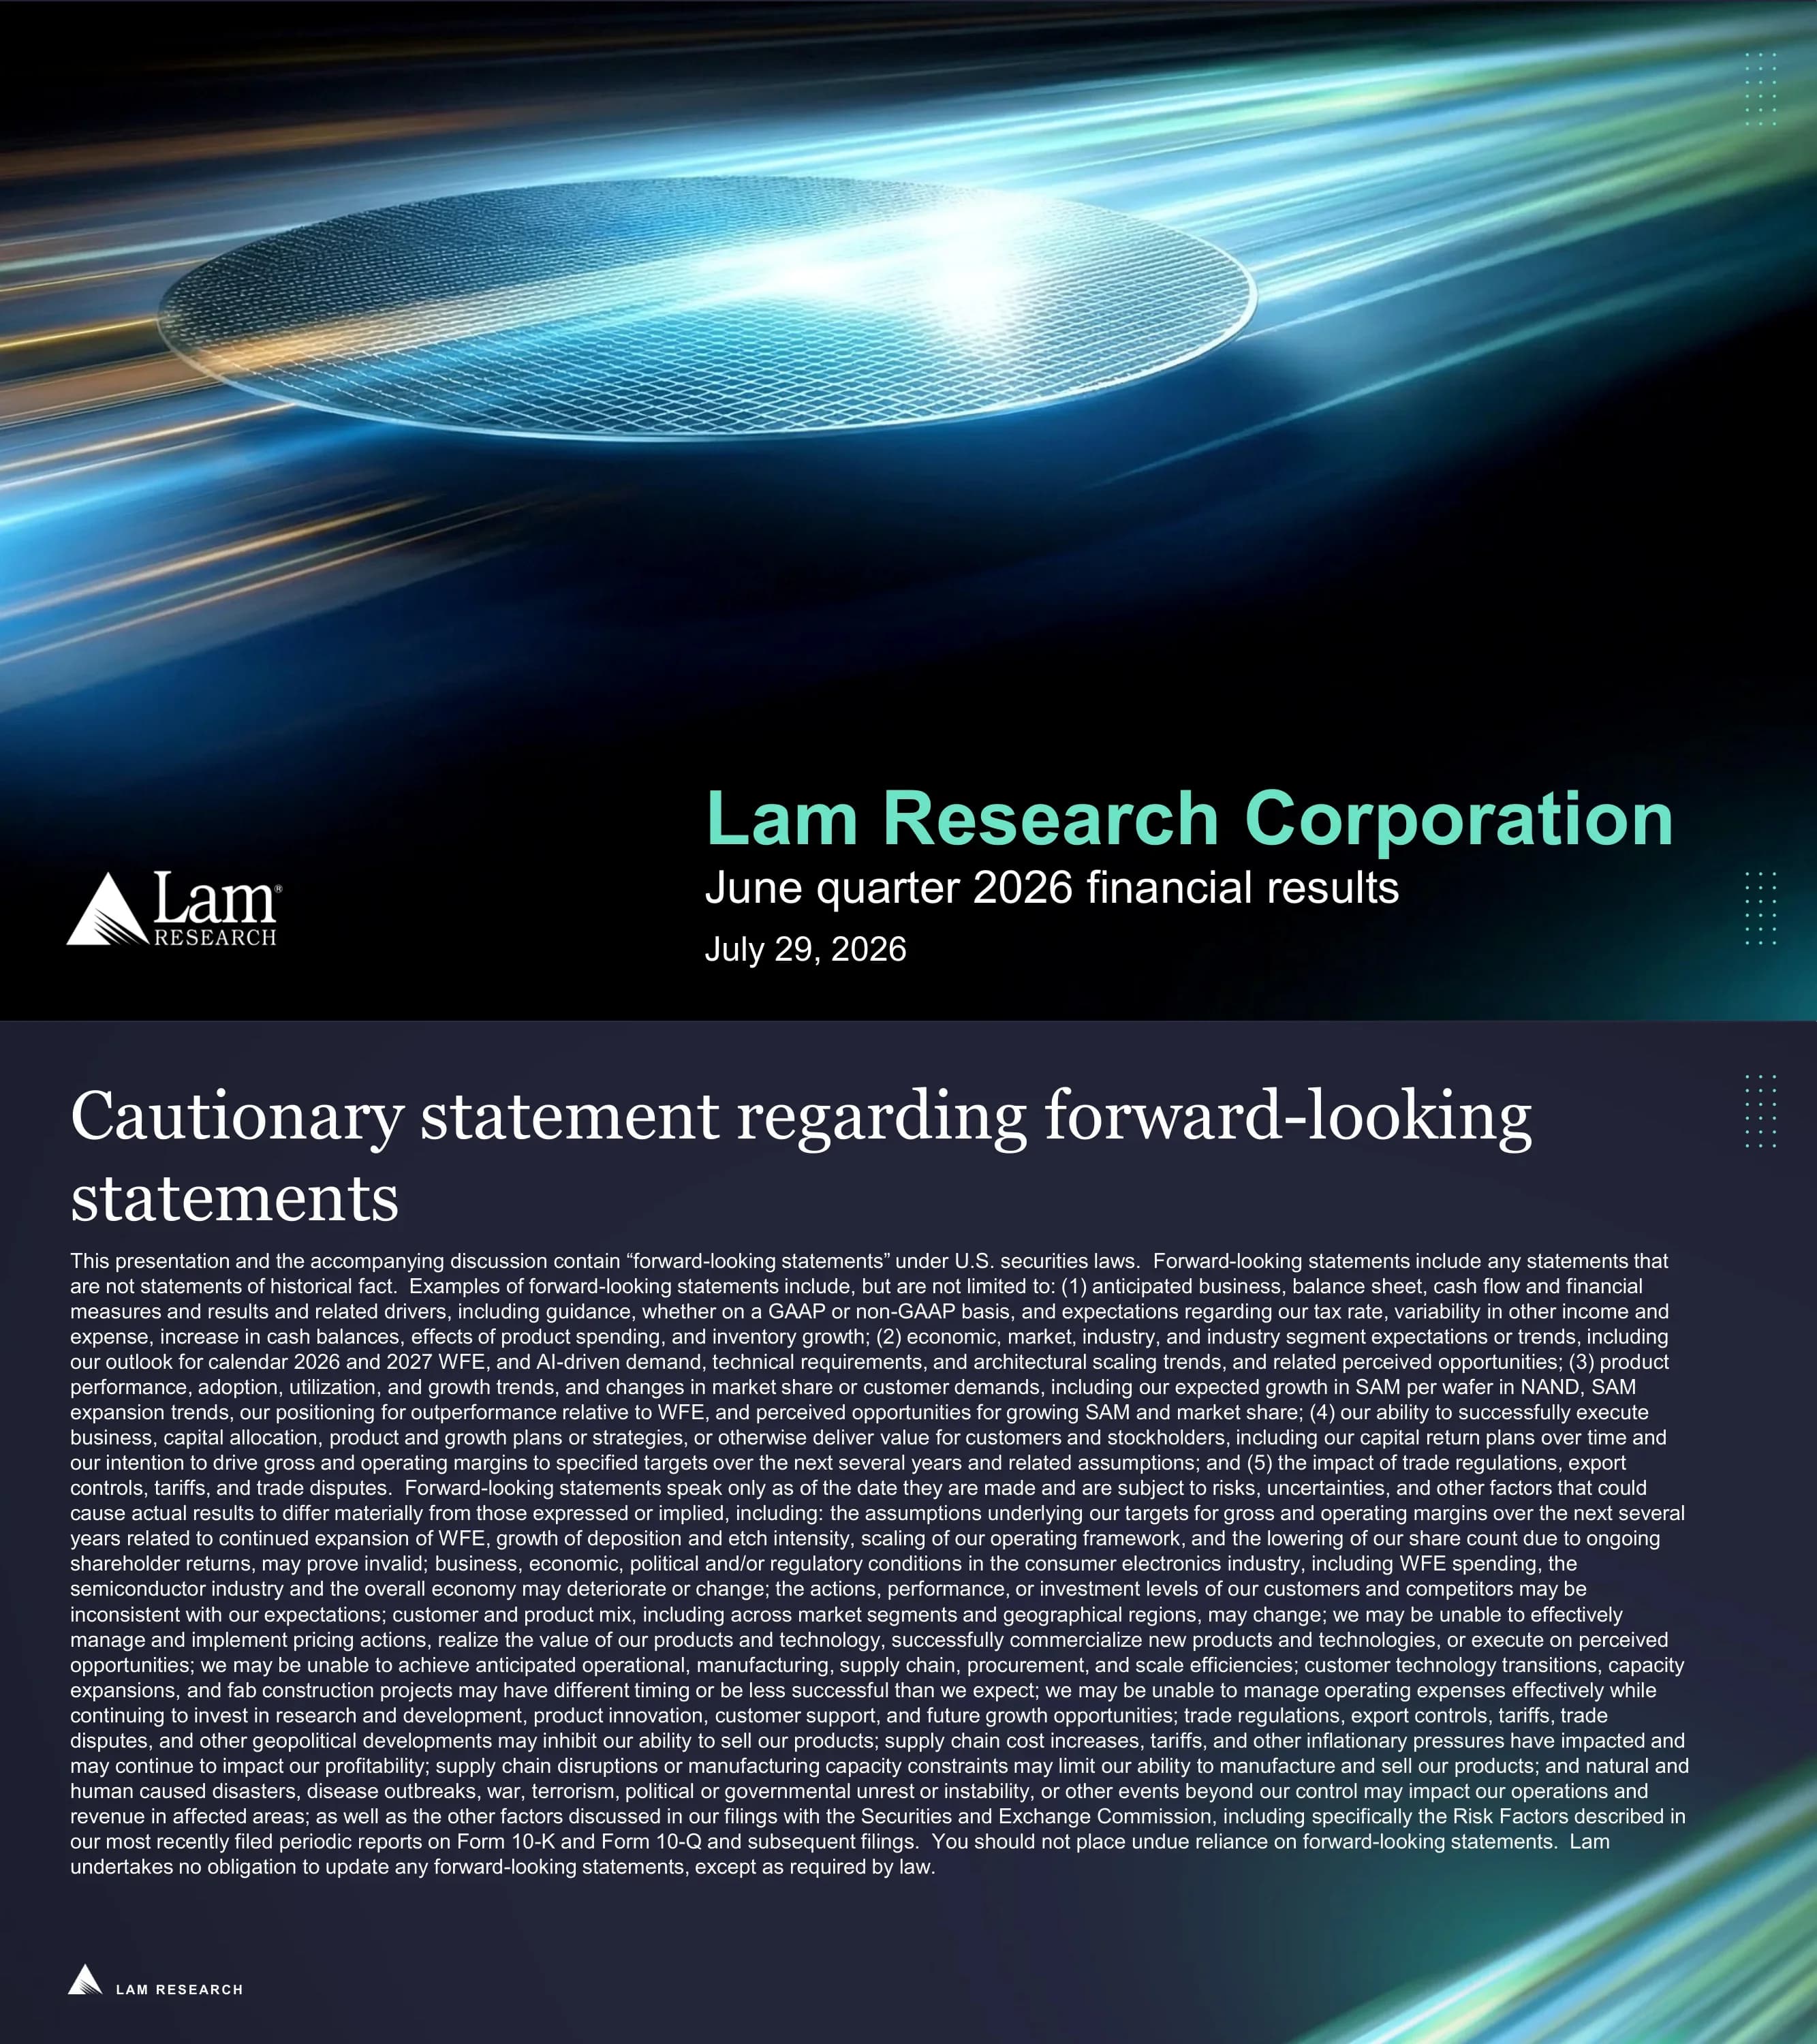
Cover slide for Lam Research's June quarter 2026 financial results, dated July 29, 2026.
Full-bleed rendering of a silicon wafer tilted in space, struck by streaks of blue and gold light against near-black. The Lam Research logo sits at the lower left; the company name in mint, the deck title in white and the date below it at the lower right.
Safe-harbour disclosure listing five categories of forward-looking statement — anticipated financial measures and guidance, economic and industry expectations including the outlook for calendar 2026 and 2027 WFE and AI-driven demand, product performance and SAM expansion, execution of capital allocation and margin targets, and the impact of trade regulations, export controls, tariffs and trade disputes — followed by the risk factors that could cause results to differ.
Dark navy slide with a serif heading wrapping to two lines and a single dense block of justified body text filling the rest. A dotted square motif sits in the upper right; light streaks bleed in at the lower right corner.
A global leader in wafer fabrication equipment and services since 1980. Fiscal year 2026 revenue of $23.2 billion and R&D of $2.4 billion on a GAAP basis, with approximately 22,400 employees as of June 28, 2026. Fourteen primary locations: Fremont CA, Livermore CA, Sherwood OR, Tualatin OR, Springfield OH, Eaton OH, Villach Austria, Hwaseong-si Korea, Osan Korea, Yongin Korea, Hsinchu City Taiwan, Taoyuan City Taiwan, Bengaluru India and Batu Kawan Malaysia. Awards listed: World's Best Employers and America's Best Employers for Company Culture from Forbes, World's Greenest Companies from Newsweek, World's Most Admired Companies from Fortune, World's Most Ethical Companies from Ethisphere and the Equality 100 Award from the Human Rights Campaign.
Left third carries the Lam logo large and a three-line mint positioning line. Right two-thirds holds three metric tiles across the top, a locations panel with a world map and green location dots beneath, and an awards panel at the bottom in two columns.
Section divider for the business review, presented by Tim Archer, President and Chief Executive Officer.
Dark slide with a band of blue and teal light streaks running diagonally across the upper half, and the two-line serif title with the presenter's name in mint italic at the lower left beside a vertical dotted rule.
Three panels. June quarter: record performance — record revenue, operating margin and EPS, with NAND revenue doubling sequentially. CY26: expecting continued outperformance — a September guide of $8.1 billion, up more than 20% sequentially, and a third consecutive year of WFE outperformance. CY27-plus: extraordinary set-up — customers have announced multi-year timelines for new fab projects, with investments in capacity and technology transitions. A full-width banner across the bottom reads 'Expecting CY26 WFE spending in the low $150B range'.
A gradient rule under the serif title, three outlined dark panels with mint serif headings and two short paragraphs each, and an outlined full-width banner carrying the WFE claim in bold below.
AI is driving more flash storage demand, more advanced DRAM and foundry architectures, and larger and more complex advanced packages. Lam's served available market is expanding, on a faster trajectory toward a high-30s SAM percentage of wafer fabrication equipment spending.
A photograph of a technician in cleanroom coveralls fills the right half, with green light traces running across the lower edge. A semi-transparent dark panel at the left holds a mint italic heading, two small-caps sub-headings and three plus-marked bullets.
Four opportunity areas with 3D renders. HAR structures — conductor etch installed base above 40,000 chambers, with Akara gaining momentum and its installed base growth trajectory expected to continue doubling in CY27. DRAM pitch scaling — leveraging foundry-logic capabilities into DRAM, with VECTOR hard mask and diffusion barrier tools critical for next-generation requirements. Surface engineering — surface treatment applications roughly double with gate-all-around, and Argos winning customers in 2nm and below foundry-logic while expanding into DRAM applications. Package scaling — a leader in TSV etch and electroplating, on track for more than 70% year-over-year advanced packaging revenue growth, and shipping tools for panel-level packaging across multiple geographies.
Four 3D structure renders in a row across the upper half, each above an outlined panel with a mint small-caps heading and two bullets.
Accelerating Dextro application development: Lam has doubled the preventive maintenance tasks that can be automated since the start of CY26; Equipment Intelligence and Dextro solutions are now expanding from NAND into DRAM; and the company describes itself as in the very early stages of a multi-year rollout opportunity across its installed base.
A photograph of a robotic arm with radiating green light fills the left third; the right two-thirds carries a three-line serif title over an outlined panel with a mint bold lead-in and three paragraphs.
Three closing claims for the business section: AI is driving unprecedented demand, greater technical requirements and architectural scaling; Lam has etch and deposition technology leadership, customer partnerships and increasing operational velocity; and the company is well positioned to outperform in CY26 and in the years ahead.
A blurred circuit-board photograph with light streaks fills the slide; three outlined semi-transparent panels sit across the lower two-thirds, each with a mint line icon above two or three lines of text. The title is set in mint serif italic at the upper left.
Section divider for the financial section, presented by Doug Bettinger, Executive Vice President and Chief Financial Officer.
The divider template from slide 4 repeated with a two-line title and a different presenter.
FY2026 revenue of $23.23 billion against FY2025 revenue of $18.44 billion. FY2026 earnings per share of $5.82 against FY2025 earnings per share of $4.13. A footnote states the data is presented on a non-GAAP basis with reconciliations at the end of the presentation, based on a diluted share count of approximately 1.261 billion shares for FY2026 and 1.290 billion for FY2025.
A photograph of a wafer in a chamber fills the left half; two stacked dark panels at the right each carry a mint small-caps label, an oversized mint serif figure and the prior-year comparison beneath.
QJun'26 revenue of $6.72 billion against QMar'26 revenue of $5.84 billion. QJun'26 earnings per share of $1.82 against QMar'26 earnings per share of $1.47. The same non-GAAP footnote applies, based on diluted share counts of approximately 1.256 billion for QJun'26 and 1.257 billion for QMar'26.
The fiscal year slide's layout repeated with a photograph of a SABRE 3D tool at the left and the two metric panels at the right.
Systems revenue by market segment: foundry 44%, NVM 23%, DRAM 23% — memory therefore 46% — and logic/other 10%. Revenue by region: Taiwan 27%, China 26%, Korea 20%, Japan 9%, US 9%, Southeast Asia 5% and Europe 4%. A footnote notes that systems revenue includes equipment and equipment upgrade sales from etch, deposition, clean and the Reliant product line.
Two pie charts side by side separated by a vertical rule, the left in greys and mint greens with the combined memory share called out in mint, the right in a warmer multi-colour palette with every slice labelled outside the circle.
Customer Support Business Group revenue of $2.47 billion in QJun'26, against $2.11 billion in QMar'26 and $1.73 billion in QJun'25.
A photograph of a technician loading a wafer fills the left half; a single dark panel at the right holds the small-caps label, one oversized mint figure and two prior-period comparison lines. The lower right of the slide is left empty.
QJun'26 against QMar'26: revenue $6,722 million versus $5,841 million; non-GAAP gross margin 52.0% versus 49.9%; non-GAAP operating expenses $916 million versus $866 million; non-GAAP operating income $2,581 million versus $2,047 million; non-GAAP operating income as a percentage of revenue 38.4% versus 35.0%; non-GAAP other income (expense) net $(19) million versus $(8) million; share repurchases $246 million versus $796 million; cash dividends $325 million versus $326 million; U.S. GAAP diluted EPS $1.81 versus $1.45; non-GAAP diluted EPS $1.82 versus $1.47; diluted share count 1,256 million versus 1,257 million.
An eleven-row table on the dark ground with row labels at the left and two period columns at the right — the QJun'26 column filled with a solid mint block and set in bold dark type, the QMar'26 column left plain.
QJun'26 against QMar'26: total consolidated gross cash balance $5,598 million versus $4,767 million; accounts receivable net $5,340 million versus $4,133 million; days sales outstanding 72 versus 64; inventories $4,276 million versus $4,000 million; inventory turns 3.0 versus 2.9; deferred revenue $2,434 million versus $2,221 million; equity compensation expense $104 million versus $97 million; amortisation expense $15 million versus $13 million; depreciation expense $105 million versus $103 million; capital expenditures $189 million versus $332 million; headcount approximately 22,400 versus approximately 20,600. A footnote explains the deferred revenue balance excludes shipments to customers in Japan, where title does not transfer until acceptance, with estimated future revenue from those shipments of approximately $490 million at June 28, 2026.
The same eleven-row table construction with the mint current-quarter block, plus a three-line footnote on the Japan deferred revenue treatment.
Revenue of $8.10 billion plus or minus $400 million; non-GAAP gross margin of 52.0% plus or minus 1%; non-GAAP operating margin of 39.5% plus or minus 1%; non-GAAP earnings per share of $2.15 plus or minus $0.15, based on a diluted share count of approximately 1.255 billion shares.
A photographic light-streak background with the guidance title set large in serif at the left, and four staggered dark bars at the right, each led by a circular gradient icon and carrying a mint figure over a white label.
Divider marking the transition to the question and answer session.
A full-bleed light-streak photograph with 'Q&A' set large in white serif at the centre. Nothing else.
Three months ended June 28, 2026 and March 29, 2026, in thousands: U.S. GAAP net income $2,277,282 and $1,825,460; pre-tax non-GAAP items including amortisation of acquired intangibles in cost of goods sold of $2,668 in both periods, elective deferred compensation related liability valuation changes of $15,379 and $(6,476) in cost of goods sold, $27,682 and $(11,656) in research and development and $18,454 and $(7,771) in selling, general and administrative, workforce optimisation charges across the three expense lines, amortisation of note discounts of $504 and $674, and a gain on EDC related asset of $(61,325) against a loss of $27,265; net income tax benefit on non-GAAP items of $(3,921) and $(1,898); non-GAAP net income $2,279,968 and $1,851,442; non-GAAP net income per diluted share $1.82 and $1.47; U.S. GAAP net income per diluted share $1.81 and $1.45; shares used 1,256,032 and 1,257,325 thousand.
A dark-ground reconciliation table with a centred three-line caption above, underlined period headers, indented adjustment rows and double-underlined totals.
Twelve months ended June 28, 2026 and June 29, 2025, in thousands: U.S. GAAP net income $7,265,396 and $5,358,217; pre-tax non-GAAP items including amortisation of acquired intangibles, EDC related liability valuation increases, workforce optimisation charges, an impairment of long-lived assets of $5,290 in the current year, amortisation of note discounts, and a gain on EDC related asset of $(73,776) and $(39,121); income tax benefit on non-GAAP items of $(8,525) and $(2,522); income tax benefit on the conclusion of certain tax matters of nil and $(24,740); income tax expense (benefit) from a change in tax law of $27,450 and $(20,778); non-GAAP net income $7,333,633 and $5,330,229; non-GAAP net income per diluted share $5.82 and $4.13; U.S. GAAP net income per diluted share $5.76 and $4.15; shares used 1,261,102 and 1,290,142 thousand; U.S. GAAP and non-GAAP revenue $23,232,690 and $18,435,591 thousand.
The same reconciliation table on a twelve-month basis, one row longer, with revenue appended as the final line.
Four columns — three months ended June 28, 2026 and March 29, 2026, and twelve months ended June 28, 2026 and June 29, 2025. U.S. GAAP gross margin $3,478,740, $2,910,527, $11,725,308 and $8,979,059 thousand, reconciling to non-GAAP gross margin of $3,497,336, $2,913,123, $11,762,297 and $8,999,516; GAAP gross margin as a percentage of revenue 51.7%, 49.8%, 50.5% and 48.7% against non-GAAP 52.0%, 49.9%, 50.6% and 48.8%. U.S. GAAP operating expenses $965,252 and $863,511 thousand reconciling to non-GAAP $916,420 and $866,166; U.S. GAAP operating income $2,513,488 and $2,047,016 against non-GAAP $2,580,916 and $2,046,957; GAAP operating income as a percent of revenue 37.4% and 35.0% against non-GAAP 38.4% and 35.0%.
A four-column reconciliation table combining three blocks — gross margin, operating expenses and operating income — with the quarterly columns only populated for the latter two.
Three months ended June 28, 2026 and March 29, 2026, in thousands: U.S. GAAP other income (expense) net of $41,654 and $(35,460); pre-tax non-GAAP items of amortisation of note discounts $504 and $674, and (gain) loss on EDC related asset $(61,325) and $27,265; non-GAAP other income (expense) net of $(19,167) and $(7,521).
A short four-row reconciliation occupying the upper right of an otherwise empty dark slide, with the same underlined header treatment.
Three months ended June 28, 2026 and calendar year to date June 28, 2026, in thousands: U.S. GAAP net cash provided by operating activities $1,457,228 and $2,598,648; U.S. GAAP cash used for capital expenditures and intangible assets $(188,801) and $(520,405); total free cash flow $1,268,427 and $2,078,243.
A three-row table in the upper right of an empty dark slide — the shortest table in the appendix.
Three months ended June 28, 2026 and March 29, 2026, in thousands: U.S. GAAP income before income taxes $2,555,142 and $2,011,556; U.S. GAAP income tax expense $277,860 and $186,096; U.S. GAAP income tax rate 10.9% and 9.3%; the same list of pre-tax non-GAAP items as the net income reconciliation; non-GAAP income before taxes $2,561,749 and $2,039,436; net income tax benefit on non-GAAP items $3,921 and $1,898; non-GAAP income tax expense $281,781 and $187,994; non-GAAP income tax rate 11.0% and 9.2%.
The longest appendix table, running the full height of the slide with the tax rate rows underlined at both top and bottom.
Revenue $8.10 billion plus or minus $400 million with no reconciling items, giving the same non-GAAP figure; gross margin as a percentage of revenue 52.0% plus or minus 1% with $2.7 million of reconciling items, giving 52.0% plus or minus 1%; operating income as a percentage of revenue 39.5% plus or minus 1% with $3.0 million of reconciling items, giving 39.5% plus or minus 1%; net income per diluted share $2.15 plus or minus $0.15 with $3.3 million of reconciling items, giving $2.15 plus or minus $0.15; diluted share count 1.255 billion on both bases. An explanatory paragraph notes the estimate does not incorporate future business combinations, acquisitions, divestitures, restructuring or financing arrangements, and three bullets itemise the reconciling items: $2.7 million of intangible amortisation in gross margin, $3.0 million in operating margin, and for EPS $3.0 million of intangible amortisation plus $0.5 million of debt discount amortisation less a $0.2 million tax benefit, totalling $3.3 million.
A three-group table — U.S. GAAP, Reconciling Items and Non-GAAP — across five rows, with an explanatory paragraph and three bullets filling the lower half.
Eighteen acronyms defined: AI artificial intelligence, ALD atomic layer deposition, CSBG Customer Support Business Group, CY calendar year, CFET complementary field-effect transistor, DRAM dynamic random-access memory, EPS earnings per share, FY fiscal year, GAA gate-all-around, HAR high aspect ratio, NAND short for 'NOT AND' flash memory, NVM non-volatile memory, R&D research and development, SAM served available market, SEA Southeast Asia, TSV through-silicon via, WFE wafer fabrication equipment, and YoY year over year.
A two-column table with every acronym cell filled solid mint and set in dark bold type, and the descriptions on the dark ground at the right, separated by hairline rules.
Closing slide carrying only the Lam Research logo.
A full-bleed light-streak photograph on near-black with the Lam Research logo and wordmark centred in white.
이 슬라이드 및 기본 프레젠테이션 콘텐츠에 대한 일반적인 질문.
The full 27-slide Lam Research June quarter 2026 results deck as both PDF and editable PowerPoint, plus a page-by-page preview. The PPTX keeps the tables and layout panels editable so the dark-theme styling can be reused.
Yes. The PDF is the file Lam Research published on its investor relations site for the June quarter 2026 results, dated July 29, 2026. The PowerPoint was converted from that PDF for editing convenience — check any layout you plan to reuse, since conversion is not always pixel-perfect.
June quarter revenue of $6.72 billion against $5.84 billion in the March quarter, with non-GAAP EPS of $1.82 against $1.47 and non-GAAP operating margin of 38.4% against 35.0%. For the full fiscal year 2026, revenue was $23.23 billion against $18.44 billion and EPS was $5.82 against $4.13. NAND revenue doubled sequentially.
September quarter guidance is $8.10 billion of revenue plus or minus $400 million — more than 20% sequential growth — with a 52.0% non-GAAP gross margin, a 39.5% non-GAAP operating margin and non-GAAP EPS of $2.15 plus or minus $0.15. Lam expects CY26 wafer fabrication equipment spending in the low $150 billion range and a third consecutive year of outperforming it.
By segment, memory was 46% of systems revenue — NVM 23% and DRAM 23% — with foundry at 44% and logic/other at 10%. By region, Taiwan was 27%, China 26%, Korea 20%, Japan and the US 9% each, Southeast Asia 5% and Europe 4%. The Customer Support Business Group contributed $2.47 billion, up from $1.73 billion a year earlier.
Lam argues AI is driving more flash storage demand, more advanced DRAM and foundry architectures, and larger advanced packages — each of which adds etch and deposition steps. That puts it on a faster trajectory toward a served available market in the high-30s percent of total WFE spending, with four named opportunity areas: high-aspect-ratio structures, DRAM pitch scaling, surface engineering and package scaling.
It is the best-designed earnings deck in this set. Worth copying: the industry argument comes before the numbers; every metric slide pairs one photograph with one or two figures and the prior period stated plainly beneath; guidance is four icon-led bars rather than a table; and the appendix ends with a glossary defining every acronym used.
Restraint on a dark ground. Near-black navy, a serif display face for titles, and one mint accent used for three things only — figures, headings, and the solid block that marks the current quarter in every table. The light-streak photography recurs on the cover, the dividers and the closing slide, so the deck opens and closes on the same image.
Original PDF published by Lam Research alongside the June quarter 2026 earnings release on July 29, 2026.

Create Your Own Slides
Turn your ideas into professional presentations in seconds with 2slides AI.
전문 디자인을 참조하고, 스타일을 선택하며, 완벽한 텍스트 렌더링으로 슬라이드를 생성하세요. Nano Banana로 구동—지금 프레젠테이션 만들기를 시작하세요.
Your AI Agent for slides. Save time, shine faster with intelligent presentation creation.




© 2026 2slides. All rights reserved.