
수록 모음: 투자자 발표자료 사례 · 일본 기업 IR 자료 예시
Kuraray Q3 FY2026 Earnings Presentation is the Japanese-language third-quarter results briefing (2026年度第3四半期 決算説明資料) that Kuraray Co., Ltd. released on TDnet, the Tokyo Stock Exchange timely-disclosure service, on 11 November 2026. Kuraray's fiscal year is the calendar year, so the deck covers January-September 2026 and walks through nine-month results, segment operating-profit bridges, the balance sheet and an unchanged full-year forecast.
이 프레젠테이션의 표지를 스타일 참고 자료로 사용해 내 콘텐츠로 슬라이드를 만듭니다. 아래에서 원하는 페이지를 골라 그 레이아웃을 참고로 쓸 수도 있습니다.
빠른 탐색
태그
슬라이드 공유
Kuraray Q3 FY2026 Earnings Presentation is the Japanese-language third-quarter results briefing (2026年度第3四半期 決算説明資料) that Kuraray Co., Ltd. released on TDnet, the Tokyo Stock Exchange timely-disclosure service, on 11 November 2026. Kuraray's fiscal year is the calendar year, so the deck covers January-September 2026 and walks through nine-month results, segment operating-profit bridges, the balance sheet and an unchanged full-year forecast.
레이아웃, 주요 콘텐츠 및 시각적 요소를 포함한 각 슬라이드 페이지의 상세 보기.
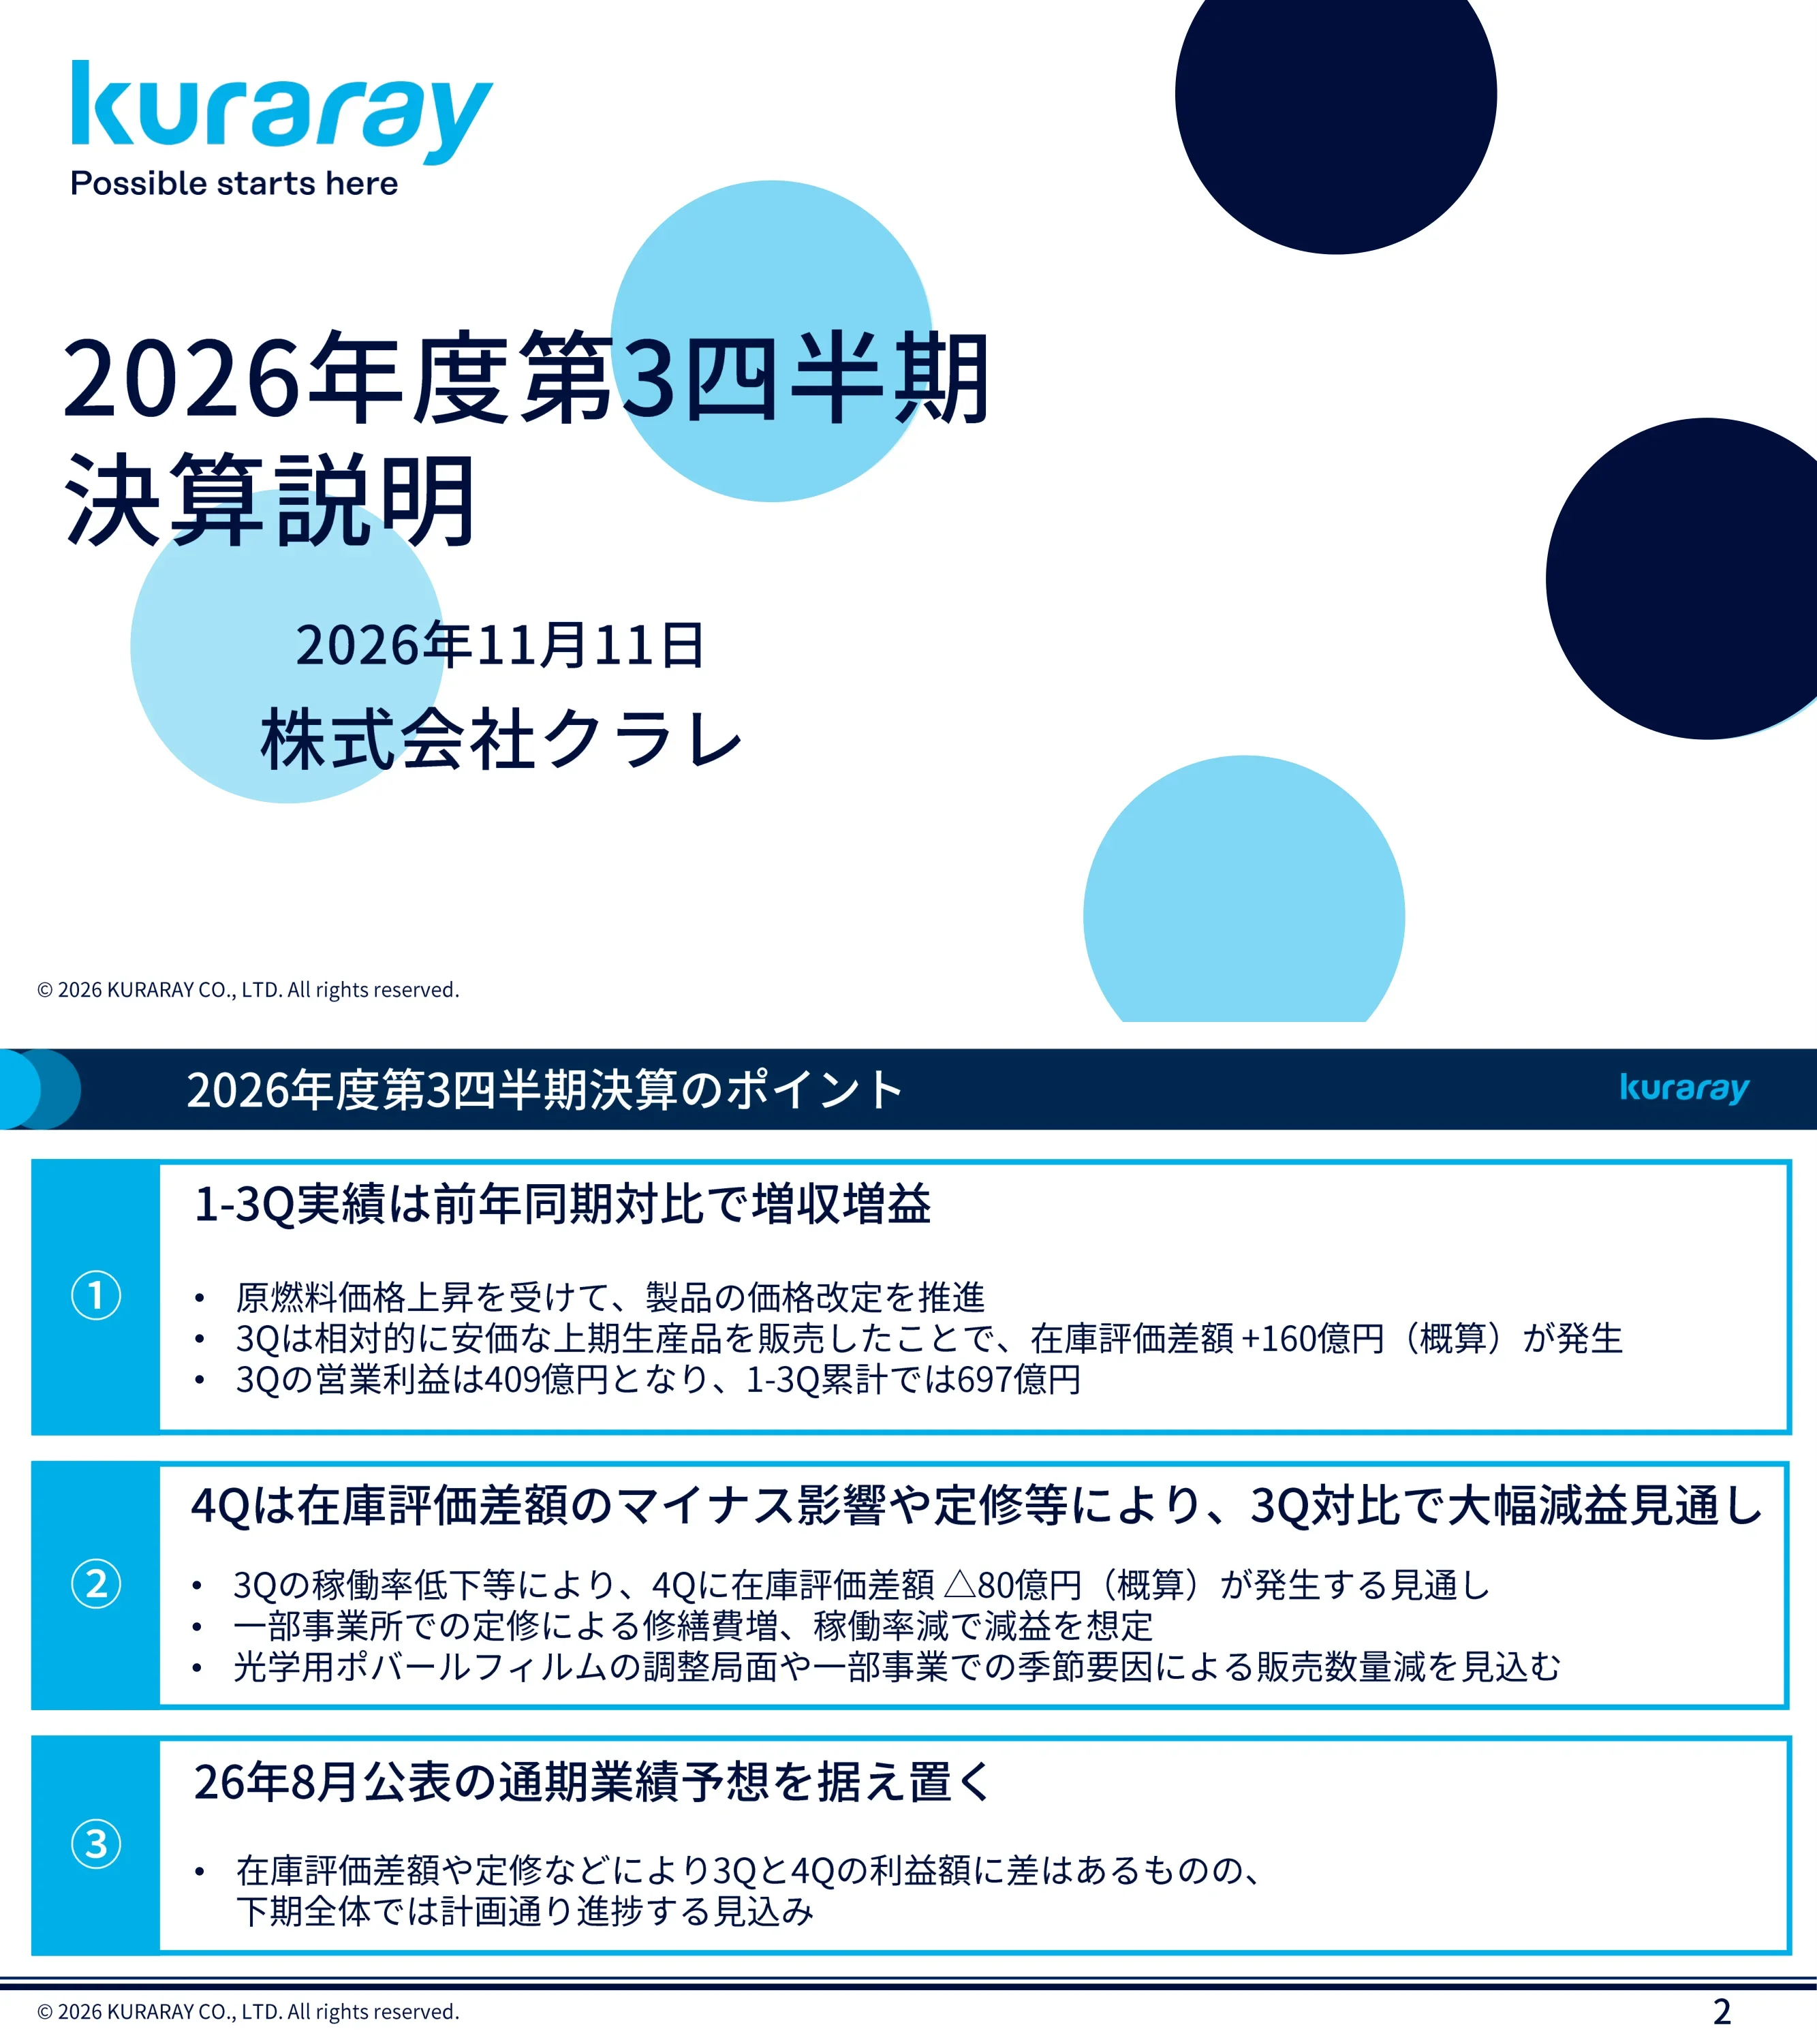
Cover slide titled 2026年度第3四半期 決算説明 (Fiscal 2026 Q3 Earnings Briefing), dated 11 November 2026 and issued by Kuraray Co., Ltd. (株式会社クラレ). The Kuraray logo carries the tagline Possible starts here.
White cover with the logo top-left, a large dark-navy title left of center, and the date and company name beneath. Overlapping light-blue and navy circles decorate the right and lower areas.
Three takeaways. (1) January-September results rose in sales and profit year on year, helped by price revisions after higher raw-material prices and an inventory-valuation gain of about +¥16.0 billion (+160 in ¥100 million) in Q3; Q3 operating profit was 409 and the nine-month total 697. (2) Q4 is expected to fall sharply from Q3 because of an inventory-valuation effect of about -80 and maintenance shutdowns, plus lower optical PVA film volume. (3) The full-year forecast announced in August 2026 is left unchanged.
Three stacked horizontal panels, each with a light-blue numbered tab (1-3) on the left, a bold headline and bullet points on the right.
In ¥100 million, net sales were 6,434 versus 5,934 (+499), operating profit 697 versus 464 (+234), ordinary profit 653 versus 401 (+253) and profit attributable to owners of parent 406 versus 228 (+178). Reference rates: yen/dollar 159 (148), yen/euro 184 (166), domestic naphtha 91 thousand yen/kl (69), US natural gas 3.1 dollars/MMBtu (3.4), European gas 51 euros/MWh (39).
Table with dark-navy row labels and yellow column headers; the 2026 1-3Q column is outlined in a thick navy frame. A smaller reference block of market assumptions sits below.
Operating profit rose from 464 to 697 (+234). Drivers: volume/operations +13, selling price and mix +112, raw materials and FX -45, other +155. Text notes price revisions after raw-material increases and a positive inventory-valuation effect. A table gives each segment's bridge, e.g. Vinyl Acetate 486 to 558 and Isoprene -22 to 34. A footnote explains that electronics-materials businesses moved from Other to Functional Materials and 2025 figures were restated.
Waterfall chart with a +234 arrow across the top of the bars, and a segment-by-driver table beneath it with a small footnote at the bottom.
Nine-month sales / operating profit in ¥100 million: Vinyl Acetate 3,226 / 558; Isoprene 687 / 34; Functional Materials 1,681 / 107; Fibers 466 / 85; Trading 551 / 54; Other 262 / 16; adjustments -441 / -157; total 6,434 / 697. The prior-year total was 5,934 / 464.
Wide table with sales and operating-profit sub-columns for 2026 1-3Q (framed), 2025 1-3Q and the change, with the segment list down the left side.
Segment operating profit rose from 486 to 558 (+73): volume -3, price/mix +23, raw materials/FX -22, other +74 (inventory valuation up, maintenance down). Optical PVA film sold well but high-performance interlayer films remained in a tough environment. Commentary covers PVA resin, optical PVA film, interlayer films, water-soluble PVA film and EVAL.
Waterfall chart with callout boxes on the left; a navy-labelled table of business conditions by product line on the right.
Operating profit improved from -22 to 34 (+56): volume +4, price/mix +14, raw materials/FX -17, other +54. Gains came from price revisions, a positive inventory-valuation effect and lower depreciation after last year's impairment loss. Isoprene chemicals sold less on weak Chinese construction demand; elastomers grew in the US; Genestar volumes rose in electrical/electronic and automotive uses.
Waterfall chart that crosses zero on the left with a callout; a two-row commentary table on the right.
Operating profit rose from 47 to 107 (+59): volume +20, price/mix +50, raw materials/FX -2, other -9. Medical sales were firm and activated-carbon price revisions plus methacrylic structural reform improved earnings. Commentary covers methacrylic, medical (new Miyoshi plant equipment started in Q2) and environmental solutions, including a decision to add US reactivated-carbon capacity targeted to start in Q1 2028.
Waterfall chart with two callouts on the left and a three-row business table on the right, with the segment-reclassification footnote.
Operating profit rose from 13 to 85 (+73): volume -5, price/mix +24, raw materials/FX -5, other +59. The Kuraray price revision and inventory-valuation gain helped, along with strong Vectran sales. Kuraclino demand recovered in footwear; Kuralon volume was weak on soft building-materials demand.
Waterfall chart on the left with a callout and a compact two-row commentary table on the right.
At end-September 2026 (¥100 million): current assets 5,908 (5,784 at end-December 2025, +124), fixed assets 7,396 (7,251, +145), total assets 13,304 (13,035, +269). Period-end rates: yen/dollar 157 for both dates; yen/euro 178 versus 184.
Three-row table with the current column framed in navy, and a small period-end FX table below.
At end-September 2026 (¥100 million): current liabilities 2,157 (-126), fixed liabilities 3,485 (+283), total liabilities 5,641 (+158), total net assets 7,663 (+111), liabilities and net assets 13,304 (+269). Equity ratio 56.6% versus 57.0% (-0.4 points).
Five-row table with the equity ratio shown beneath the framed block, plus the period-end FX table at the bottom.
The forecast is unchanged from 7 August 2026: net sales 8,800 (FY2025 actual 8,084, +716), operating profit 700 (589, +111), ordinary profit 640 (515, +125), net profit attributable to owners 400 (75, +325), all in ¥100 million. Assumptions: yen/dollar 158, yen/euro 182, naphtha 93 thousand yen/kl, US gas 3.1, European gas 62.
Table comparing the 11 November forecast (framed), 2025 actual with change, and the 7 August forecast with change (all 0) on the right; assumptions listed below.
Operating profit falls from 409 in Q3 to a forecast 3 in Q4 (-406): inventory valuation -240, maintenance repair costs -20, maintenance operating-rate effect -70, other -76 (lower optical PVA film volume, seasonal factors in some businesses, higher company-wide costs). A note points to page 14 for the breakdown.
Waterfall chart starting from a tall blue bar and stepping down through four gray bars to a near-zero Q4 bar, with a -406 arrow above.
Rough estimates of operating-profit impact (¥100 million; plus = profit, triangle = loss). Q3 total +195: inventory valuation +160, maintenance operating-rate effect +35. Q4 forecast total -135: inventory valuation -80, maintenance repair cost -20, operating-rate effect -35. Q3/Q4 difference -330. Vinyl Acetate goes from +125 to -80, Fibers from +35 to -30.
Matrix of segments (Vinyl Acetate, Isoprene, Functional Materials, Fibers, Trading/Other/adjustments, total) against Q3, Q4 forecast and difference columns, each split into three effect types and a subtotal.
Full-year forecast by segment (sales / operating profit, ¥100 million): Vinyl Acetate 4,310 / 630; Isoprene 960 / 15; Functional Materials 2,340 / 135; Fibers 660 / 60; Trading 740 / 70; Other 400 / 20; adjustments -610 / -230; total 8,800 / 700. Versus August, the segment profit forecasts changed within the total: Isoprene 25 to 15, Fibers 55 to 60, Other 15 to 20.
Table with the new forecast framed, then 2025 actual and change, then a separate block with the August forecast and change.
Quarterly sales by segment for 2025 and 2026 (¥100 million). 2026 total sales were 2,009 in Q1, 2,301 in Q2 and 2,123 in Q3, with a Q4 forecast of 2,366 and a full-year forecast of 8,800. For 2025 the quarters were 1,948, 2,052, 1,935 and 2,150, totaling 8,084.
Wide table with 2025 (Q1-Q4, full year) on the left and 2026 (Q1-Q3, Q4 forecast, full-year forecast) on the right; segments as rows with a total row.
Quarterly operating profit (¥100 million). 2026 totals: Q1 149, Q2 140, Q3 409, Q4 forecast 3, full-year forecast 700. 2025: 187, 76, 201, 125, total 589. Vinyl Acetate peaked at 305 in Q3 2026 with a Q4 forecast of 72; Fibers is forecast at -25 in Q4.
Same table layout as the sales trend page, with segments as rows and quarters as columns.
Rough operating-profit impact of maintenance cost, operating shutdowns and inventory valuation in 2025 (¥100 million). First half total -115 (maintenance -45, shutdowns -40, inventory -30); second half +45; full year -70. Vinyl Acetate was -25 for the year, Isoprene -25, Functional Materials -20 and Fibers 0.
Matrix by segment with first-half, second-half and full-year blocks, each split into three effects and a subtotal.
Same modeling format for 2026. First half total -80 (maintenance -60, shutdowns -5, inventory -15). Second-half forecast +60 (maintenance -20, inventory +80). Full-year forecast -20, with Vinyl Acetate -25, Isoprene 0, Functional Materials -5 and Fibers +10.
Matrix of segments against first-half actual, second-half forecast and full-year forecast blocks, with three effect columns and a subtotal each.
Two scheduled events: 9 February 2027, full-year FY2026 results release together with the announcement of a new long-term vision; and 22 February 2027, a briefing session on the new long-term vision.
Two horizontal cards, each with a light-blue date block on the left and the event description in a white box on the right.
Closing slide with the Kuraray logo and tagline. Notes state that amounts are rounded to the nearest ¥100 million (fractions below 0.5 dropped, 0.5 and above rounded up), that forecasts and plans are based on current assumptions and actual results may differ, and that names in angle brackets are trademarks or registered trademarks of the Kuraray group.
Large centered logo and tagline on white, with three bulleted notes in a dotted-line-separated block at the bottom.
이 슬라이드 및 기본 프레젠테이션 콘텐츠에 대한 일반적인 질문.
It is the Japanese-language 2026年度第3四半期 決算説明資料 (Q3 FY2026 earnings briefing material) from Kuraray, released on TDnet, the Tokyo Stock Exchange timely-disclosure service, on 11 November 2026. Slides are in Japanese; this page summarizes them in English.
Kuraray's fiscal year is the calendar year, so the nine-month figures cover January to September 2026, with Q3 being July to September.
Net sales were 6,434 (¥100 million) versus 5,934, operating profit 697 versus 464, ordinary profit 653 versus 401 and profit attributable to owners of parent 406 versus 228.
The deck bridges Q3 operating profit of 409 to a Q4 forecast of 3, citing an inventory-valuation swing of -240, maintenance repair costs of -20, maintenance operating-rate effects of -70 and -76 from other items such as lower optical PVA film volume.
No. The deck keeps the forecast announced on 7 August 2026: sales 8,800, operating profit 700, ordinary profit 640 and net profit attributable to owners 400, in ¥100 million.
Vinyl Acetate, Isoprene, Functional Materials, Fibers, Trading and Other, with dedicated overview slides for the first four. Electronics-materials businesses were moved from Other to Functional Materials from 2026 and 2025 figures were restated.
It pairs framed-column tables with waterfall bridges, uses a consistent navy header, light-blue accent and yellow table headers, and puts detailed quarterly and modeling tables in a reference appendix.
No. It is a company disclosure, and the closing slide notes that forecasts rest on current assumptions and actual results may differ. This summary is for information only.

Create Your Own Slides
Turn your ideas into professional presentations in seconds with 2slides AI.
전문 디자인을 참조하고, 스타일을 선택하며, 완벽한 텍스트 렌더링으로 슬라이드를 생성하세요. Nano Banana로 구동—지금 프레젠테이션 만들기를 시작하세요.


