
수록 모음: 컨설팅 발표자료 예시
KPMG Venture Pulse Q3 2026: KPMG Private Enterprise's quarterly global analysis of venture capital funding (published October 14, 2026, data from PitchBook), shown here as a 99-page consulting report deck
이 프레젠테이션의 표지를 스타일 참고 자료로 사용해 내 콘텐츠로 슬라이드를 만듭니다. 아래에서 원하는 페이지를 골라 그 레이아웃을 참고로 쓸 수도 있습니다.
빠른 탐색
태그
슬라이드 공유
KPMG Venture Pulse Q3 2026: KPMG Private Enterprise's quarterly global analysis of venture capital funding (published October 14, 2026, data from PitchBook), shown here as a 99-page consulting report deck
레이아웃, 주요 콘텐츠 및 시각적 요소를 포함한 각 슬라이드 페이지의 상세 보기.
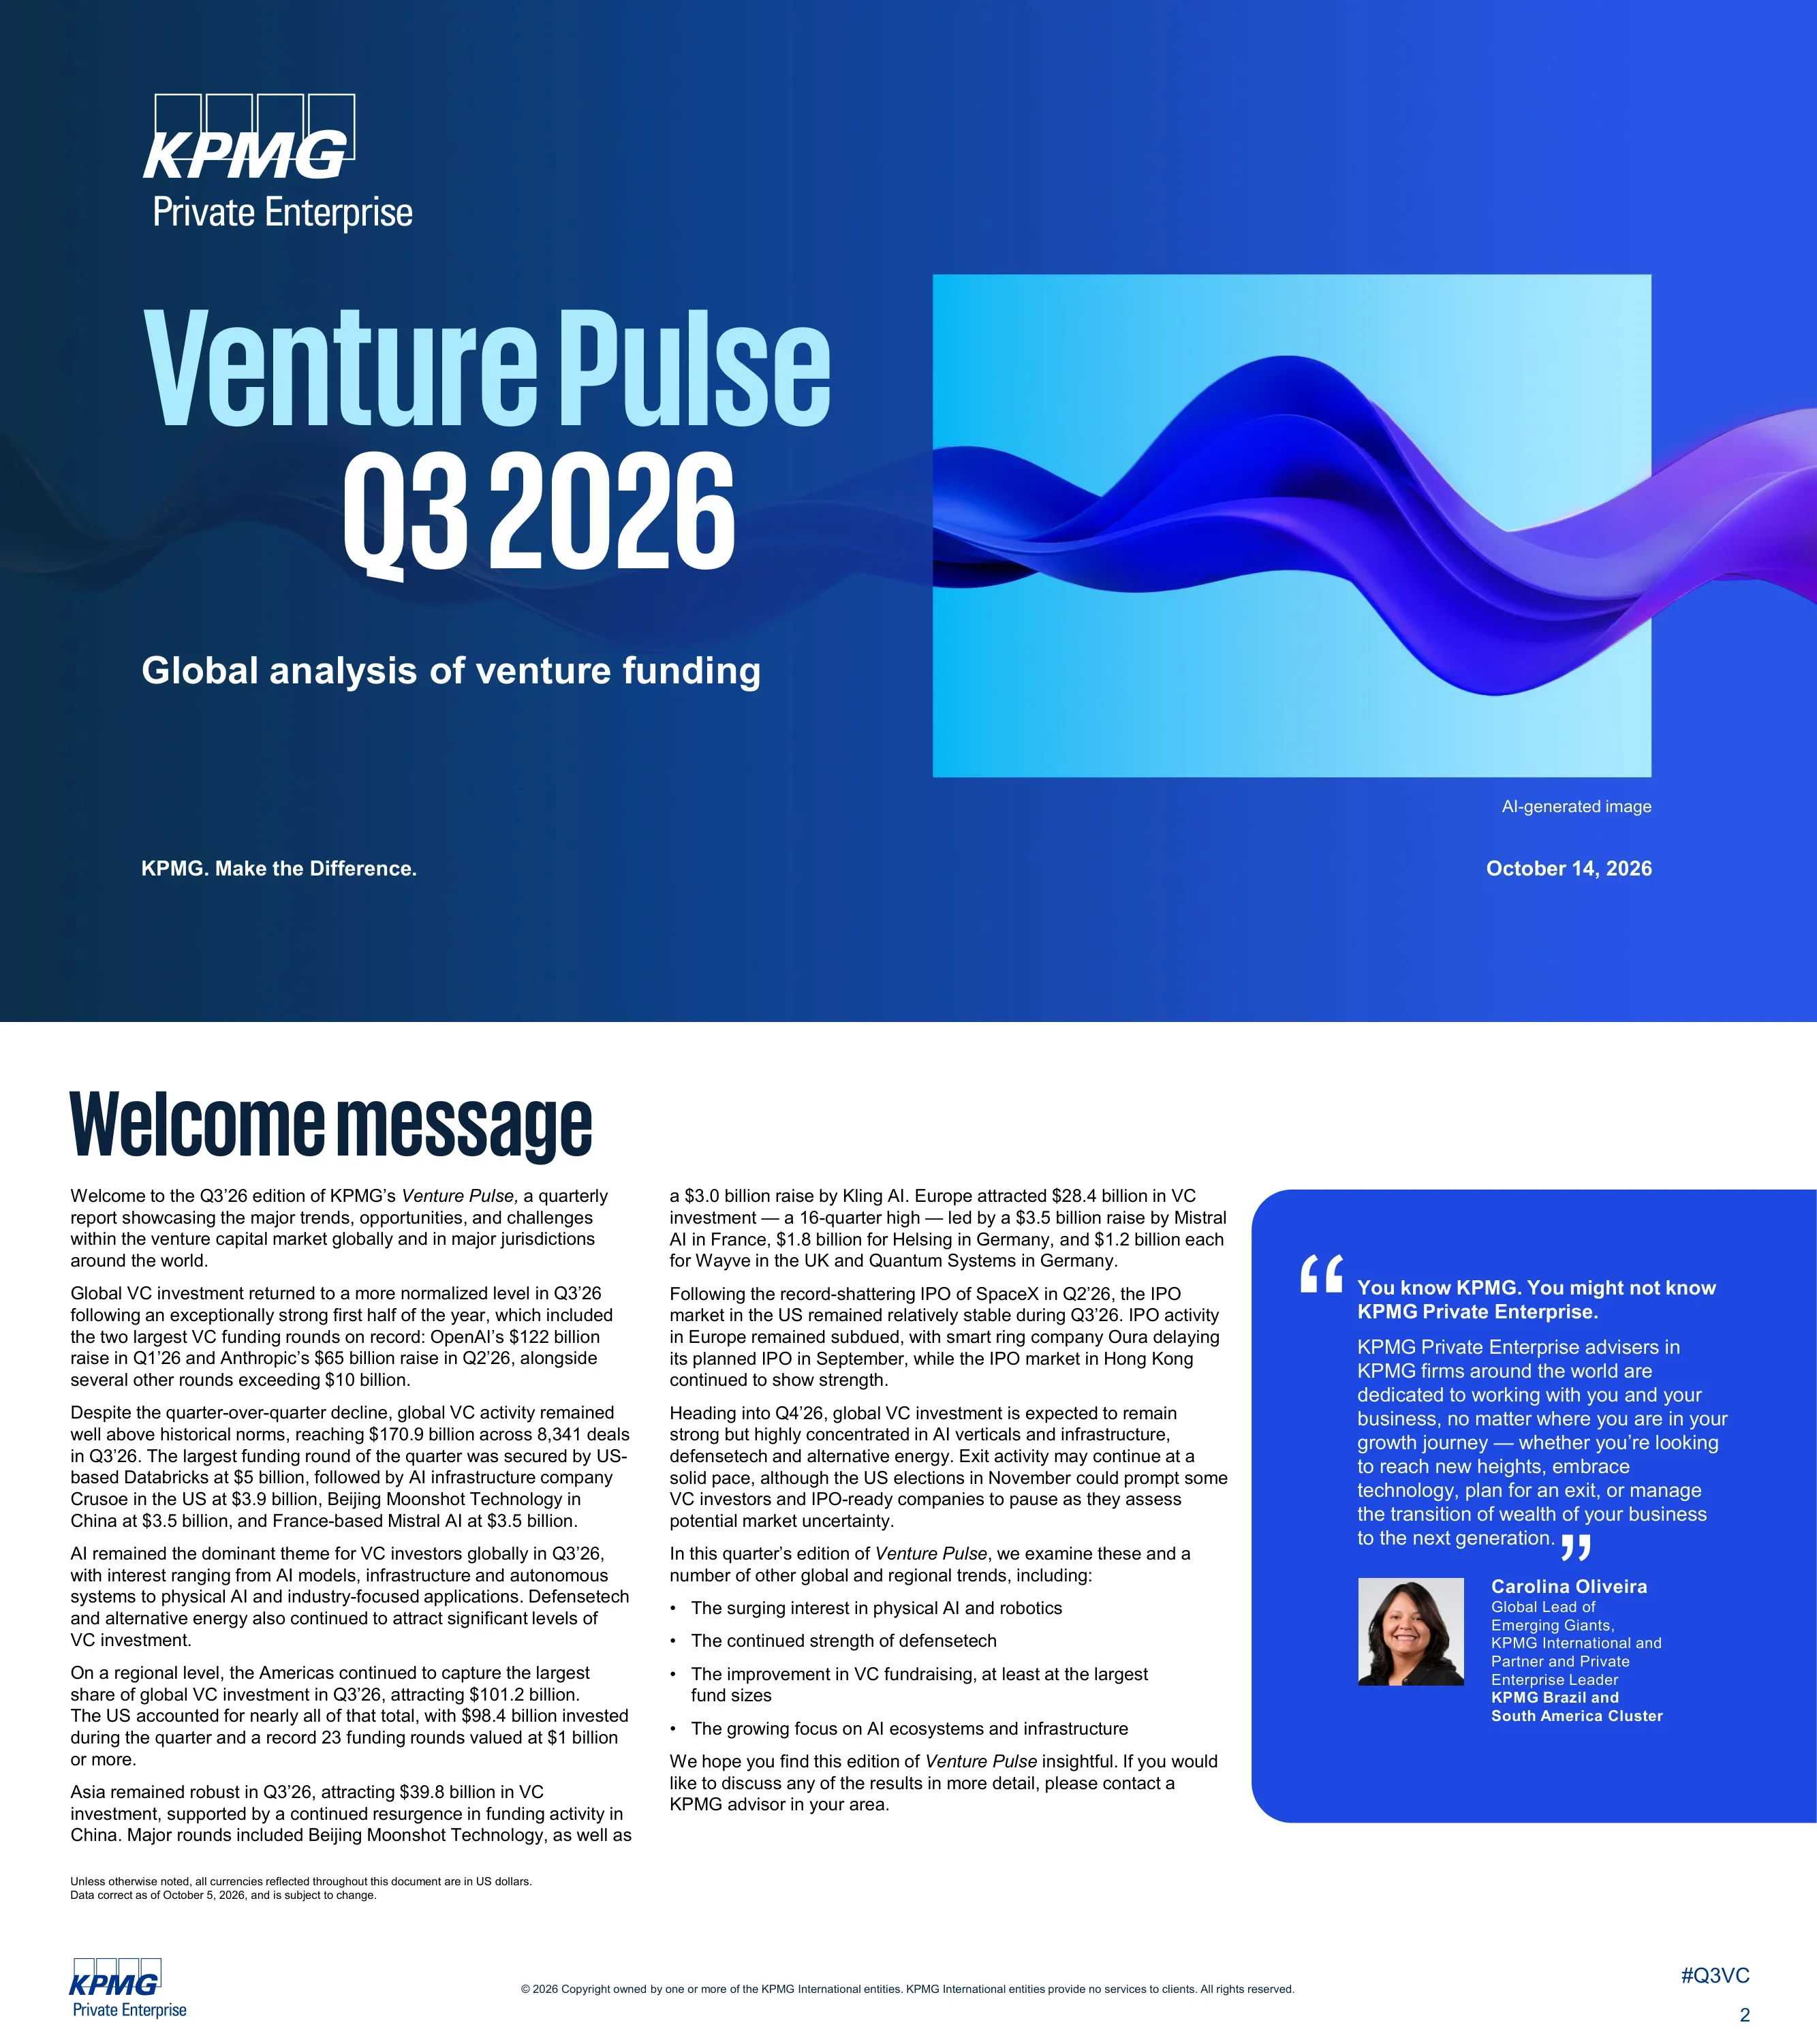
Cover of KPMG Private Enterprise's quarterly Venture Pulse report for Q3 2026, dated October 14, 2026.
Full-bleed blue cover with KPMG Private Enterprise logo top-left, large two-line title and subtitle on the left, abstract AI-generated wave image on the right, date bottom-right
Global VC normalized to $170.9B across 8,341 deals in Q3'26 after record OpenAI ($122B) and Anthropic ($65B) rounds in H1; Americas $101.2B, US $98.4B with a record 23 $1B+ rounds, Asia $39.8B, Europe $28.4B (16-quarter high).
Title, two text columns of the welcome letter, and a blue quote panel with headshot of the KPMG Private Enterprise lead
Six regional sections with key takeaways: Global (p4), US (p19), Americas (p34), Europe (p47), Asia (p74) and Africa (p93).
Title over six photo-topped columns numbered with page references (04, 19, 34, 47, 74, 93), each with a region heading and bulleted takeaways
Global section divider stating Q3'26 global VC of $170.9B across 8,341 deals.
Full-bleed photo section divider with a large condensed headline stating the region's headline number; region tab navigation (Global, US, Americas, Europe, Asia, Africa) at top right
Q3'26 had 35 global rounds of $1B+ (a record 23 in the US), led by Databricks ($5.0B), Crusoe ($3.9B) and Moonshot AI ($3.5B); Americas $101.2B/3,947 deals, Asia $39.8B/2,698, Europe $28.4B/1,497; AI capacity is the key bottleneck.
Action title, bold blue lead paragraph, then two text columns with blue subheadings; region tab navigation at top right
US IPO market solid after SpaceX's record Q2 IPO, Hong Kong and India active, Europe muted; 2026 global fundraising reached $157.9B across 1,204 funds (US $108.5B/699 funds, Europe $14.9B/111); Q4 focus on AI infrastructure, physical AI, defense and energy.
Action title, narrative text block plus an outlined 'Trends to watch for in Q4'26' callout box with a trend icon
Global quarterly VC investment fell from $317.0B (Q1'26) and $238.9B (Q2'26) to $170.9B in Q3'26, still above every quarter of 2022 to 2025.
Action title over a full-width combo chart: quarterly deal value bars (cyan, labeled) with deal-count line and stage lines, 2020 to Q3'26
2026 global median deal sizes: pre-seed/seed $1.6M, early VC $5.0M, later VC $6.9M, venture growth $17.0M; up rounds remain the large majority.
Action title, left line chart of median deal size by stage and right 100% stacked bars of up, flat and down rounds, 2020 to 2026
2026 global median deal size by series: D+ $102.3M, C $54.0M, B $28.0M, A $14.6M, seed $2.5M, pre-seed $0.4M, angel $0.2M.
Action title over one full-width multi-series line chart by series (pre-seed through D+), 2020 to 2026, with end-point value labels
2026 global median pre-money valuations: D+ $1,501.0M, C $442.0M, B $160.8M, A $51.0M, seed $12.5M, pre-seed $5.1M, angel $3.6M.
Action title over one full-width multi-series line chart by series (pre-seed through D+), 2020 to 2026, with end-point value labels
Global deal share by series: seed and pre-seed dominate deal counts while D+ rounds take a growing majority of capital invested in 2026.
Action title with two side-by-side 100% stacked column charts (deal count vs capital), 2020 to 2026, with right-side legends
Global sector mix 2020 to 2026 by deal count and capital; software holds the largest share of both, rising further in 2026 capital.
Action title with two side-by-side 100% stacked column charts of sector mix (deal count vs capital invested), 2020 to 2026, pink-dominant software band
Corporate VC participated in rounds worth $96.2B in Q3'26 (down from $259.1B in Q1); global first-time financings total $66.9B in 2026 so far vs $73.6B in 2025.
Action title with two side-by-side combo charts: quarterly corporate VC participation on the left and annual first-time financings on the right, bars plus count lines
Global unicorn rounds totaled $101.3B in Q3'26 vs $238.4B in Q1; global exit value was $185.2B in Q3'26 after a record $1,916.3B in Q2'26.
Action title with two side-by-side combo charts: quarterly corporate VC participation on the left and annual first-time financings on the right, bars plus count lines
Global exits by type 2020 to 2026: acquisitions lead by count, while public listings dominate 2026 exit value at roughly $2.5 trillion.
Action title with two side-by-side stacked column charts of exits by type (acquisition, buyout, public listing) by count and by value, 2020 to 2026
Global VC fundraising: $257.3B (2020), $390.0B (2021), $418.5B (2022), $278.8B (2023), $269.2B (2024), $150.4B (2025) and $157.9B in 2026 year to date.
Action title over an annual fundraising chart: capital raised bars with fund-count line, 2020 to 2026 year to date
Global fund count by size and first-time vs follow-on funds 2020 to 2026; first-time funds fall to their lowest share in 2026.
Action title with two side-by-side 100% stacked column charts (deal count vs capital), 2020 to 2026, with right-side legends
Top global Q3'26 rounds: Databricks $5B, Crusoe $3.9B, Moonshot AI $3.5B, Mistral AI $3.5B, The Boring Company $3.2B, Kling AI $3B, Cognition $2B, Thrive Holdings $2B, Firmus $2B, Helsing $1.8B.
Dark navy slide with a numbered map on the left (pins marking each company) and a rounded outlined list of the top financings on the right
US section divider: $98.4B across 3,626 deals in Q3'26.
Full-bleed photo section divider with a large condensed headline stating the region's headline number; region tab navigation (Global, US, Americas, Europe, Asia, Africa) at top right
AI accounted for 20 US rounds of $1B+ (Databricks $5B, Crusoe $3.9B, Cognition $2B, Thrive $2B, Hadrian $1.7B, Atoms $1.7B); market bifurcated, secondaries now a core liquidity option, defensetech rising, and public listings already exceed 2024 and 2025 totals.
Action title, blue lead paragraph and two text columns on the left two-thirds, with a solid blue quote panel and partner headshot on the right
US acquisition exit value hit an annual record; US fundraising reached $108.5B by Q3'26, above 2025, while first-time fundraising sits at a 10-year-plus low; Q4 focus on AI bottlenecks and physical AI.
Action title, narrative text and an outlined 'Trends to watch for in Q4'26' callout on the left, blue partner quote panel with headshot on the right
US quarterly VC fell from $253.5B (Q1'26) and $163.9B (Q2'26) to $98.4B in Q3'26; quote from Samuel Lush on the data-center land grab.
Action title, quarterly deal value columns with deal-count line on the left two-thirds and a solid blue partner quote panel with headshot on the right
2026 US median deal sizes: pre-seed/seed $1.7M, early VC $8.0M, later VC $8.5M, venture growth $16.8M; down rounds remain a small share.
Action title, left line chart of median deal size by stage and right 100% stacked bars of up, flat and down rounds, 2020 to 2026
2026 US median deal size by series: D+ $150.0M, C $77.0M, B $39.5M, A $17.4M, seed $3.0M, pre-seed and angel $0.2M.
Action title over one full-width multi-series line chart by series (pre-seed through D+), 2020 to 2026, with end-point value labels
2026 US median pre-money valuations: D+ $1,723.7M, C $500.0M, B $187.0M, A $60.3M, seed $18.3M, pre-seed $10.7M, angel $5.0M.
Action title over one full-width multi-series line chart by series (pre-seed through D+), 2020 to 2026, with end-point value labels
US deal share by series: pre-seed share of deal count holds while D+ rounds absorb the majority of 2026 capital.
Action title with two side-by-side 100% stacked column charts (deal count vs capital), 2020 to 2026, with right-side legends
US sector mix 2020 to 2026: software's share of capital invested climbs further in 2026 as AI spending broadens.
Action title with two side-by-side 100% stacked column charts of sector mix (deal count vs capital invested), 2020 to 2026, pink-dominant software band
US corporate VC participation fell to $48.1B in Q3'26 from $221.9B in Q1; US first-time financings total $34.3B in 2026 so far vs $40.1B in 2025.
Action title with two side-by-side combo charts: quarterly corporate VC participation on the left and annual first-time financings on the right, bars plus count lines
US exit value was $343.9B in Q1'26, a record $1,834.4B in Q2'26 (SpaceX) and $113.0B in Q3'26.
Action title over a single full-width combo chart of quarterly values (cyan bars) and counts (navy line), 2020 to Q3'26
US exits by type 2020 to 2026: acquisitions lead by count while public listings account for most 2026 exit value (above $2 trillion).
Action title with two side-by-side stacked column charts of exits by type (acquisition, buyout, public listing) by count and by value, 2020 to 2026
US VC fundraising: $96.7B (2020), $170.4B (2021), $224.8B (2022), $111.2B (2023), $117.3B (2024), $78.3B (2025) and $108.5B in 2026 year to date.
Action title over an annual fundraising chart: capital raised bars with fund-count line, 2020 to 2026 year to date
US fundraising by fund size (count and dollars): $1B+ funds take roughly two-thirds of 2026 capital.
Action title with two side-by-side 100% stacked column charts (deal count vs capital), 2020 to 2026, with right-side legends
US first-time vs follow-on funds by count and dollars; first-time managers' share falls to a multi-year low in 2026.
Action title with two side-by-side 100% stacked column charts (deal count vs capital), 2020 to 2026, with right-side legends
Americas section divider: $101.2B across 3,947 deals in Q3'26.
Full-bleed photo section divider with a large condensed headline stating the region's headline number; region tab navigation (Global, US, Americas, Europe, Asia, Africa) at top right
US $98.4B (of which $1B+ deals $37.8B); Canada $866.3M across 155 deals, its lowest since Q3'18; Mexico rose from $441M to $693M and Brazil from $390M to $609M; Kapital's $125M led Mexican fintech.
Action title, bold blue lead paragraph, then two text columns with blue subheadings; region tab navigation at top right
Canada Investment Summit announced the $50B Maple Fund and Canada's largest-ever VC fund (Radical Ventures, $1B+); Latin American fintech is concentrated in neobanks.
Action title, narrative text block plus an outlined 'Trends to watch for in Q4'26' callout box with a trend icon
Americas quarterly VC: $257.0B (Q1'26), $166.7B (Q2'26), $101.2B (Q3'26).
Action title over a full-width combo chart: quarterly deal value bars (cyan, labeled) with deal-count line and stage lines, 2020 to Q3'26
2026 Americas median deal sizes: pre-seed/seed $1.8M, early VC $6.7M, later VC $8.0M, venture growth $17.0M.
Action title, left line chart of median deal size by stage and right 100% stacked bars of up, flat and down rounds, 2020 to 2026
2026 Americas median deal size by series: D+ $150.0M, C $75.9M, B $38.4M, A $17.0M, seed $3.0M, pre-seed and angel $0.2M.
Action title over one full-width multi-series line chart by series (pre-seed through D+), 2020 to 2026, with end-point value labels
2026 Americas median pre-money valuations: D+ $1,662.0M, C $500.0M, B $185.0M, A $61.0M, seed $18.1M, pre-seed $10.5M, angel $4.4M.
Action title over one full-width multi-series line chart by series (pre-seed through D+), 2020 to 2026, with end-point value labels
Americas deal share by series: D+ rounds take a larger share of 2026 capital than in any year since 2020.
Action title with two side-by-side 100% stacked column charts (deal count vs capital), 2020 to 2026, with right-side legends
Americas sector mix 2020 to 2026, with software's share of capital rising in 2026.
Action title with two side-by-side 100% stacked column charts of sector mix (deal count vs capital invested), 2020 to 2026, pink-dominant software band
Canada's quarterly VC fell to $0.9B in Q3'26 (from $1.6B in Q2); Ryan Forster expects 2027 to benefit from Investment Summit funds.
Action title, quarterly deal value columns with deal-count line on the left two-thirds and a solid blue partner quote panel with headshot on the right
Mexico VC rose to $692.7M in Q3'26 from $440.8M in Q2; Guillermo Goñi notes manufacturing shifting to data-center components.
Action title, quarterly deal value columns with deal-count line on the left two-thirds and a solid blue partner quote panel with headshot on the right
Brazil VC rose to $609.4M in Q3'26 from $390.3M; Carolina Oliveira highlights B2B, legaltech, HR tech and embedded AI.
Action title, quarterly deal value columns with deal-count line on the left two-thirds and a solid blue partner quote panel with headshot on the right
Top Americas Q3'26 rounds: Databricks $5B, Crusoe $3.9B, The Boring Company $3.2B, Cognition $2B, Thrive Holdings $2B, Hadrian $1.7B, Atoms $1.7B, Fireworks AI $1.5B, Superhuman $1.3B.
Dark navy slide with a numbered map on the left (pins marking each company) and a rounded outlined list of the top financings on the right
Europe section divider: $28.4B across 1,497 deals in Q3'26.
Full-bleed photo section divider with a large condensed headline stating the region's headline number; region tab navigation (Global, US, Americas, Europe, Asia, Africa) at top right
Europe reached a 16-quarter high of $28.4B with six $1B+ deals (Mistral AI $3.5B, Helsing $1.8B, Quantum Systems $1.2B, Wayve $1.2B, Domyn $1.1B, Cyera $1B); Germany $5.3B, a fourth straight rise; UK softened to $6.8B.
Action title, bold blue lead paragraph, then two text columns with blue subheadings; region tab navigation at top right
Austria cautious; Nordics solid with Neko Health $700M and Lovable $400M and EQT cleared for the EU's €5B Scale-up Europe Fund; Ireland soft; Oura postponed its US IPO, keeping exits muted.
Action title, bold blue lead paragraph, then two text columns with blue subheadings; region tab navigation at top right
Q4 outlook: AI, defensetech, alternative energy, deeptech and spacetech, supported by the UK Sovereign AI Fund and EU Scale-up Europe Fund.
Action title, narrative text block plus an outlined 'Trends to watch for in Q4'26' callout box with a trend icon
Europe quarterly VC rose for a fourth straight quarter: $23.2B (Q4'25), $24.9B, $26.5B and $28.4B in Q3'26.
Action title over a full-width combo chart: quarterly deal value bars (cyan, labeled) with deal-count line and stage lines, 2020 to Q3'26
2026 Europe median deal sizes: pre-seed/seed $2.0M, early VC $2.3M, later VC $4.7M, venture growth $14.7M; down rounds a small minority.
Action title, left line chart of median deal size by stage and right 100% stacked bars of up, flat and down rounds, 2020 to 2026
2026 Europe median deal size by series: D+ $150.0M, C $70.9M, B $35.8M, A $15.2M, seed $2.5M, angel $0.4M.
Action title over one full-width multi-series line chart by series (pre-seed through D+), 2020 to 2026, with end-point value labels
2026 Europe median pre-money valuations: D+ $2,500.0M (n=28), C $397.5M, B $130.0M, A $43.4M, seed $6.4M, pre-seed $4.0M, angel $3.6M.
Action title over one full-width multi-series line chart by series (pre-seed through D+), 2020 to 2026, with end-point value labels
Europe deal share by series: seed dominates deal counts while D+ rounds take the largest share of 2026 capital.
Action title with two side-by-side 100% stacked column charts (deal count vs capital), 2020 to 2026, with right-side legends
Europe sector mix 2020 to 2026, with software near a record share of capital invested.
Action title with two side-by-side 100% stacked column charts of sector mix (deal count vs capital invested), 2020 to 2026, pink-dominant software band
Europe corporate VC participation reached $18.5B in Q3'26, highest in the series; European first-time financings total $10.3B in 2026 so far.
Action title with two side-by-side combo charts: quarterly corporate VC participation on the left and annual first-time financings on the right, bars plus count lines
Europe exit value was $21.0B in Q3'26, versus $18.3B and $18.7B in Q1 and Q2'26.
Action title over a single full-width combo chart of quarterly values (cyan bars) and counts (navy line), 2020 to Q3'26
Europe exits by type 2020 to 2026: acquisitions dominate both count and value.
Action title with two side-by-side stacked column charts of exits by type (acquisition, buyout, public listing) by count and by value, 2020 to 2026
European VC fundraising: $33.0B (2020), $39.7B, $41.5B, $33.6B, $28.4B (2024), $15.5B (2025) and $14.9B in 2026 year to date.
Action title over an annual fundraising chart: capital raised bars with fund-count line, 2020 to 2026 year to date
Europe fund count by size and first-time vs follow-on funds 2020 to 2026; first-time share drops sharply in 2026.
Action title with two side-by-side 100% stacked column charts (deal count vs capital), 2020 to 2026, with right-side legends
UK quarterly VC eased to $6.8B in Q3'26 from $9.8B in Q1 and $8.5B in Q2'26.
Action title over a single full-width combo chart of quarterly values (cyan bars) and counts (navy line), 2020 to Q3'26
London VC was $4.5B in Q3'26 (Q1 $8.0B, Q2 $5.4B); Patrick Molyneux sees fewer, higher-quality, larger deals.
Action title, quarterly deal value columns with deal-count line on the left two-thirds and a solid blue partner quote panel with headshot on the right
Ireland VC fell to $46.4M in Q3'26 from $362.4M in Q2; Gavin Sheehan questions the depth of later-stage capital.
Action title, quarterly deal value columns with deal-count line on the left two-thirds and a solid blue partner quote panel with headshot on the right
Germany VC rose to $5.3B in Q3'26 (Q2 $3.8B); Florian Merkel notes deeptech and fusion becoming an institutional investment case.
Action title, quarterly deal value columns with deal-count line on the left two-thirds and a solid blue partner quote panel with headshot on the right
Berlin VC fell to $283.5M in Q3'26 from $2,292.9M in Q1 and $935.9M in Q2'26.
Action title over a single full-width combo chart of quarterly values (cyan bars) and counts (navy line), 2020 to Q3'26
Austria VC fell to $22.8M in Q3'26 from $296.5M in Q1; Leonardo Peikoff says SaaS without an AI story faces tough funding talks.
Action title, quarterly deal value columns with deal-count line on the left two-thirds and a solid blue partner quote panel with headshot on the right
Spain VC was $805.5M in Q3'26 after $1,334.6M in Q2'26.
Action title over a single full-width combo chart of quarterly values (cyan bars) and counts (navy line), 2020 to Q3'26
France VC jumped to $4.9B in Q3'26 from $2.4B in Q2, its highest since Q1'22.
Action title over a single full-width combo chart of quarterly values (cyan bars) and counts (navy line), 2020 to Q3'26
Paris VC hit $4.6B in Q3'26, the highest in the 2020 to 2026 series, driven by Mistral AI's $3.5B round.
Action title over a single full-width combo chart of quarterly values (cyan bars) and counts (navy line), 2020 to Q3'26
Nordics VC was $2.0B in Q3'26 after $4.8B in Q2; Jussi Paski points to Finnish listings reopening routes to public markets.
Action title, quarterly deal value columns with deal-count line on the left two-thirds and a solid blue partner quote panel with headshot on the right
Israel VC rose to $2.8B in Q3'26, its highest since 2022.
Action title over a single full-width combo chart of quarterly values (cyan bars) and counts (navy line), 2020 to Q3'26
Top Europe Q3'26 rounds: Mistral AI $3.5B, Helsing $1.8B, Wayve $1.2B, Quantum Systems $1.2B, Domyn $1.1B, Cyera $1B, Neko Health $700M, TEKEVER $580M, International Wealth Group $550M, Wonderful $550M.
Dark navy slide with a numbered map on the left (pins marking each company) and a rounded outlined list of the top financings on the right
Asia section divider: $39.8B across 2,698 deals in Q3'26.
Full-bleed photo section divider with a large condensed headline stating the region's headline number; region tab navigation (Global, US, Americas, Europe, Asia, Africa) at top right
Asia dipped from $44.6B to $39.8B; four $1B+ megadeals made up about a quarter (Moonshot AI $3.5B, Kling AI $3B, Firmus $2B); China resurging, India at a six-quarter low, Japan selective, Hong Kong IPOs strong.
Action title, blue lead paragraph and two text columns on the left two-thirds, with a solid blue quote panel and partner headshot on the right
China shifts to enterprise and physical AI, Japan corporates co-invest with VCs; Q4 outlook favors AI infrastructure and deeptech, with Moonshot AI's potential Hong Kong listing watched.
Action title, narrative text block plus an outlined 'Trends to watch for in Q4'26' callout box with a trend icon
Asia quarterly VC: $29.4B (Q4'25), $33.8B (Q1'26), $44.6B (Q2'26), $39.8B (Q3'26).
Action title over a full-width combo chart: quarterly deal value bars (cyan, labeled) with deal-count line and stage lines, 2020 to Q3'26
2026 Asia median deal sizes: pre-seed/seed $1.3M, early VC $7.7M, later VC $8.0M, venture growth $20.6M; down-round share edges up.
Action title, left line chart of median deal size by stage and right 100% stacked bars of up, flat and down rounds, 2020 to 2026
2026 Asia median deal size by series: D+ $43.0M, C $28.1M, B $14.7M, A $10.4M, seed $1.5M, pre-seed $0.4M, angel $0.3M.
Action title over one full-width multi-series line chart by series (pre-seed through D+), 2020 to 2026, with end-point value labels
2026 Asia median pre-money valuations: D+ $982.2M, C $289.6M, B $63.2M, A $24.7M, seed $4.8M, pre-seed $3.3M, angel $2.7M.
Action title over one full-width multi-series line chart by series (pre-seed through D+), 2020 to 2026, with end-point value labels
Asia deal share by series: later-stage rounds take a growing share of 2026 capital.
Action title with two side-by-side 100% stacked column charts (deal count vs capital), 2020 to 2026, with right-side legends
Asia sector mix 2020 to 2026, with IT hardware gaining share of capital on semiconductor investment.
Action title with two side-by-side 100% stacked column charts of sector mix (deal count vs capital invested), 2020 to 2026, pink-dominant software band
Asia corporate VC participation was $27.2B in Q3'26; Asian first-time financings total $19.3B in 2026 so far vs $17.6B in 2025.
Action title with two side-by-side combo charts: quarterly corporate VC participation on the left and annual first-time financings on the right, bars plus count lines
Asia exit value was $49.7B in Q3'26, after $56.2B and $59.7B in Q1 and Q2'26.
Action title over a single full-width combo chart of quarterly values (cyan bars) and counts (navy line), 2020 to Q3'26
Asia exits by type 2020 to 2026: acquisitions lead by count while public listings dominate exit value.
Action title with two side-by-side stacked column charts of exits by type (acquisition, buyout, public listing) by count and by value, 2020 to 2026
Asia VC fundraising: $123.5B (2020), $166.9B, $137.0B, $122.9B, $116.3B (2024), $51.6B (2025) and $32.1B in 2026 year to date.
Action title over an annual fundraising chart: capital raised bars with fund-count line, 2020 to 2026 year to date
Asia fund count by size and first-time vs follow-on funds 2020 to 2026.
Action title with two side-by-side 100% stacked column charts (deal count vs capital), 2020 to 2026, with right-side legends
India VC fell to $2.6B in Q3'26 from $3.8B in Q2, its lowest in six quarters.
Action title over a single full-width combo chart of quarterly values (cyan bars) and counts (navy line), 2020 to Q3'26
China VC was $27.2B in Q3'26 after $30.2B in Q2; Angela Chiu highlights robotics deployed in factories and logistics.
Action title, quarterly deal value columns with deal-count line on the left two-thirds and a solid blue partner quote panel with headshot on the right
Australia VC jumped to $2,839.5M in Q3'26 from $1,009.5M in Q2, the highest in the 2020 to 2026 series.
Action title over a single full-width combo chart of quarterly values (cyan bars) and counts (navy line), 2020 to Q3'26
Japan VC held at about $1.2B in Q3'26 ($1.3B in Q1 and Q2); Hiroshi Abe describes corporate-VC collaboration in deep tech.
Action title, quarterly deal value columns with deal-count line on the left two-thirds and a solid blue partner quote panel with headshot on the right
Top Asia-Pacific Q3'26 rounds: Moonshot AI $3.5B, Kling AI $3B, Firmus $2B, Ant International $1.2B, XPeng Robotics $900M, Cornerstone Robotics $700M, Sharpa $667.6M, Supabase $650M, Shengshu $500M, Tripo $445.2M.
Dark navy slide with a numbered map on the left (pins marking each company) and a rounded outlined list of the top financings on the right
Africa section divider: $494M across 131 deals in Q3'26.
Full-bleed photo section divider with a large condensed headline stating the region's headline number; region tab navigation (Global, US, Americas, Europe, Asia, Africa) at top right
African VC concentrated in fewer, larger deals, led by Moove's $250M Series C in fintech; capital depth is thin for pre-seed and seed; hubs are Nigeria, Egypt, Kenya and South Africa.
Action title, narrative text and an outlined 'Trends to watch for in Q4'26' callout on the left, blue partner quote panel with headshot on the right
Map of KPMG Emerging Giants network jurisdictions with contacts Carolina Oliveira and Lindsay Hull.
Action title and subtitle, world map with pins for every KPMG jurisdiction, and a blue 'Contact us' panel with two headshots
Description of KPMG Private Enterprise and its Emerging Giants network for startups.
Title with blue subheading and two paragraphs of body text on white
Lists KPMG contributors across China, Brazil, Germany, Ireland, Mexico, Japan, Finland, Austria, UK, Canada, US, India, Africa and KPMG International.
Title, 'Acknowledgements' subheading and a two-column bulleted list of contributors with names in blue
Explains that PitchBook supplies the data, regional totals do not sum to global, PE growth rounds are excluded, and defines stages, fundraising and exits.
Title with 'Methodology' subheading and dense two-column small-print definitions (fundraising, deals, stages, exits)
Contact enterprise@kpmg.com and kpmg.com/venturepulse, with legal disclaimers and a note that some images are AI-generated.
Dark navy back cover with KPMG Private Enterprise logo, contact email, website, social icons and legal disclaimer
이 슬라이드 및 기본 프레젠테이션 콘텐츠에 대한 일반적인 질문.
It analyzes global venture capital in Q3 2026: investment, deal counts, median deal sizes and valuations, sector mix, corporate VC, unicorn rounds, exits and fundraising, with sections for the Global market, US, Americas, Europe, Asia and Africa plus country pages such as Canada, Mexico, Brazil, UK, Germany, France, Israel, India, China, Australia and Japan.
Global VC fell back to $170.9B across 8,341 deals after record quarters of $317.0B (Q1) and $238.9B (Q2) driven by OpenAI's $122B and Anthropic's $65B rounds. There were 35 rounds of $1B+ globally, a record 23 of them in the US ($98.4B total). Europe reached a 16-quarter high of $28.4B and Asia raised $39.8B. 2026 global fundraising reached $157.9B, led by the US at $108.5B.
KPMG Private Enterprise publishes Venture Pulse every quarter, using venture data from PitchBook. This Q3 2026 edition was released on October 14, 2026, with data as of September 30, 2026.
The deck opens with a welcome letter and a contents page, then runs the same module for each region: a big-number divider, a two-page narrative with a 'Trends to watch' callout, and a fixed sequence of charts (quarterly financing, median deal size, valuations, deal share, sector mix, corporate VC, exits, fundraising), ending with a top-10 deal map. Every chart slide uses an action title such as 'Late-stage valuations push past 2021 highs' that states the takeaway.
Databricks ($5B), Crusoe ($3.9B), Moonshot AI ($3.5B), Mistral AI ($3.5B), The Boring Company ($3.2B), Kling AI ($3B), Cognition, Thrive Holdings and Firmus Technologies ($2B each), and Helsing ($1.8B).
Start from your outline or source document and keep one finding per slide, written as the slide title. 2Slides can turn a document, report or outline into a slide deck, which you can then adapt to a repeating region or segment structure like this one.
The original PDF is published by KPMG at https://assets.kpmg.com/content/dam/kpmgsites/xx/pdf/2026/10/venture-pulse-q3-2026.pdf. More editions are listed at kpmg.com/venturepulse.
Original PDF of the quarterly report, published October 14, 2026.

Create Your Own Slides
Turn your ideas into professional presentations in seconds with 2slides AI.
전문 디자인을 참조하고, 스타일을 선택하며, 완벽한 텍스트 렌더링으로 슬라이드를 생성하세요. Nano Banana로 구동—지금 프레젠테이션 만들기를 시작하세요.


