
수록 모음: 투자자 발표자료 사례
Nestlé CAGNY 2025 - Accelerating Growth Strategy and Zone Americas Performance
빠른 탐색
태그
슬라이드 공유
Nestlé CAGNY 2025 - Accelerating Growth Strategy and Zone Americas Performance
레이아웃, 주요 콘텐츠 및 시각적 요소를 포함한 각 슬라이드 페이지의 상세 보기.
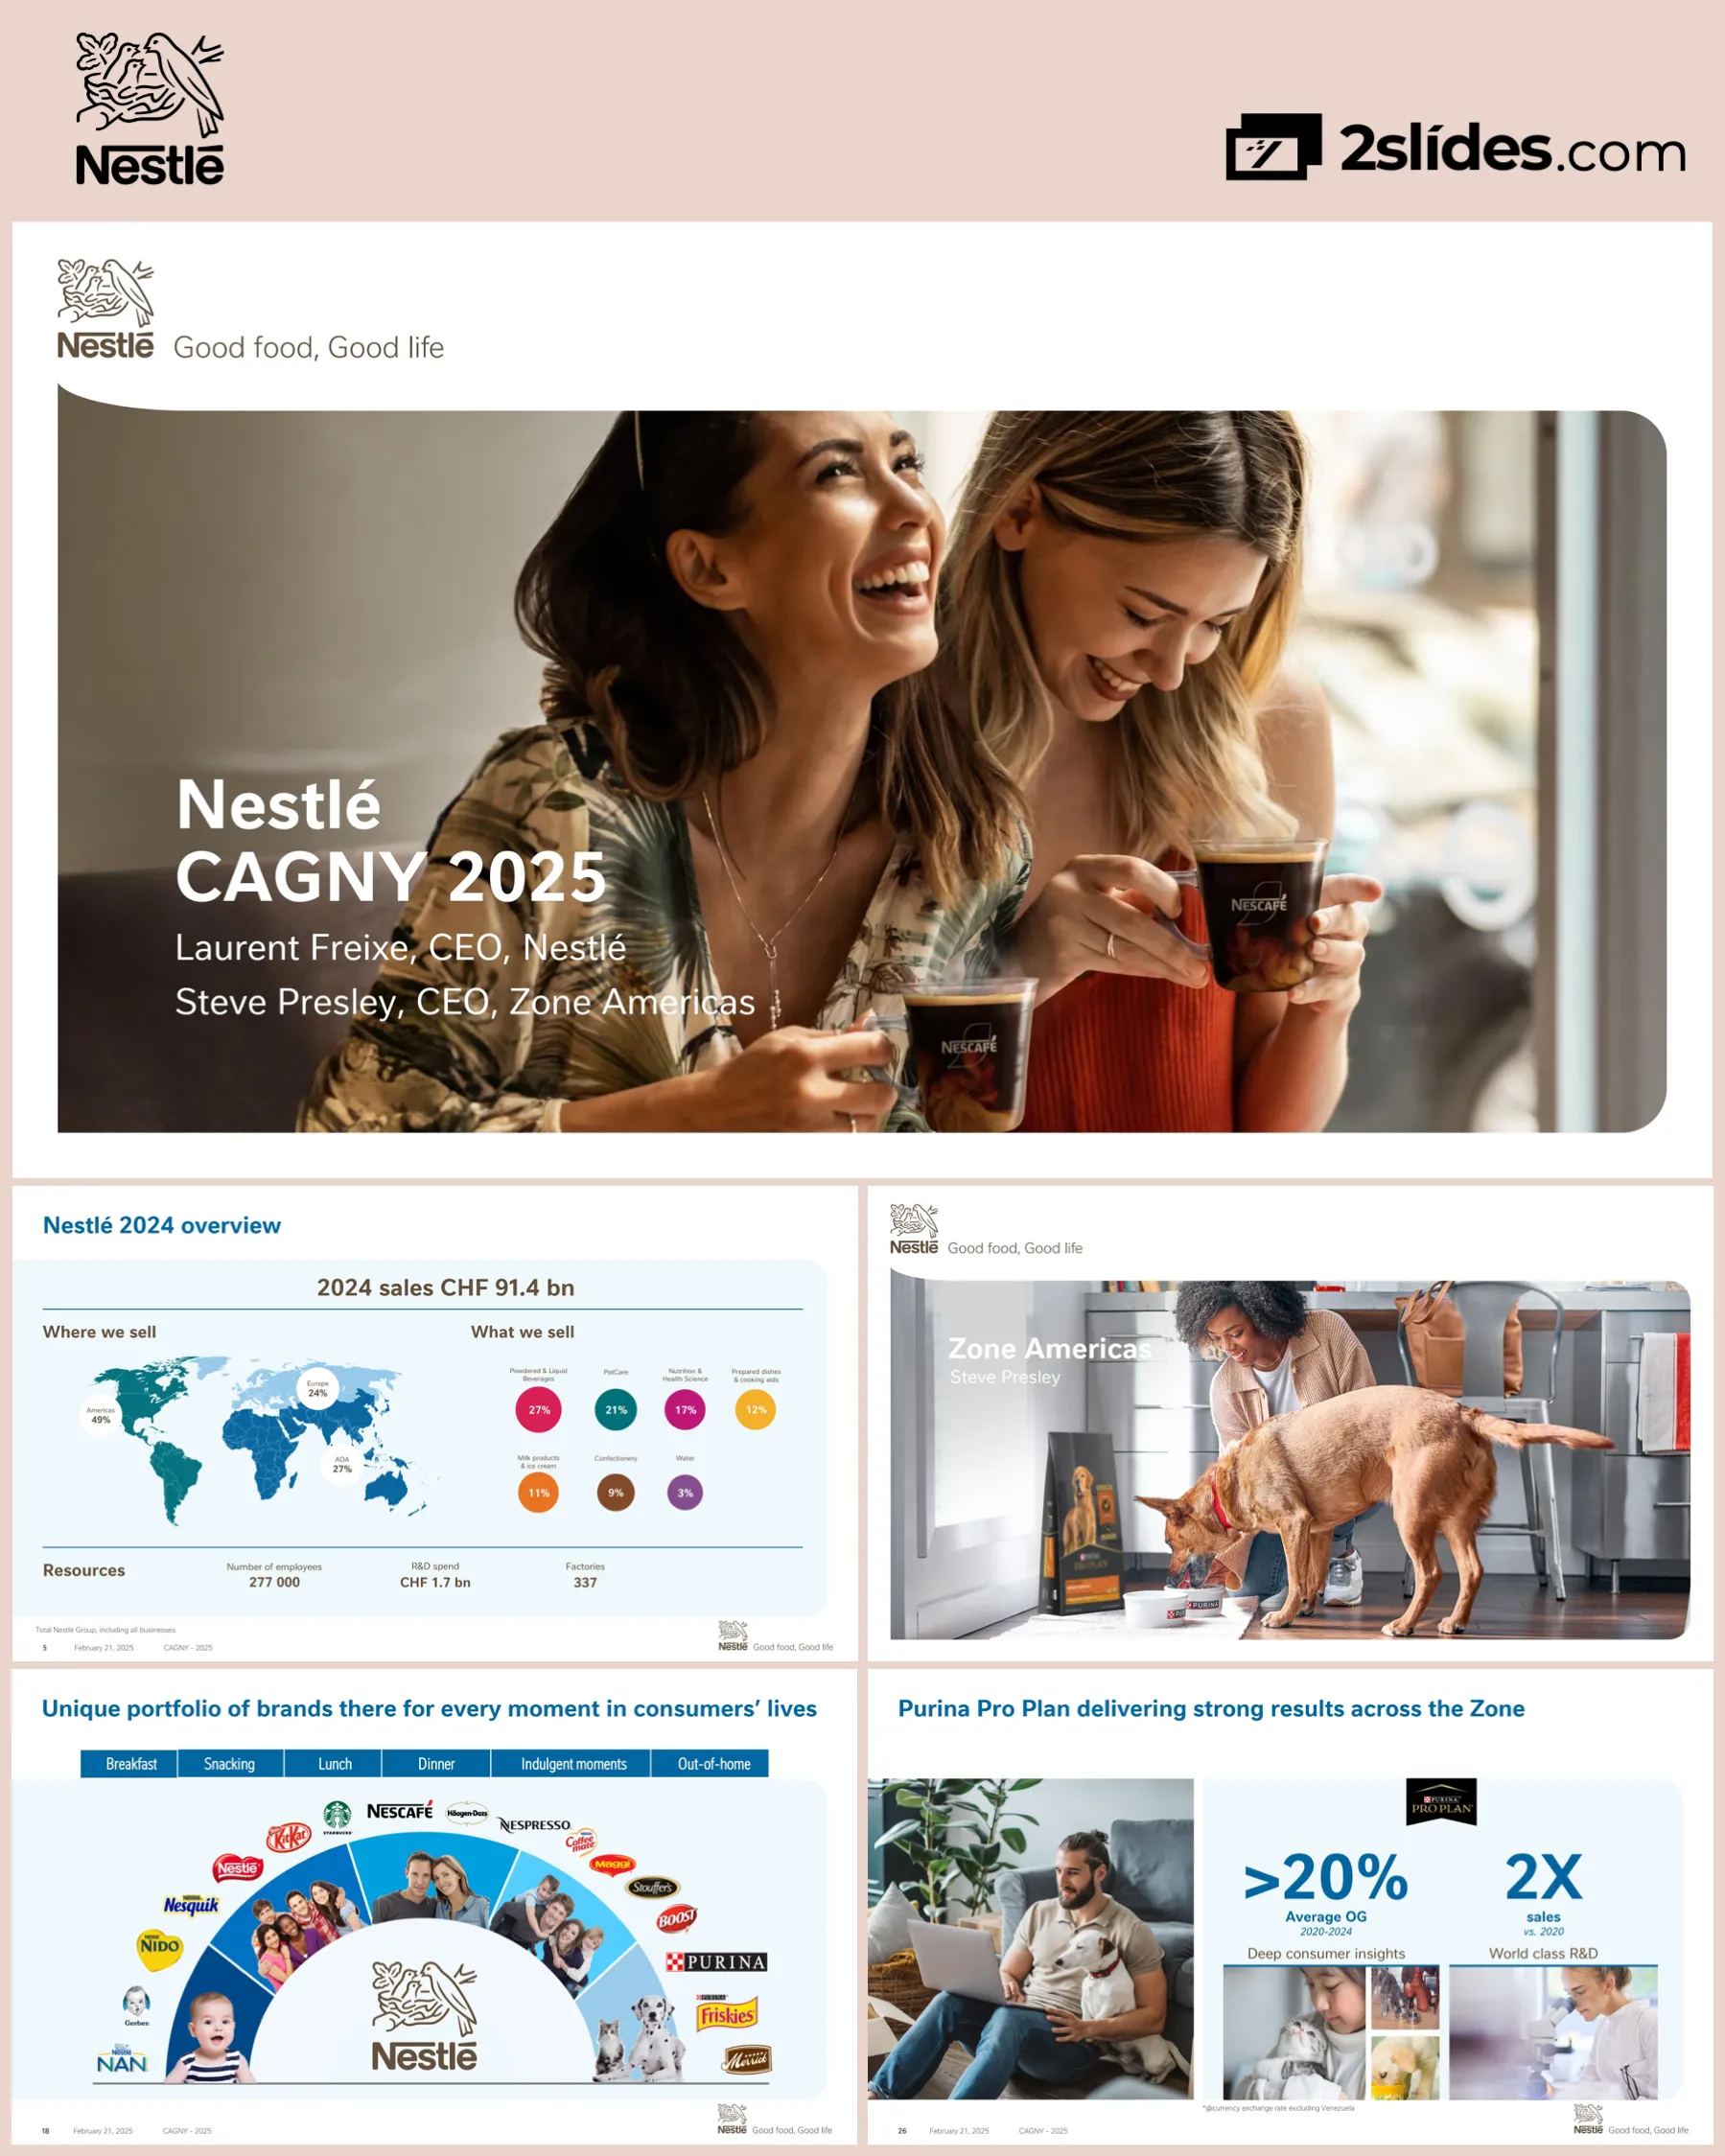
Title slide featuring Nestlé branding with two women enjoying Nescafé products in a casual setting, presenting speakers Laurent Freixe (CEO, Nestlé) and Steve Presley (CEO, Zone Americas)
Full-width lifestyle image with Nestlé logo and tagline at top, presentation title and speaker names overlaid on image
Standard forward-looking statements disclaimer explaining that presentation contains management's views and estimates subject to risks including economic conditions, foreign exchange, competitive pressures, and regulatory developments
Clean text layout with 'Disclaimer' header in blue, body text in dark gray on light blue background
Three-part presentation structure: 1) Accelerating Nestlé, 2) Zone Americas in action, 3) Key takeaways
Simple bullet list on light blue background with Nestlé branding footer
Section opener featuring lifestyle photography of three diverse people looking at mobile device together in urban setting, with 'Accelerating Nestlé' title and presenter name 'Laurent Freixe'
Full-width lifestyle image with white text overlay on left side
Global snapshot showing 2024 sales of CHF 91.4bn, geographic distribution (Americas 49%, Europe 24%, AOA 27%), product category breakdown led by Powdered & Liquid Beverages (27%) and PetCare (21%), and key resources (277K employees, CHF 1.7bn R&D, 337 factories)
Split layout with world map on left showing regional distribution, circular charts on right showing product categories, resource metrics at bottom
Brand purpose statement explaining Nestlé's Nutrition, Health & Wellness strategy with three core elements: bringing tasty and balanced diets within reach for billions, enhancing quality of life for people and pets through science-backed innovation, and brands playing a role in diet at every life stage
Left side features emotional photography of family cooking together, right side displays three text blocks with strategic messaging
Financial guidance comparison showing 2024 actual results (2.2% organic growth, 17.2% margin), 2025 guidance (improving growth, at or above 16% margin as investment increases), and medium-term targets (4%+ organic growth, 17.0%+ margin)
Three-column table format with blue headers, white cells containing performance metrics
Introduction of the strategic framework showing circular model with four quadrants: 1) Achieving Efficiencies (NCE), 2) Investing in Key Brands and Growth Platforms, 3) Driving Market Share Gains, 4) Delivering Profitable Growth. Center shows core values: Consumers, People & Teams, Quality, Safety, Good for Planet, CSV. Three strategic focus areas highlighted: Efficiency & productivity, Investment for growth, Value creation
Large circular diagram on left showing interconnected strategic elements, three blue boxes on right listing focus areas
Detailed breakdown of cost savings program targeting CHF 2.5bn by 2027, with three sources: Procurement (spend consolidation, AI-powered procurement, e-sourcing), Operational efficiency (manufacturing, logistics, operating model), and Commercial investments (promotions, price, assortment). Shows phasing: CHF 0.7bn in 2025, CHF 1.4bn in 2026, CHF 2.3bn in 2027, CHF 2.5bn sustained in 2028
Left side shows three categories with bullet points, right side displays bar chart showing savings progression with recurring vs non-recurring breakdown
Growth strategy showing how Nestlé plans to move from 3-4% category growth to 4%+ organic growth through two levers: accelerating category growth and improving market share. Four strategic actions listed: Expand winners, Scale big bets, Build new growth platforms, Address underperformers
Bar chart visualization showing progression from category growth to Nestlé organic growth target, with circular arrow icons indicating improvement actions, bullet list of strategies on right
Strategy for expanding successful businesses focusing on: strengthening global platforms (Coffee out of home/RTD, PetCare in AOA & LATAM/therapeutics & supplements), expanding successful brands (KitKat, Maggi), and increasing exposure to growing channels (E-commerce, convenience, value retailers). Features lifestyle photography of young consumer with Nescafé product
Left side shows trendy lifestyle image, right side lists three strategic priorities with sub-bullets
Product showcase displaying innovation portfolio including NAN Supreme pro infant formula, Nescafé Espresso Concentrate bottles, Maggi Air Fryer meal kit, Nestlé Choco Trio chocolate cookies, Gourmet Revelations cat food pouch, and Nescafé coffee machine
Horizontal product lineup on white background showing six major innovation launches
Emerging opportunities aligned with consumer trends: Weight management and GLP-1 companions, Nutrition for women's health, Healthy longevity, Affordable diet. Features image of person making smoothie with Orgain Organic Protein powder
Left side shows lifestyle photography of product usage, right side lists four opportunity areas with strategic framing
Framework for fixing underperforming businesses showing four dimensions of winning value proposition (Irresistible product superiority, Unbeatable value, Unmissable visibility, Compelling brand communications) with status assessment showing most cells needed improvement before corrective actions. Examples of turnarounds: Wyeth Greater China, Frozen pizza US, Coffee creamers US, Soluble coffee Europe
Left side shows four strategy dimensions, middle shows horizontal bar status indicators (green/yellow/red), right side lists specific examples
Organizational transformation overview covering: Updated strategy, Organizational changes implemented (Zone structure simplified, Waters & premium beverages reorganized, Digital & sustainability elevated), and Cascaded execution plans through Operational Master Plan (OMP). Features photo of leadership discussion at conference
Left side shows leadership meeting photography, right side presents three categories of organizational changes as bullet lists
Section transition slide introducing Steve Presley's segment on Zone Americas, featuring lifestyle photography of woman with golden retriever and Purina products in home setting
Full-width lifestyle image with white text overlay on left
Zone Americas overview showing geographic split (NA 72%, LATAM 28%), product mix dominated by Petcare (30%), Coffee (20%), Food (13%), Health science (10%), Nutrition (8%), with resources including 100K employees, 24 countries, 121 factories, 27 billionaire brands, and ~70% sales in leadership positions
Split layout with North/South America map on left, circular category charts on right, resource metrics at bottom
Brand occasion mapping showing Nestlé's portfolio coverage across consumer moments: Breakfast (Gerber, NAN, Nido, Nesquik), Snacking (Nestlé, KitKat, Starbucks), Lunch (Nescafé, Häagen-Dazs), Dinner (Nespresso, Coffee mate, Maggi, Stouffer's), Indulgent moments (Boost), Out-of-home (Purina, Friskies, Merrick), with central family imagery showing different life stages
Circular design with brands radiating around central family photos, organized by consumption occasions shown in blue header
Performance summary highlighting Zone Americas as Nestlé's largest business with CHF 45bn FY-2024 sales, 6.3% average organic growth over 6 years (2019-2024), >21.0% UTOP margin. Positioning strengths include leadership in high-growth categories (coffee, pet), exposure to emerging economies with growing middle class, and appeal to young consumers passionate about food, beverage and pets
Left side shows three key metrics in large text, right side presents three strategic positioning points as bullets
Repeat of strategic framework showing the four-quadrant Virtuous Circle model with focus areas: Efficiency & productivity, Investment for growth, Value creation
Same circular diagram with strategic elements and three blue focus area boxes
Framework repeated with emphasis on 'Investment for growth' pillar, other two sections (Efficiency & productivity, Value creation) shown in reduced opacity
Same circular diagram with visual emphasis technique highlighting one of three focus areas
Three pillars of operational excellence in Americas: Procurement (leverage scale across group through e-sourcing, supplier management, end-to-end design to value), Operational efficiency (enterprise business planning with planning intelligent center, streamlined operating model with shared service expansion), Commercial investment (total commercial spend optimization implementation, reduction of non-working spend). Features image of person using tablet showing analytics dashboard
Left side shows business analytics imagery, right side presents three categories with detailed tactics
Strategic framework shown again emphasizing the full integrated model
Circular diagram with all elements visible equally
Framework for growth showing three strategic approaches: Existing winners (Purina supplements & therapeutics, E-commerce), Innovation big bets (Espresso concentrate), Address underperformers (U.S. frozen)
Three-column layout with headers and specific examples under each category
Same three-column framework with emphasis on 'Existing winners' column showing Purina supplements & therapeutics and E-commerce examples, other columns shown in reduced opacity
Three columns with visual hierarchy emphasizing first column
Pro Plan veterinary business success metrics showing >20% average organic growth (2020-2024), 2X sales vs 2020 (*at currency exchange rate excluding Venezuela). Two success factors highlighted: Deep consumer insights (with collage of pet owner research images) and World class R&D (showing scientist in laboratory). Features lifestyle image of man working from home with white dog
Left side shows authentic lifestyle photography, center shows Purina Pro Plan logo with key metrics, right side displays two success factors with supporting imagery
Pro Plan veterinary diets & supplements growth story showing strong performance with >20% average organic growth, total addressable market >CHF 5bn. Features 'Advanced therapeutic nutrition' product lineup showing veterinary diet range (EL Elemental, EN Gastroenteric, DM Diabetic, UR Urinary Risk formulas) alongside chart showing sales growth from 2020 to 2024 with steady upward trajectory
Left side displays product photography grid, right side shows growth metrics and chart
Three-pillar strategy for sustaining growth: Irresistible product superiority (Tailored innovation with world-class R&D, showing advanced product formulations), Compelling brand communications (Collaborating with key opinion leaders, showing Purina Institute at veterinary conference), Unmissable visibility (Serving consumer needs with Vet Direct D2C, showing pet owner receiving Purina delivery box)
Three equal columns each with header, supporting imagery, and descriptive text
Return to three-column growth framework maintaining focus on existing winners section
Three columns with consistent opacity emphasis on winners column
E-commerce performance showing 22% e-intensity in 2024, 23% average organic growth (2020-2024), with CPG e-commerce sales globally projected to show consistent double-digit growth through 2030 per Euromonitor 2024 data. Note indicates figures for Nestlé in Americas including Zone & globally managed businesses at constant exchange rate excluding Venezuela & NWNA Divestment. Features lifestyle image of woman shopping online with credit card
Left side shows e-commerce consumer photography, right side displays two key metrics and growth projection chart
Three-pronged e-commerce strategy: Irresistible 'product' superiority (Setting new standards for product experience on mature markets & winning categories Pet & Coffee; Pilot frontier practices: Gen AI content, AI agents, e-SRM), Unmissable Visibility split between In developing markets (scale learnings fast and be brilliant at the basics, showing Brazil, Mexico, Walmart.com, Mercado Libre logos) and Accelerate eB2B across traditional trade (with market coverage and engagement, showing mobile commerce illustration)
Two main sections with supporting detail, country/retailer logos for scale markets, mobile commerce visualization for eB2B
Three-column framework with emphasis on 'Innovation big bets' showing Espresso concentrate example, other columns in reduced opacity
Three columns with visual hierarchy emphasizing center innovation column
Coffee business performance showing CHF 9.8bn 2024 sales, 8.9% 6-year average organic growth (2019-24), 36% market share in-home (incl. Nespresso, excl. RTD NA and R&G Latam). Consumer trends driving growth: More consumers (Gen Z entering coffee 4 years earlier with youth group image) and More consumption occasions (Refreshment, Personalization with iced coffee image). Note: Nestlé in Americas, FY 2024 Coffee & Coffee Enhancers results
Left side shows performance metrics box, right side split into two consumer trend sections with supporting photography
Product launch announcement introducing new Nescafé Espresso Concentrate in two variants (Sweet Vanilla and Black arabica blend). Features product photography of two 500ml concentrate bottles with three key benefits: Irresistible product superiority, Hacking iced coffee creations with easy customization, Multi-market launch in Z-AMS (Zone Americas). Includes stylized text 'Introducing new NESCAFÉ Espresso Concentrate'
Left side shows large product photography, right side lists three strategic benefits
US launch results showing: 2/3 of volume incremental, Gen Z index 332, 8% share in L4 weeks at Kroger (Source: Circana week ending 02/02/25, SS Liq Concentrate - Coffee, includes Nescafé & SBUX Concentrate). Four success pillars demonstrated: Compelling brand communications (mobile ad creative), Unmissable Visibility (Kroger retail display), Irresistible product superiority (consumer product usage). Market expansion planned for Mexico, Brazil, and Canada (flags shown)
Left side shows Results metrics, center displays US launch success across four pillars with supporting imagery, right side shows expansion markets with flags
Three-column framework with emphasis on 'Address underperformers' showing U.S. frozen example
Three columns with visual hierarchy emphasizing rightmost column
Turnaround diagnosis and actions: Diagnosis showed Value Imbalance with pricing pressure from commodities leading to +15% above category pricing (2021-23, Source: Circana average price vs rest of market). Actions taken focus on Unbeatable Value through 95% of portfolio in $4-6 price range and leveraging breadth of portfolio, featuring California Pizza Kitchen, DiGiorno, Tombstone, and Jack's brand logos
Top section shows diagnosis with problem statement and metric, bottom section shows solution with brand logos
Turnaround strategy with Diagnosis (Peak Covid demand, Significant simplification of portfolio & innovation deceleration leading to -25% total distribution points change 2019-'23, Source: Circana) and Actions across four pillars: Irresistible product superiority (Focus on taste preference), Unbeatable value (Fixing value slopes and price gaps), Compelling brand communications (Investing in generating demand), Unmissable visibility (Reigniting innovation). Features Stouffer's logo prominently
Top section shows diagnosis with problem metrics, bottom section displays four strategic action pillars in boxes
Final section opener featuring lifestyle photography of three diverse people sharing KitKat products in casual urban setting, with 'Key messages' title and 'Laurent Freixe' name
Full-width lifestyle image with white text overlay
Summary of presentation with four main points: Creating 'Fuel for Growth', Investing to accelerate performance, Organization aligned, Moving fast to change Nestlé. Features Executive Leadership Team photo walking together in Nestlé headquarters with large brand logo visible in background
Left side shows leadership team photography, right side lists four key strategic messages
이 슬라이드 및 기본 프레젠테이션 콘텐츠에 대한 일반적인 질문.
'Fuel for Growth' is Nestlé's efficiency and productivity program targeting CHF 2.5 billion in savings by 2027. The program focuses on three areas: procurement (spend consolidation, AI-powered procurement, e-sourcing expansion), operational efficiency (manufacturing and logistics optimization, streamlined operating model), and commercial investments (promotions, price, assortment, product returns optimization). Savings will be phased in progressively: CHF 0.7bn in 2025, CHF 1.4bn in 2026, CHF 2.3bn in 2027, reaching CHF 2.5bn sustained in 2028. The savings will fuel reinvestment in growth initiatives while maintaining or improving margin targets.
The Nestlé Virtuous Circle is the company's strategic framework integrating efficiency and growth in a self-reinforcing cycle. It consists of four interconnected elements: (1) Achieving Efficiencies through Nestlé Continuous Excellence (NCE), (2) Investing in Key Brands and Growth Platforms, (3) Driving Market Share Gains, and (4) Delivering Profitable Growth. At the center are Nestlé's core values around Consumers, People & Teams, Quality, Safety, Good for the Planet, and Creating Shared Value (CSV). This framework is built on Data & AI capabilities and guides how the company transforms efficiency gains into growth investments, which drive market share improvements, leading to profitable growth that funds further efficiency improvements—creating a virtuous cycle.
For 2025, Nestlé is guiding for organic sales growth that is 'improving compared to 2024' (which was 2.2%), with underlying trading operating profit margin at or above 16% as the company invests for growth. The medium-term guidance (in normal market conditions) targets 4%+ organic sales growth and 17.0%+ underlying trading operating profit margin. This represents a deliberate choice to invest in growth during 2025 (accepting some margin compression) to build momentum toward stronger medium-term performance.
Zone Americas is Nestlé's largest business, representing 49% of the company's global sales with CHF 45 billion in FY-2024 revenue. The zone has delivered strong performance with 6.3% average organic growth over 6 years (2019-2024) and maintains a margin above 21.0%. It operates across 24 countries with 100,000 employees, 121 factories, and 27 billionaire brands. Approximately 70% of Zone Americas sales come from products in market leadership positions. The zone is geographically split between North America (72%) and Latin America (28%), with the product portfolio led by PetCare (30%), Coffee (20%), and Food (13%).
Purina Pro Plan's veterinary diets and supplements business has achieved >20% average organic growth (2020-2024) with sales doubling versus 2020. The business addresses a total addressable market exceeding CHF 5 billion. The growth strategy has three pillars: (1) Irresistible product superiority through tailored innovation with world-class R&D, developing advanced therapeutic nutrition formulas; (2) Compelling brand communications through collaboration with key opinion leaders and the Purina Institute, which advances science for pet health; (3) Unmissable visibility by serving consumer needs through Vet Direct D2C channels, making products easily accessible to pet owners following veterinary recommendations.
Nestlé has achieved strong e-commerce momentum in the Americas with 22% e-intensity (percentage of sales via e-commerce) in 2024 and 23% average organic growth from 2020-2024. The strategy is tailored by market maturity: In mature markets, they're setting new standards for product experience in winning categories like Pet and Coffee, piloting frontier practices including Gen AI content, AI agents, and e-SRM. In developing markets like Brazil and Mexico, they're scaling learnings fast and executing basics brilliantly on platforms like Walmart.com and Mercado Libre. They're also accelerating eB2B across traditional trade channels with market coverage and engagement tools. Global CPG e-commerce is projected to maintain consistent double-digit growth through 2030.
Nescafé Espresso Concentrate is a new innovation launched to capture emerging coffee consumption trends, particularly among Gen Z consumers entering coffee consumption 4 years earlier than previous generations, and the growing demand for iced coffee refreshment and personalization. The product offers irresistible product superiority enabling consumers to 'hack' iced coffee creations with easy customization. Early US launch results are strong: 2/3 of volume is incremental, Gen Z index is 332 (meaning extreme over-indexing with this demographic), and the product achieved 8% share in its first 4 weeks at Kroger. The innovation is being rapidly expanded across key markets including Mexico, Brazil, and Canada, representing a significant new growth platform for Nestlé's coffee business.
Nestlé identified 18 key underperforming cells accounting for 21% of sales that were driving most market share loss. For US frozen pizza, diagnosis showed a value imbalance with pricing 15% above category (2021-23) due to commodity pressure. The solution focuses on unbeatable value by positioning 95% of the portfolio in the $4-6 price range and leveraging the breadth of brands (DiGiorno, California Pizza Kitchen, Tombstone, Jack's). For US frozen meals (Stouffer's), diagnosis revealed peak Covid demand followed by significant portfolio simplification and innovation deceleration, resulting in 25% loss of distribution points (2019-23). The turnaround strategy addresses all four value proposition elements: irresistible product superiority (taste preference focus), unbeatable value (fixing value slopes and price gaps), compelling brand communications (investing in demand generation), and unmissable visibility (reigniting innovation).

Create Your Own Slides
Turn your ideas into professional presentations in seconds with 2slides AI.
전문 디자인을 참조하고, 스타일을 선택하며, 완벽한 텍스트 렌더링으로 슬라이드를 생성하세요. Nano Banana로 구동—지금 프레젠테이션 만들기를 시작하세요.



