
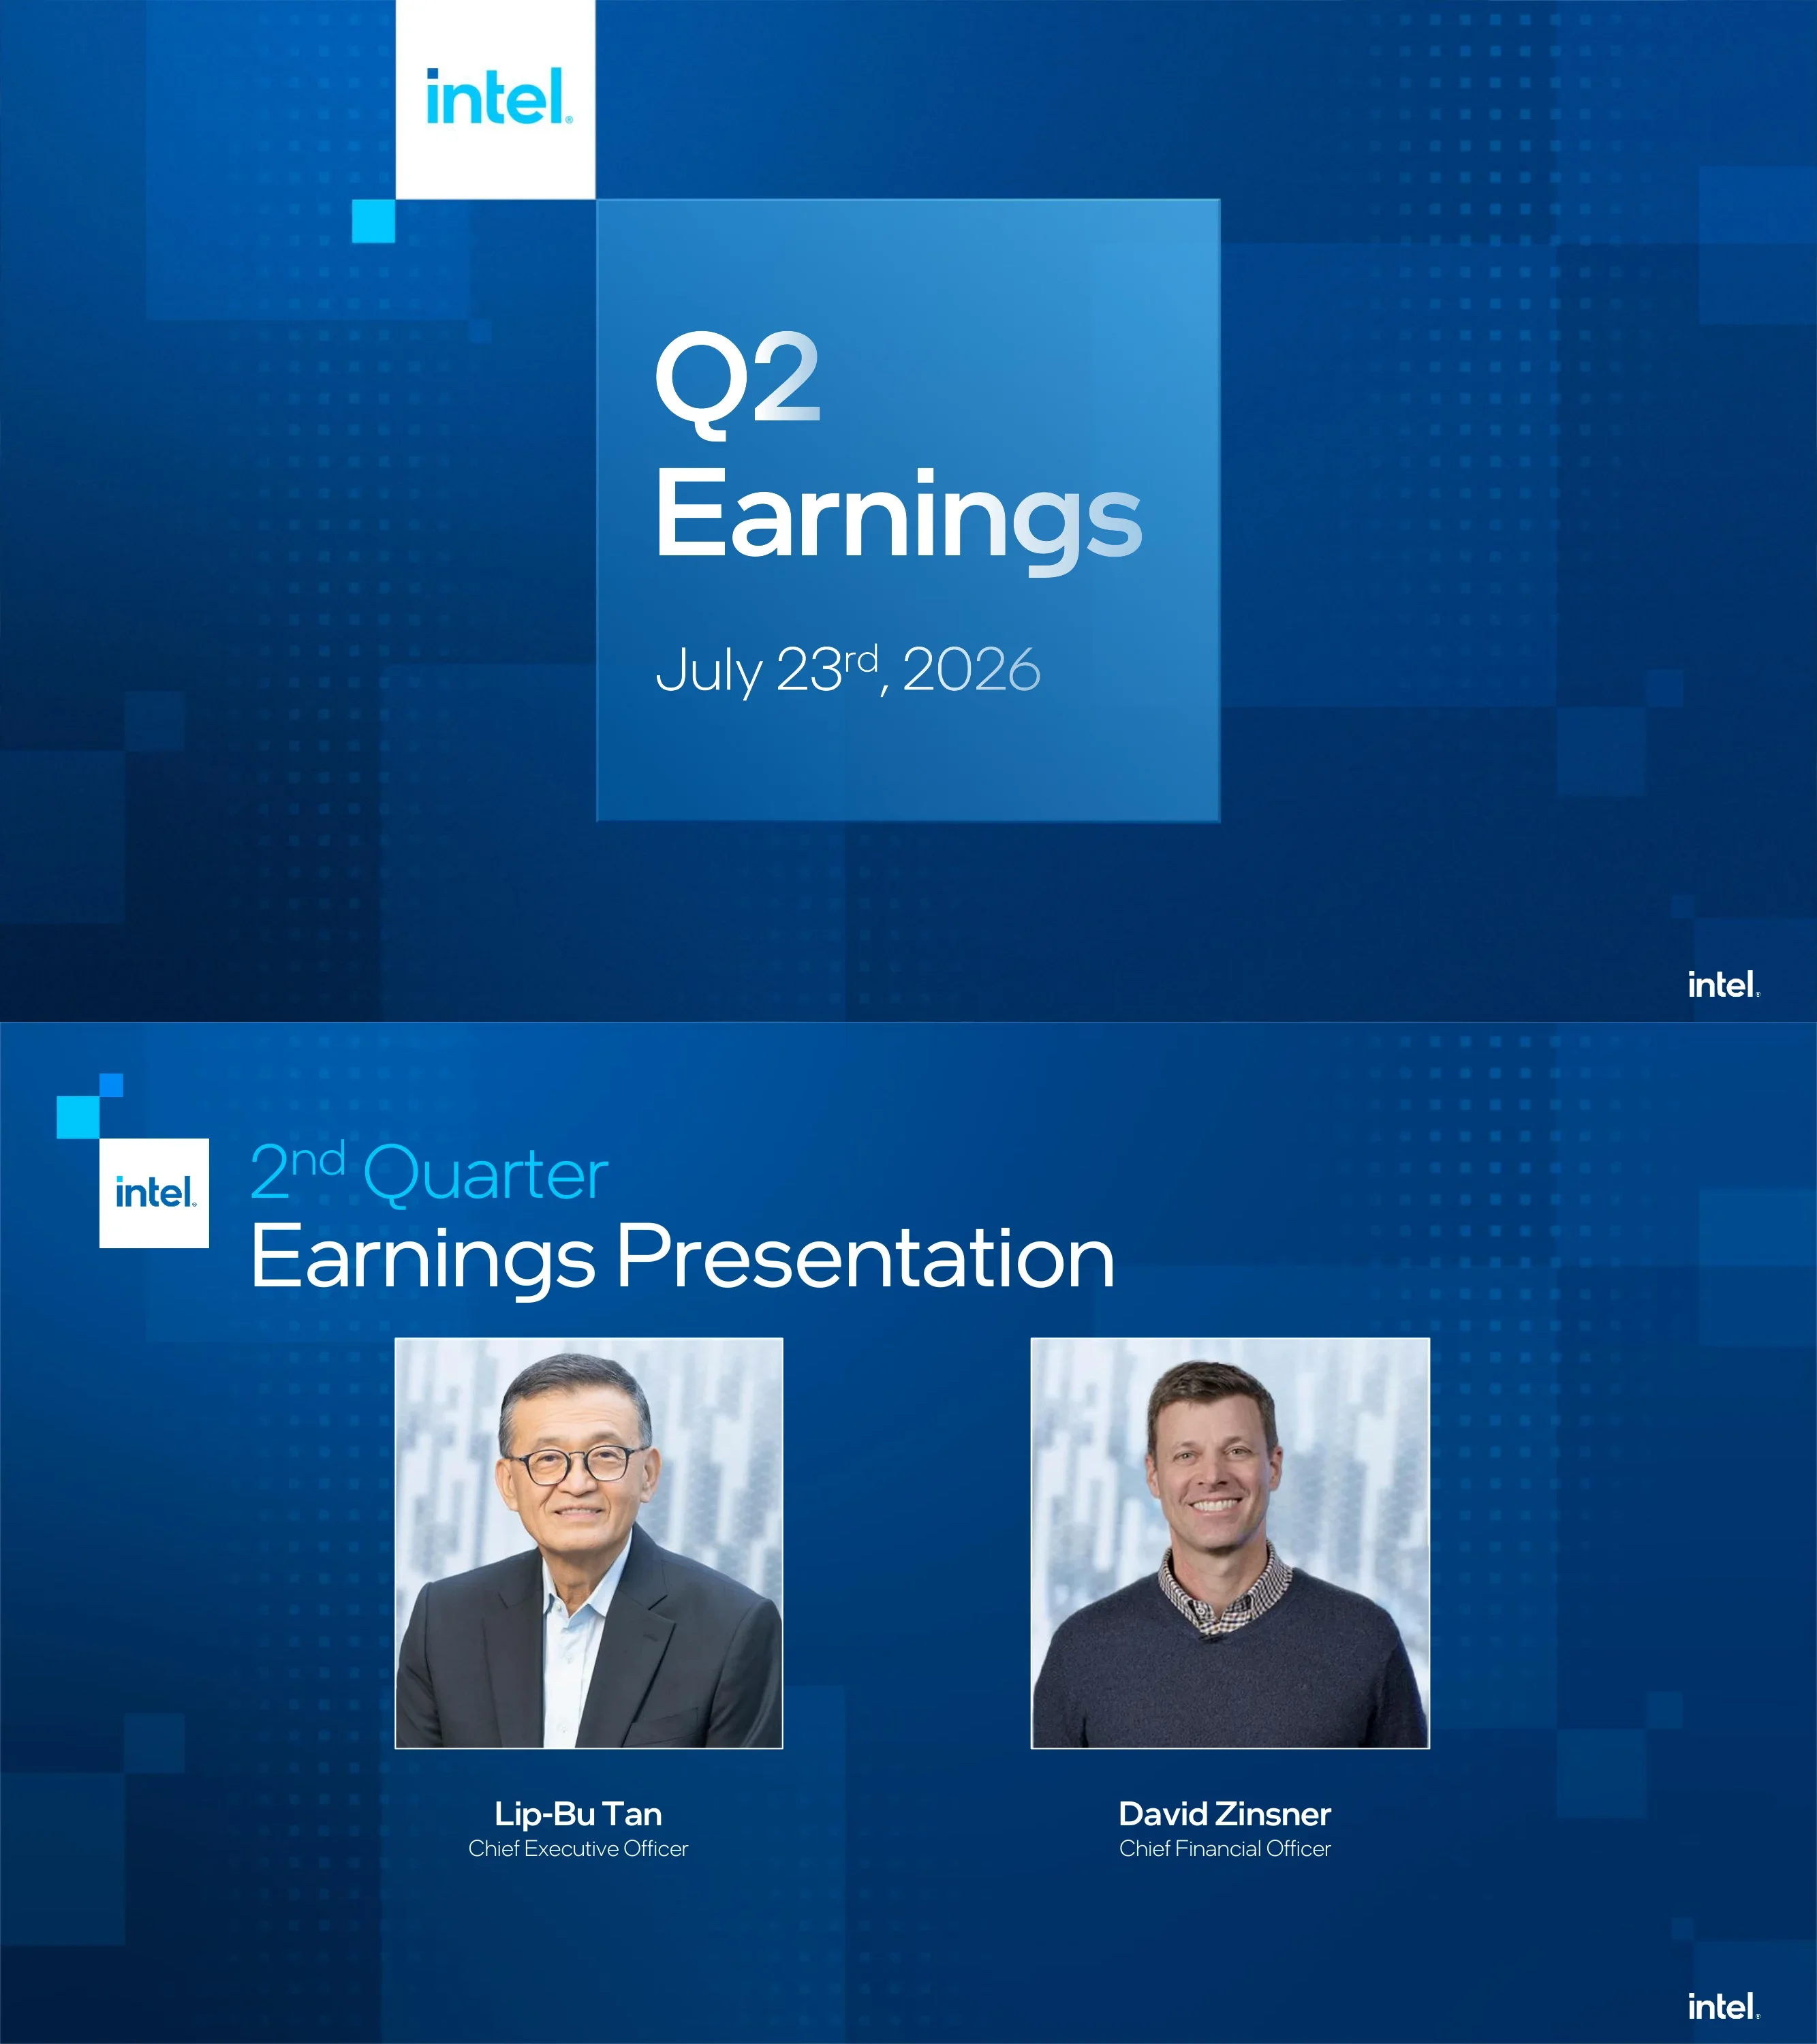
Intel's Q2 2026 earnings presentation (July 23, 2026), delivered by CEO Lip-Bu Tan and CFO David Zinsner — a compact 16-slide quarterly deck covering consolidated results, per-segment performance for CCPG, DCAI and Intel Foundry, Q3 guidance, and a full GAAP-to-non-GAAP reconciliation appendix.
빠른 탐색
태그
슬라이드 공유
Intel's Q2 2026 earnings presentation (July 23, 2026), delivered by CEO Lip-Bu Tan and CFO David Zinsner — a compact 16-slide quarterly deck covering consolidated results, per-segment performance for CCPG, DCAI and Intel Foundry, Q3 guidance, and a full GAAP-to-non-GAAP reconciliation appendix.
레이아웃, 주요 콘텐츠 및 시각적 요소를 포함한 각 슬라이드 페이지의 상세 보기.
Cover slide announcing Intel's second quarter 2026 earnings presentation.
Full-bleed dark blue ground with a subtle dot-grid and rectangle pattern; the Intel logo sits in a white square upper left; a translucent blue panel centre-right holds the title over the date.
Introduces the two presenters: Lip-Bu Tan, Chief Executive Officer, and David Zinsner, Chief Financial Officer.
Two-line headline upper left beside the logo; two rectangular portraits side by side in the lower two thirds, each with a bold name and a lighter title beneath.
Combined legal slide: explains that gross margin, operating income, EPS and adjusted free cash flow are presented non-GAAP with reconciliations in the appendix, then enumerates forward-looking statement risks including process node execution, government equity stakes, tariffs, export controls and supply chain constraints.
Single lighter blue panel filling the slide below the heading, holding four dense justified bullet paragraphs at small type.
Four themes: tangible progress in the transformation (Q2 exceeds guidance, strong demand, disciplined execution, growing supply); increasing investments to capture growth (x86, purpose-built ASICs, advanced packaging, wafer foundry); improving execution across all nodes (18A ramped, 14A in 2028, EMIB-T progress); and unprecedented demand for AI compute (DCAI record growth, edge and physical AI, ASIC momentum).
Photograph of the Intel campus sign occupies the left third; four stacked banner rows at right, each a bold headline over a single supporting line.
Revenue $16.1B up 25.4% year over year and $1.8B above the April outlook; non-GAAP gross margin 41.8%, up 12.1 points; non-GAAP EPS $0.42, up $0.52. Footnotes give the GAAP equivalents (40.4% gross margin, $(2.16) EPS).
Three equal square tiles in a row, each with an oversized figure, a label, then a bold year-over-year line and a lighter comparison-to-outlook line; two footnotes along the bottom.
Five quarters from Q2'25 to Q2'26: revenue $12.9B, $13.7B, $13.7B, $13.6B, $16.1B; non-GAAP gross margin 29.7%, 40.0%, 37.9%, 41.0%, 41.8%; non-GAAP operating income $(0.5)B, $1.5B, $1.2B, $1.7B, $2.8B. Takeaways: robust growth with AI-driven demand accelerating, disciplined execution, output beating expectations.
The deck's signature segment layout — dark chart panel at left with revenue bars, a white margin line overlaid and a lighter op income band at the base; dark takeaway panel at right with three short statements over a photograph; GAAP footnotes beneath.
Client Computing Group across the same five quarters: revenue $7.9B, $8.5B, $8.2B, $7.7B, $8.9B; segment operating margin 26.1%, 31.6%, 27.0%, 32.6%, 26.4%; segment op income $2.1B, $2.7B, $2.2B, $2.5B, $2.3B. Notes market resilience despite component inflation, AI PC and edge momentum, and Series 3 built on 18A.
Same segment template as the previous slide, with the segment name set beside the Intel logo at the top.
Data Center and AI: revenue $3.9B, $4.1B, $4.7B, $5.1B, $6.3B; operating margin 16.1%, 23.4%, 26.4%, 30.5%, 39.5%; op income $0.6B, $1.0B, $1.3B, $1.5B, $2.5B. Notes AI driving CPU density with record year-over-year growth, additional long-term agreements secured, and purpose-built silicon revenue nearly tripling.
Identical segment template; the steepest margin line in the deck rises across all five quarters.
Foundry: revenue $4.4B, $4.2B, $4.5B, $5.4B, $5.8B; segment operating margin -71.7%, -54.8%, -55.7%, -45.0%, -36.2%; segment operating loss $(3.2)B, $(2.3)B, $(2.5)B, $(2.4)B, $(2.1)B. Notes improved yields and cycle time driving supply upside, 18A-P risk production, commitment to 14A high-volume manufacturing in 2028.
Same template adapted to negative values — the op loss band sits below the zero line and the margin line climbs from the bottom left toward the axis.
Section divider introducing forward guidance.
Full-bleed patterned blue field with a single word centred in light gradient type; no other elements but the corner logo.
Guidance for the third quarter: revenue $15.8–16.8B (up $2.6B year over year), non-GAAP gross margin approximately 42.0% (up 2.0 points), non-GAAP EPS $0.38 (up $0.15), all based on the midpoint of the revenue range.
Three equal tiles matching the Q2 highlights slide, so actuals and guidance read as a pair; two methodology footnotes beneath.
Question and answer holding slide.
Returns to the cover's composition — logo in a white square upper left, translucent panel centre holding the heading.
Divider opening the reconciliation appendix.
Full-bleed divider matching the Outlook slide.
Five-quarter reconciliation table: GAAP gross margin 27.5% to 40.4% bridged to non-GAAP 29.7% to 41.8% via acquisition-related adjustments and share-based compensation; GAAP operating income bridged to non-GAAP; and GAAP diluted EPS $(0.67) and $(2.16) bridged to non-GAAP $(0.10) and $0.42, including a $2.45 mark-to-market adjustment on Escrowed Shares.
Single wide table panel with five quarter columns; indented adjustment rows sit under each GAAP starting line, with rules above each non-GAAP subtotal; two footnotes explain Escrowed Shares and the projected tax rate.
Reconciles the Q3 2026 outlook against Q3 2025 actuals: GAAP gross margin 41.0% to non-GAAP 42.0%, and GAAP diluted EPS $0.31 to non-GAAP $0.38, with the prior-year column showing the larger adjustments including a $(1.20) divestiture gain.
Two-column table (outlook versus prior-year actuals) in the same panel style as the previous slide.
Q2 2026 adjusted free cash flow: GAAP net cash from operating activities $7.0B, less capital expenditures $(2.7)B, plus government incentives $0.1B, less net partner contributions $(12.2)B and finance lease payments $(0.6)B, giving adjusted free cash flow of $(8.4)B.
Single narrow table centred in a panel, six rows with a rule above the total; far more white space than the preceding two tables.
이 슬라이드 및 기본 프레젠테이션 콘텐츠에 대한 일반적인 질문.
The full 16-slide Intel Q2 2026 earnings presentation as both PDF and editable PowerPoint, plus a page-by-page preview so you can see every slide before downloading. The PPTX keeps layouts, charts and text editable so you can drop in your own numbers.
Yes. It is the Q2 2026 Earnings Deck that Intel published on its investor relations site alongside the July 23, 2026 results, including the forward-looking-statements slide and the full GAAP-to-non-GAAP reconciliation appendix. That is what makes it useful as a reference — the disclosure discipline is what a public company actually ships.
The segment slide, used four times here (consolidated, CCPG, DCAI, Foundry). It puts five quarters of revenue bars, an operating-margin line and an income/loss band on one axis, with exactly three short takeaways in a panel at the right. Reusing one layout across every segment is what keeps a results deck comparable quarter to quarter.
Intel Foundry runs a negative operating margin across all five quarters, and the deck does not bury it — the loss band sits below the zero line and the margin line is labelled at every point from -71.7% to -36.2%. The takeaway panel leads with what improved (yields, cycle time, node commitments) rather than with the level. It is a useful model if you have to report a business that is not yet profitable.
Open the PPTX and check each chart before committing — exported investor decks often mix native PowerPoint charts with pasted images. Layouts, text, colours and shapes stay editable either way, so even a flattened chart can be replaced in place without rebuilding the slide.
Because every headline figure in the body is non-GAAP. Revenue, gross margin, EPS and free cash flow all carry footnotes pointing to the appendix, where each adjustment is itemised. Keeping the arithmetic out of the body and auditable in the back is the single easiest practice to copy if anyone has questioned how you calculate an adjusted metric.
A dark blue patterned ground throughout, one Intel blue for revenue bars, a lighter blue for the income/loss band, white for the margin line, and light gradient type for headings. Charts sit in dark panels with the takeaway text in a separate panel at the right. Dividers invert to a single word on a full-bleed field.
It is at the tight end, and that is the point of the example. Four segment slides, one highlights slide, one guidance slide, one executive summary and three appendix tables cover a full quarter. Anything longer usually belongs in an investor day rather than a quarterly call.
Intel publishes each quarter's Earnings Deck, Earnings Release and Prepared Remarks on this page; this deck is the Q2 2026 entry.

Create Your Own Slides
Turn your ideas into professional presentations in seconds with 2slides AI.
전문 디자인을 참조하고, 스타일을 선택하며, 완벽한 텍스트 렌더링으로 슬라이드를 생성하세요. Nano Banana로 구동—지금 프레젠테이션 만들기를 시작하세요.
Your AI Agent for slides. Save time, shine faster with intelligent presentation creation.




© 2026 2slides. All rights reserved.