
수록 모음: 투자자 발표자료 사례
IGO Limited 1Q27 Results Presentation (Q1 FY2027, July–September 2026), lodged with the ASX: Nova nickel-copper operation's final full quarter, record spodumene production at Greenbushes, the Kwinana lithium hydroxide refinery, Group financial results and strategic priorities. Amounts are in Australian dollars (A$) unless noted.
이 프레젠테이션의 표지를 스타일 참고 자료로 사용해 내 콘텐츠로 슬라이드를 만듭니다. 아래에서 원하는 페이지를 골라 그 레이아웃을 참고로 쓸 수도 있습니다.
빠른 탐색
태그
슬라이드 공유
IGO Limited 1Q27 Results Presentation (Q1 FY2027, July–September 2026), lodged with the ASX: Nova nickel-copper operation's final full quarter, record spodumene production at Greenbushes, the Kwinana lithium hydroxide refinery, Group financial results and strategic priorities. Amounts are in Australian dollars (A$) unless noted.
레이아웃, 주요 콘텐츠 및 시각적 요소를 포함한 각 슬라이드 페이지의 상세 보기.
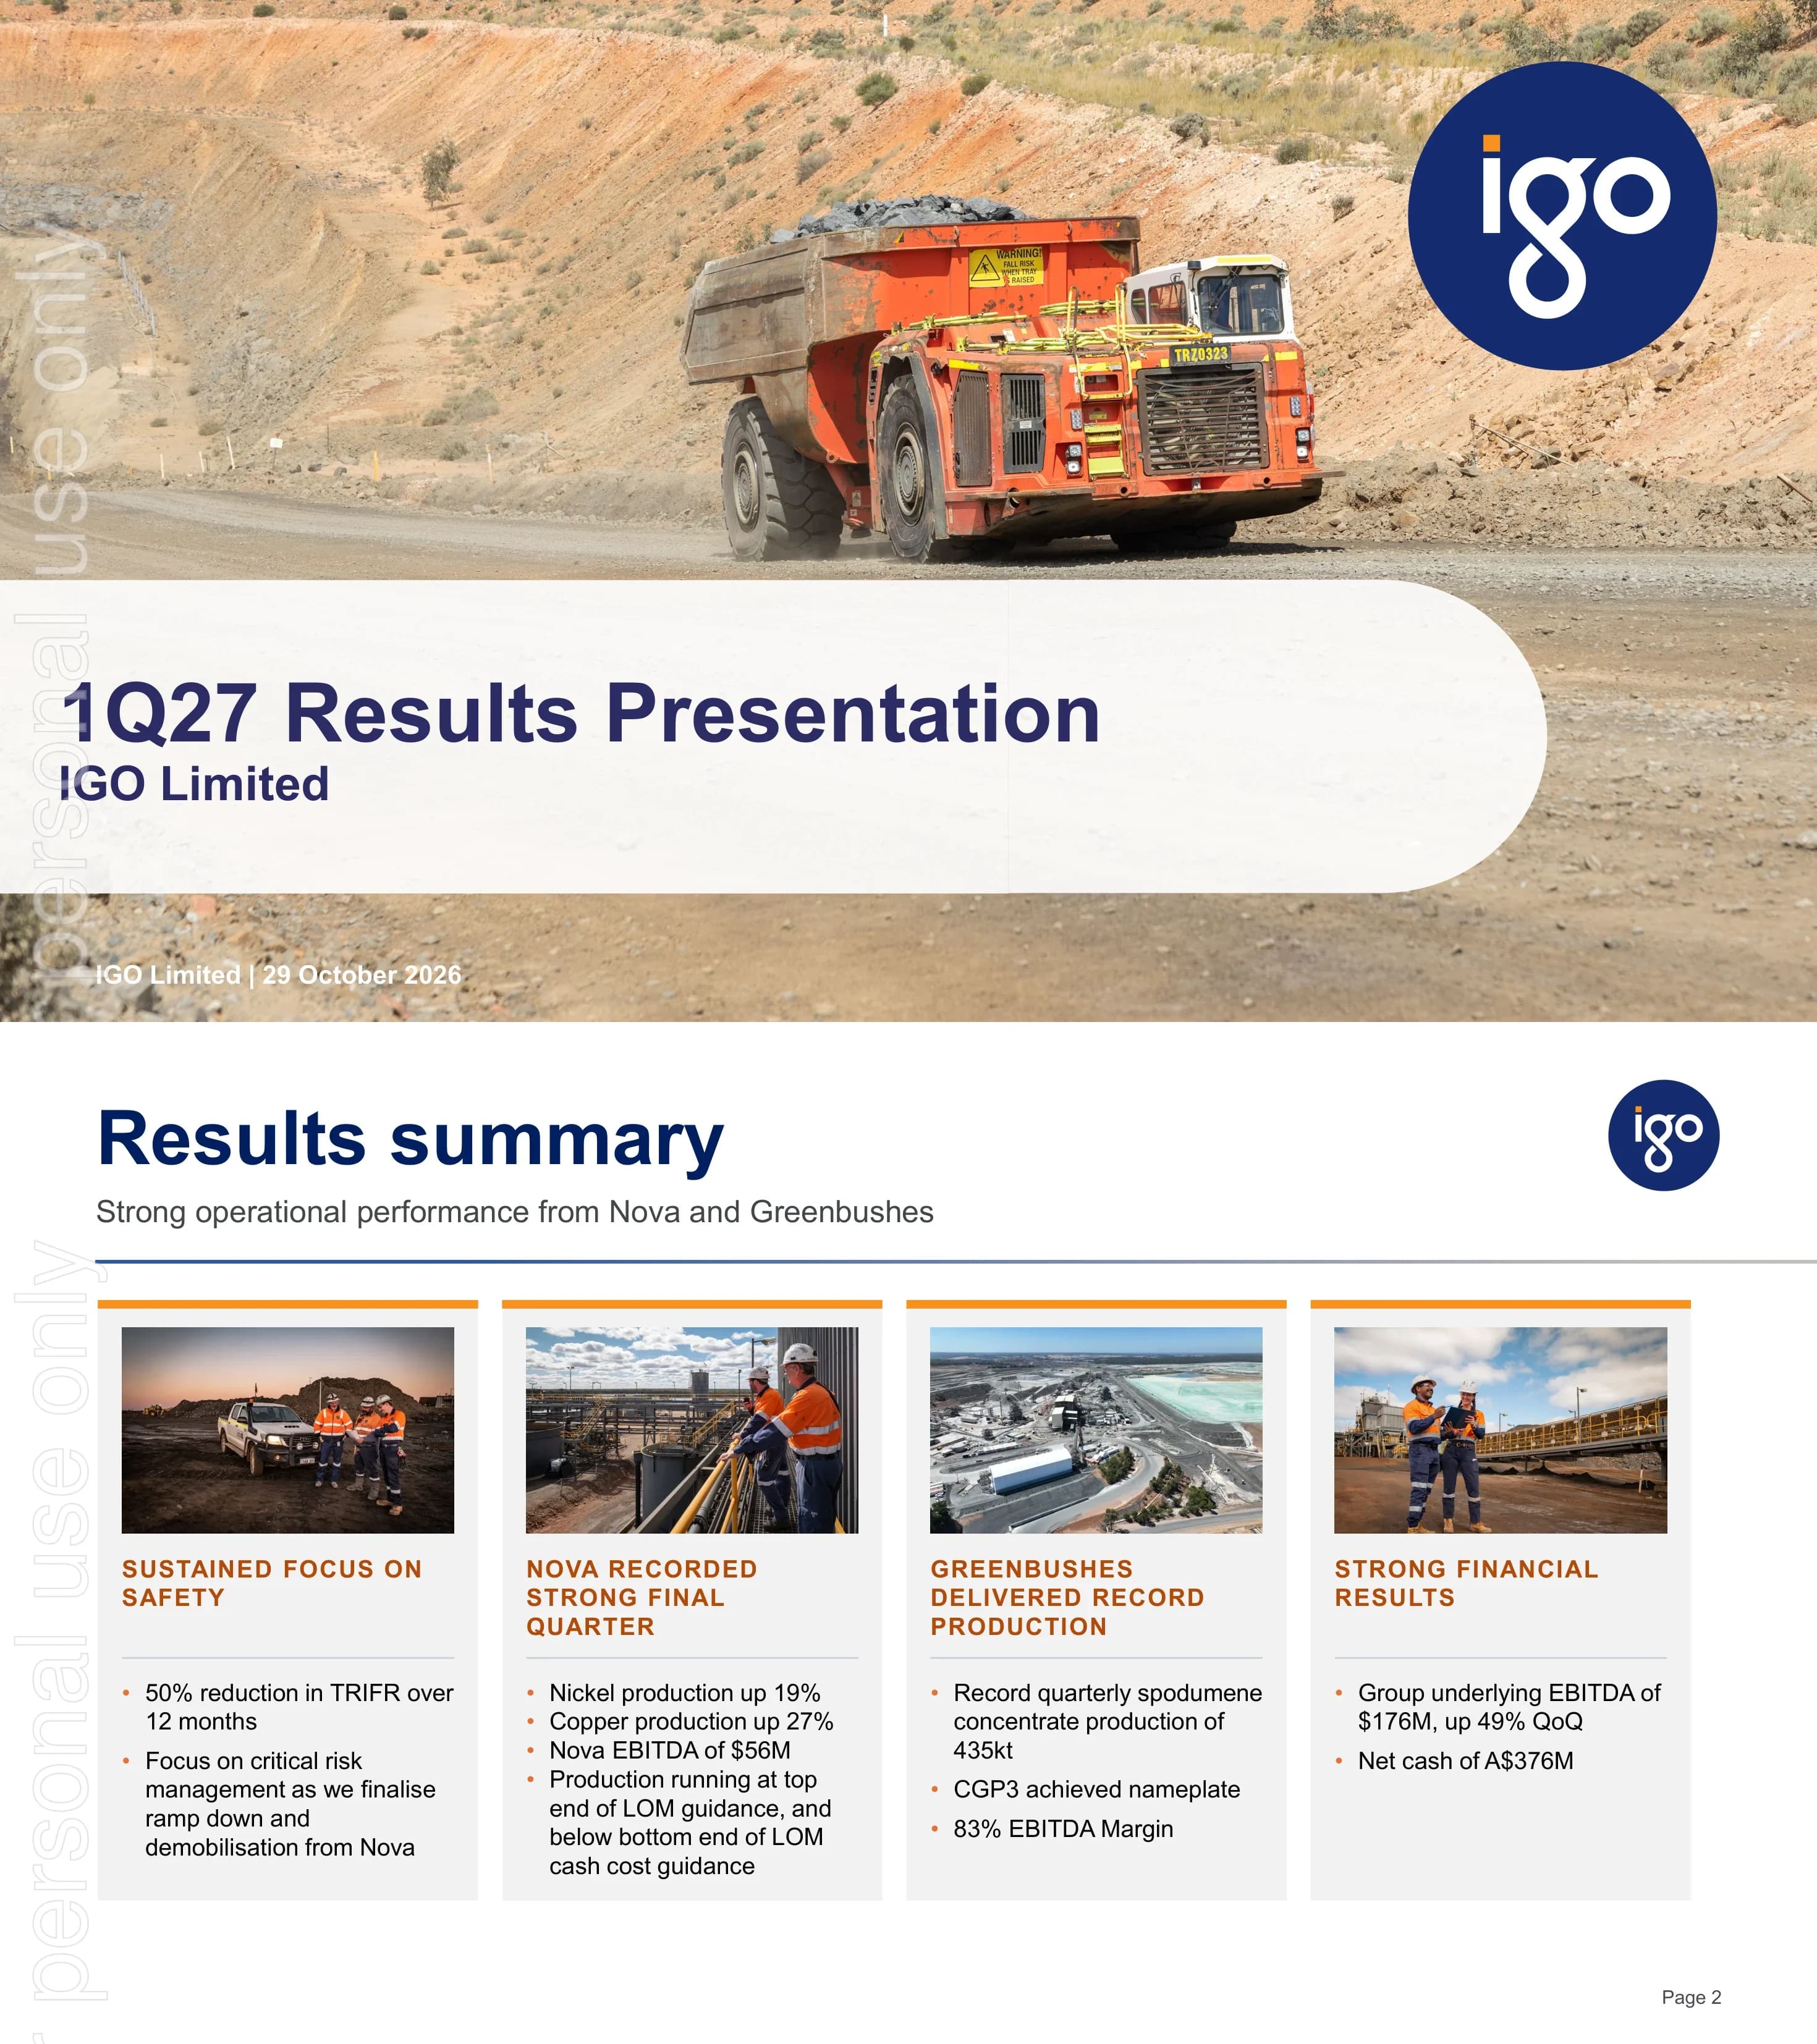
Cover slide titled '1Q27 Results Presentation, IGO Limited', dated 'IGO Limited | 29 October 2026', over a photograph of an orange underground haul truck (TRZ0323) loaded with ore on a dirt haul road.
Full-bleed landscape photograph with a white rounded pill-shaped band across the lower third carrying the navy title and subtitle; circular navy IGO logo in the top-right corner; date in white at bottom-left; faint vertical 'personal use only' watermark along the left edge (ASX lodgement stamp).
Strong operational performance from Nova and Greenbushes. Four themes: Safety (50% reduction in TRIFR over 12 months; focus on critical risk management as Nova ramps down and demobilises); Nova recorded strong final quarter (nickel production up 19%, copper production up 27%, Nova EBITDA of $56M, production at top end of LOM guidance and cash cost below the bottom end of LOM guidance); Greenbushes delivered record production (record quarterly spodumene concentrate production of 435kt, CGP3 achieved nameplate, 83% EBITDA margin); Strong financial results (Group underlying EBITDA of $176M, up 49% QoQ; net cash of A$376M).
Title and subtitle above a navy-to-grey gradient rule, then four equal light-grey cards each topped by an orange bar, a site photograph, an orange uppercase headline and orange-bulleted text.
Sustained focus on safety performance. YoY improvement: 50% lower Group 12-month TRIFR. September quarter result: 2 recordable injuries at Nova; TRIFR rose to 4.0 during the quarter. Focus: maintaining critical risk management while completing ramp-down and demobilisation from Nova. Line chart 'TRIFR Performance to 30 September 2026' – Nova Operation 12.5, 9.9, 7.1, 5.3, 5.5 and IGO Group 8.0, 6.5, 4.9, 3.7, 4.0 for Sep-25, Dec-25, Mar-26, Jun-26, Sep-26.
Left half: three stacked grey KPI cards with orange left border (large navy number plus description). Right half: two-series smoothed line chart with data labels and legend.
Outstanding final full quarter from Nova. Production 4,635t nickel (up 19% QoQ) and 2,144t copper (up 27% QoQ), reflecting stronger mining performance and higher mill runtime. Cash cost (payable) $2.00/lb, down 55% QoQ on higher production and by-product prices and lower costs. Underlying EBITDA $56M; free cash flow $67M. Table 1Q27 vs 4Q26: nickel production 4,635 vs 3,882t (+19%); nickel sales 4,576 vs 3,372t (+36%); copper production 2,144 vs 1,694t (+27%); copper sales 1,845 vs 2,645t (−30%); cash cost (payable) A$2.00 vs 4.49/lb Ni (−55%); underlying EBITDA A$56M vs 31M (+83%); realised nickel price A$22,961 vs 24,702/t (−7%); realised copper price A$22,494 vs 18,889/t (+19%). Footnotes define payable cash cost and note underlying EBITDA is non-IFRS.
Left column of three KPI cards (production, cash cost, EBITDA/free cash flow side by side); right column a five-column data table with navy header row and the 1Q27 column shaded light blue; colour-coded up/down triangles in the % change column; footnotes beneath.
Photo-only slide marking the end of Nova: a large group of workers in hi-vis orange and navy cheering in front of a haul truck at the mine portal, plus two smaller images – a haul truck climbing the open-cut ramp, and two workers posing in front of truck TRZ0323 at the portal.
Photo collage: one large image filling the left two-thirds and two stacked images on the right; logo top-right; page number bottom-right; no text.
Second photo-only slide showing Nova crews clapping and smiling at the portal under a yellow gantry structure – four candid crowd shots celebrating the operation's final period.
2×2 grid of equal photographs centred on a white page, logo top-right, no text.
A decade of contribution to IGO, with sustained performance to the end. Four cards: high-quality, low-cost operation (maintained strong production and cost performance despite the nickel price downturn in 2023/24); strong performance to the end (on track to beat life-of-mine production and cost guidance); contribution to people and partners (created over 480 direct jobs, developed and operated in partnership with the Ngadju Traditional Owners); Nova to continue under new ownership (secured divestment to Global Lithium Resources post closure, enabling future lithium production). Life of mine statistics: 14Mt ore mined, 221kt nickel produced, 99kt copper produced, $5.4B cumulative revenue, $2.9B free cash flow, $242M royalties paid.
Four icon cards in a row (orange line icons: shield, target, handshake, recycle bin) above a full-width grey band with six large navy statistics and grey labels.
Record production and lower costs as CGP3 reaches sustained nameplate (TLEA and IGO logos shown). 1Q27 production 435kt, up 12% QoQ on higher grade and improved recovery; cash costs $418/t, down 7% QoQ, EBITDA margin increased to 83%; CGP3 ramp-up – nameplate production achieved in September; dividend A$680M quarterly dividend to shareholders (100%) reflecting strong cash generation. Table (100% basis) 1Q27 vs 4Q26: spodumene production 435 vs 387kt (+12%); spodumene sales 376 vs 391kt (−4%); mined grade 1.77 vs 1.68% Li2O (+5%); cash cost (production) A$418 vs 448/t (−7%); average realised price US$2,130 vs 2,286/t (−7%); EBITDA margin 83% vs 80%; capex A$51M vs 42M. Footnotes define cash cost (production) and capex.
Same template as the Nova slide: four orange-tabbed KPI cards on the left, navy-header comparison table with shaded 1Q27 column on the right, footnotes below; dual logo lock-up (TLEA wordmark + IGO badge) top-right.
Production performance improving; conversion costs remain elevated. 1Q27 production: major shutdown complete, production has resumed. Conversion costs 17% lower at A$33,677/t due to shutdown. EBITDA: A$65M loss, driven by NRV adjustment and lower hydroxide prices. Table (100% basis) 1Q27 vs 4Q26: lithium hydroxide production 918 vs 897t (+2%); lithium hydroxide sales 926 vs 864t (+7%); conversion cost (production) A$33,677 vs 40,670/t (−17%); sales revenue A$23.1M vs 23.9M (−3%); EBITDA A$(65.4)M vs (88.4)M (+26%); capex A$14.2M vs 26.7M. Footnotes define conversion cost (excluding spodumene purchases and Lithium Industry Support Program funding) and capex.
Three KPI text cards on the left (text statements rather than big numbers), navy-header table on the right with shaded current-quarter column, footnotes beneath; TLEA and IGO logos top-right.
Strong earnings performance; balance sheet remains strong with A$376M cash. Underlying EBITDA $176M, up 49%, supported by Nova and positive investment revaluations; revenue $158M, up 12% on higher Nova nickel sales and copper price; balance sheet $376M, strong cash balance to fund growth. Table 1Q27 vs 4Q26 (A$M): sales revenue 158 vs 141 (+12%); Nova EBITDA 56 vs 31 (+83%); share of net profit/(loss) of TLEA 114 vs 121 (−5%); EBITDA 176 vs 118 (+50%); underlying EBITDA 176 vs 118 (+49%); underlying free cash flow 40 vs 70 (−43%); cash 376 vs 387 (−3%). Footnotes: results are unaudited and underlying measures are non-IFRS; TLEA is the JV between IGO (49%) and Tianqi Lithium Corporation (51%); underlying EBITDA includes a $31.9M mark-to-market gain on listed investments in 1Q27 (4Q26: $9.6M loss); free cash flow before exclusions was a net inflow of $39.8M (1Q27) and $64.0M (4Q26).
Three big-number KPI cards on the left, seven-row navy-header financial table on the right, and a full-width block of four numbered footnotes at the bottom.
Optimise our existing portfolio and position for growth. 1) Unlock value from our lithium business – support JV partners to deliver full value from Greenbushes; agree a pathway for Kwinana with Tianqi Lithium Corporation. 2) Maximise value from non-core assets – complete the divestment of Nova to Global Lithium Resources; assess value realisation opportunities from Cosmos; continue to rationalise non-core exploration assets. 3) Advance growth opportunities – build a pipeline of advanced copper and lithium exploration projects; progress technical and commercial development of BioHeap copper leach technology; consider selective copper and lithium M&A with discipline.
Three numbered columns, each headed by a navy circle with a white numeral and an orange uppercase heading, over a tall grey panel with an orange left border and bulleted text.
Strong performance from Nova and Greenbushes; IGO well positioned for growth. Safety: Group TRIFR of 4.0, down 50% year on year; quarterly increase reinforces focus on critical risks. Nova: nickel production rose 19% in the final full quarter; cash costs fell 55% to $2.00/lb. Greenbushes: record 435kt production, up 12% quarter on quarter; CGP3 reached nameplate in September. Financial: underlying EBITDA of $176M, up 49%; net cash of $376M and underlying free cash flow of $40M. Kwinana: 918t production following completion of major shutdown; conversion costs fell 17% to $33,677/t. Growth: disciplined growth focused on copper and lithium; BioHeap testing continues towards a trial heap.
2×3 grid of horizontal cards, each with a thumbnail photo on the left, an orange uppercase heading and two bullets; orange left border on each card.
Contact slide: Richard Glass, Head of Strategy and Investor Relations, T: +61 8 9238 8300, E: investor.relations@igo.com.au. 'Authorised for release to the ASX by Managing Director and CEO, Ivan Vella.'
Strip of four equal portrait photographs of IGO employees (lab, control room, drill site, underground) across the middle, with the contact block and an orange vertical rule below.
Legal disclaimer: prepared by IGO Limited (ABN 46 092 786 304); not an offer of securities; forward-looking statements and risk factors; quarterly financial results are unaudited and all currency amounts are in Australian dollars unless noted; definitions of net cash, nickel cash costs, lithium cash costs (COGS and production), underlying EBITDA and free cash flow; IGO holds a 49% interest in Tianqi Lithium Energy Australia Pty Ltd (TLEA) and recognises its share of TLEA net profit after tax.
Dense three-column bulleted small-text layout under a large navy heading.
Brand back-cover: IGO's purpose statement about people power, clean energy and battery storage technology enabling renewable energy, ending with 'We are the IGO Difference.'
Soft blue-to-lavender gradient background; large two-line navy headline on the left, two columns of grey body copy on the right; logo top-right.
이 슬라이드 및 기본 프레젠테이션 콘텐츠에 대한 일반적인 질문.
It is IGO Limited's 15-slide results presentation for the first quarter of its 2027 financial year (July–September 2026), lodged with the ASX and dated 29 October 2026. It covers safety, the Nova nickel-copper operation, the Greenbushes lithium mine, the Kwinana lithium hydroxide refinery, Group financial results and strategic priorities.
IGO's financial year runs from July to June, so FY27 covers July 2026 to June 2027 and the first quarter (1Q27) is July–September 2026. The comparison quarter shown in the tables, 4Q26, is April–June 2026.
Group underlying EBITDA was A$176M (up 49% QoQ), sales revenue A$158M, cash A$376M and underlying free cash flow A$40M. Greenbushes produced a record 435kt of spodumene concentrate, and Nova produced 4,635t of nickel at a payable cash cost of $2.00/lb.
No. The Greenbushes and Kwinana tables are on a 100% basis. IGO holds 49% of Tianqi Lithium Energy Australia (TLEA), the joint venture with Tianqi Lithium Corporation (51%), and recognises its share of TLEA's net profit (A$114M in 1Q27) in its own results.
All amounts are in Australian dollars (A$) unless otherwise noted, per the disclaimer. The exception is the Greenbushes average realised spodumene price, quoted in US$/t (US$2,130/t in 1Q27).
Yes. The page offers the original PDF as lodged with the ASX and an editable PPTX version converted from it, so you can reuse the navy-and-orange KPI-card plus data-table layout for your own quarterly results deck. The PPTX is a machine conversion, so check fonts and alignment after opening.
1Q27 was Nova's final full quarter before closure. IGO used two photo slides and a 'Nova's Legacy' slide to recognise the workforce and summarise life-of-mine results: 14Mt ore mined, 221kt nickel, 99kt copper, $5.4B cumulative revenue and $2.9B free cash flow. Nova is being divested to Global Lithium Resources.
It is a watermark stamped by the ASX announcements platform on lodged documents. It is not part of IGO's own design and can be ignored when using the layout as a template.
Company investor relations site with quarterly reports and ASX announcements

Create Your Own Slides
Turn your ideas into professional presentations in seconds with 2slides AI.
전문 디자인을 참조하고, 스타일을 선택하며, 완벽한 텍스트 렌더링으로 슬라이드를 생성하세요. Nano Banana로 구동—지금 프레젠테이션 만들기를 시작하세요.


