
수록 모음: 투자자 발표자료 사례
Chroma ATE Q3 2026 Earnings Presentation: a 10-slide earnings web conference deck from Chroma ATE Inc. (TWSE: 2360), the Taiwanese test and measurement and automated test equipment maker, presented by CFO Lawrence Wu on 29 October 2026. The English version was filed on Taiwan's Market Observation Post System (MOPS) for the investor conference (法說會). Q3 2026 consolidated net sales reached NT$ (New Taiwan dollars) 17,926 million, up 180% year over year and 33% quarter over quarter, with gross margin of 58%, operating margin of 40% and diluted EPS of NT$13.34.
이 프레젠테이션의 표지를 스타일 참고 자료로 사용해 내 콘텐츠로 슬라이드를 만듭니다. 아래에서 원하는 페이지를 골라 그 레이아웃을 참고로 쓸 수도 있습니다.
빠른 탐색
태그
슬라이드 공유
Chroma ATE Q3 2026 Earnings Presentation: a 10-slide earnings web conference deck from Chroma ATE Inc. (TWSE: 2360), the Taiwanese test and measurement and automated test equipment maker, presented by CFO Lawrence Wu on 29 October 2026. The English version was filed on Taiwan's Market Observation Post System (MOPS) for the investor conference (法說會). Q3 2026 consolidated net sales reached NT$ (New Taiwan dollars) 17,926 million, up 180% year over year and 33% quarter over quarter, with gross margin of 58%, operating margin of 40% and diluted EPS of NT$13.34.
레이아웃, 주요 콘텐츠 및 시각적 요소를 포함한 각 슬라이드 페이지의 상세 보기.
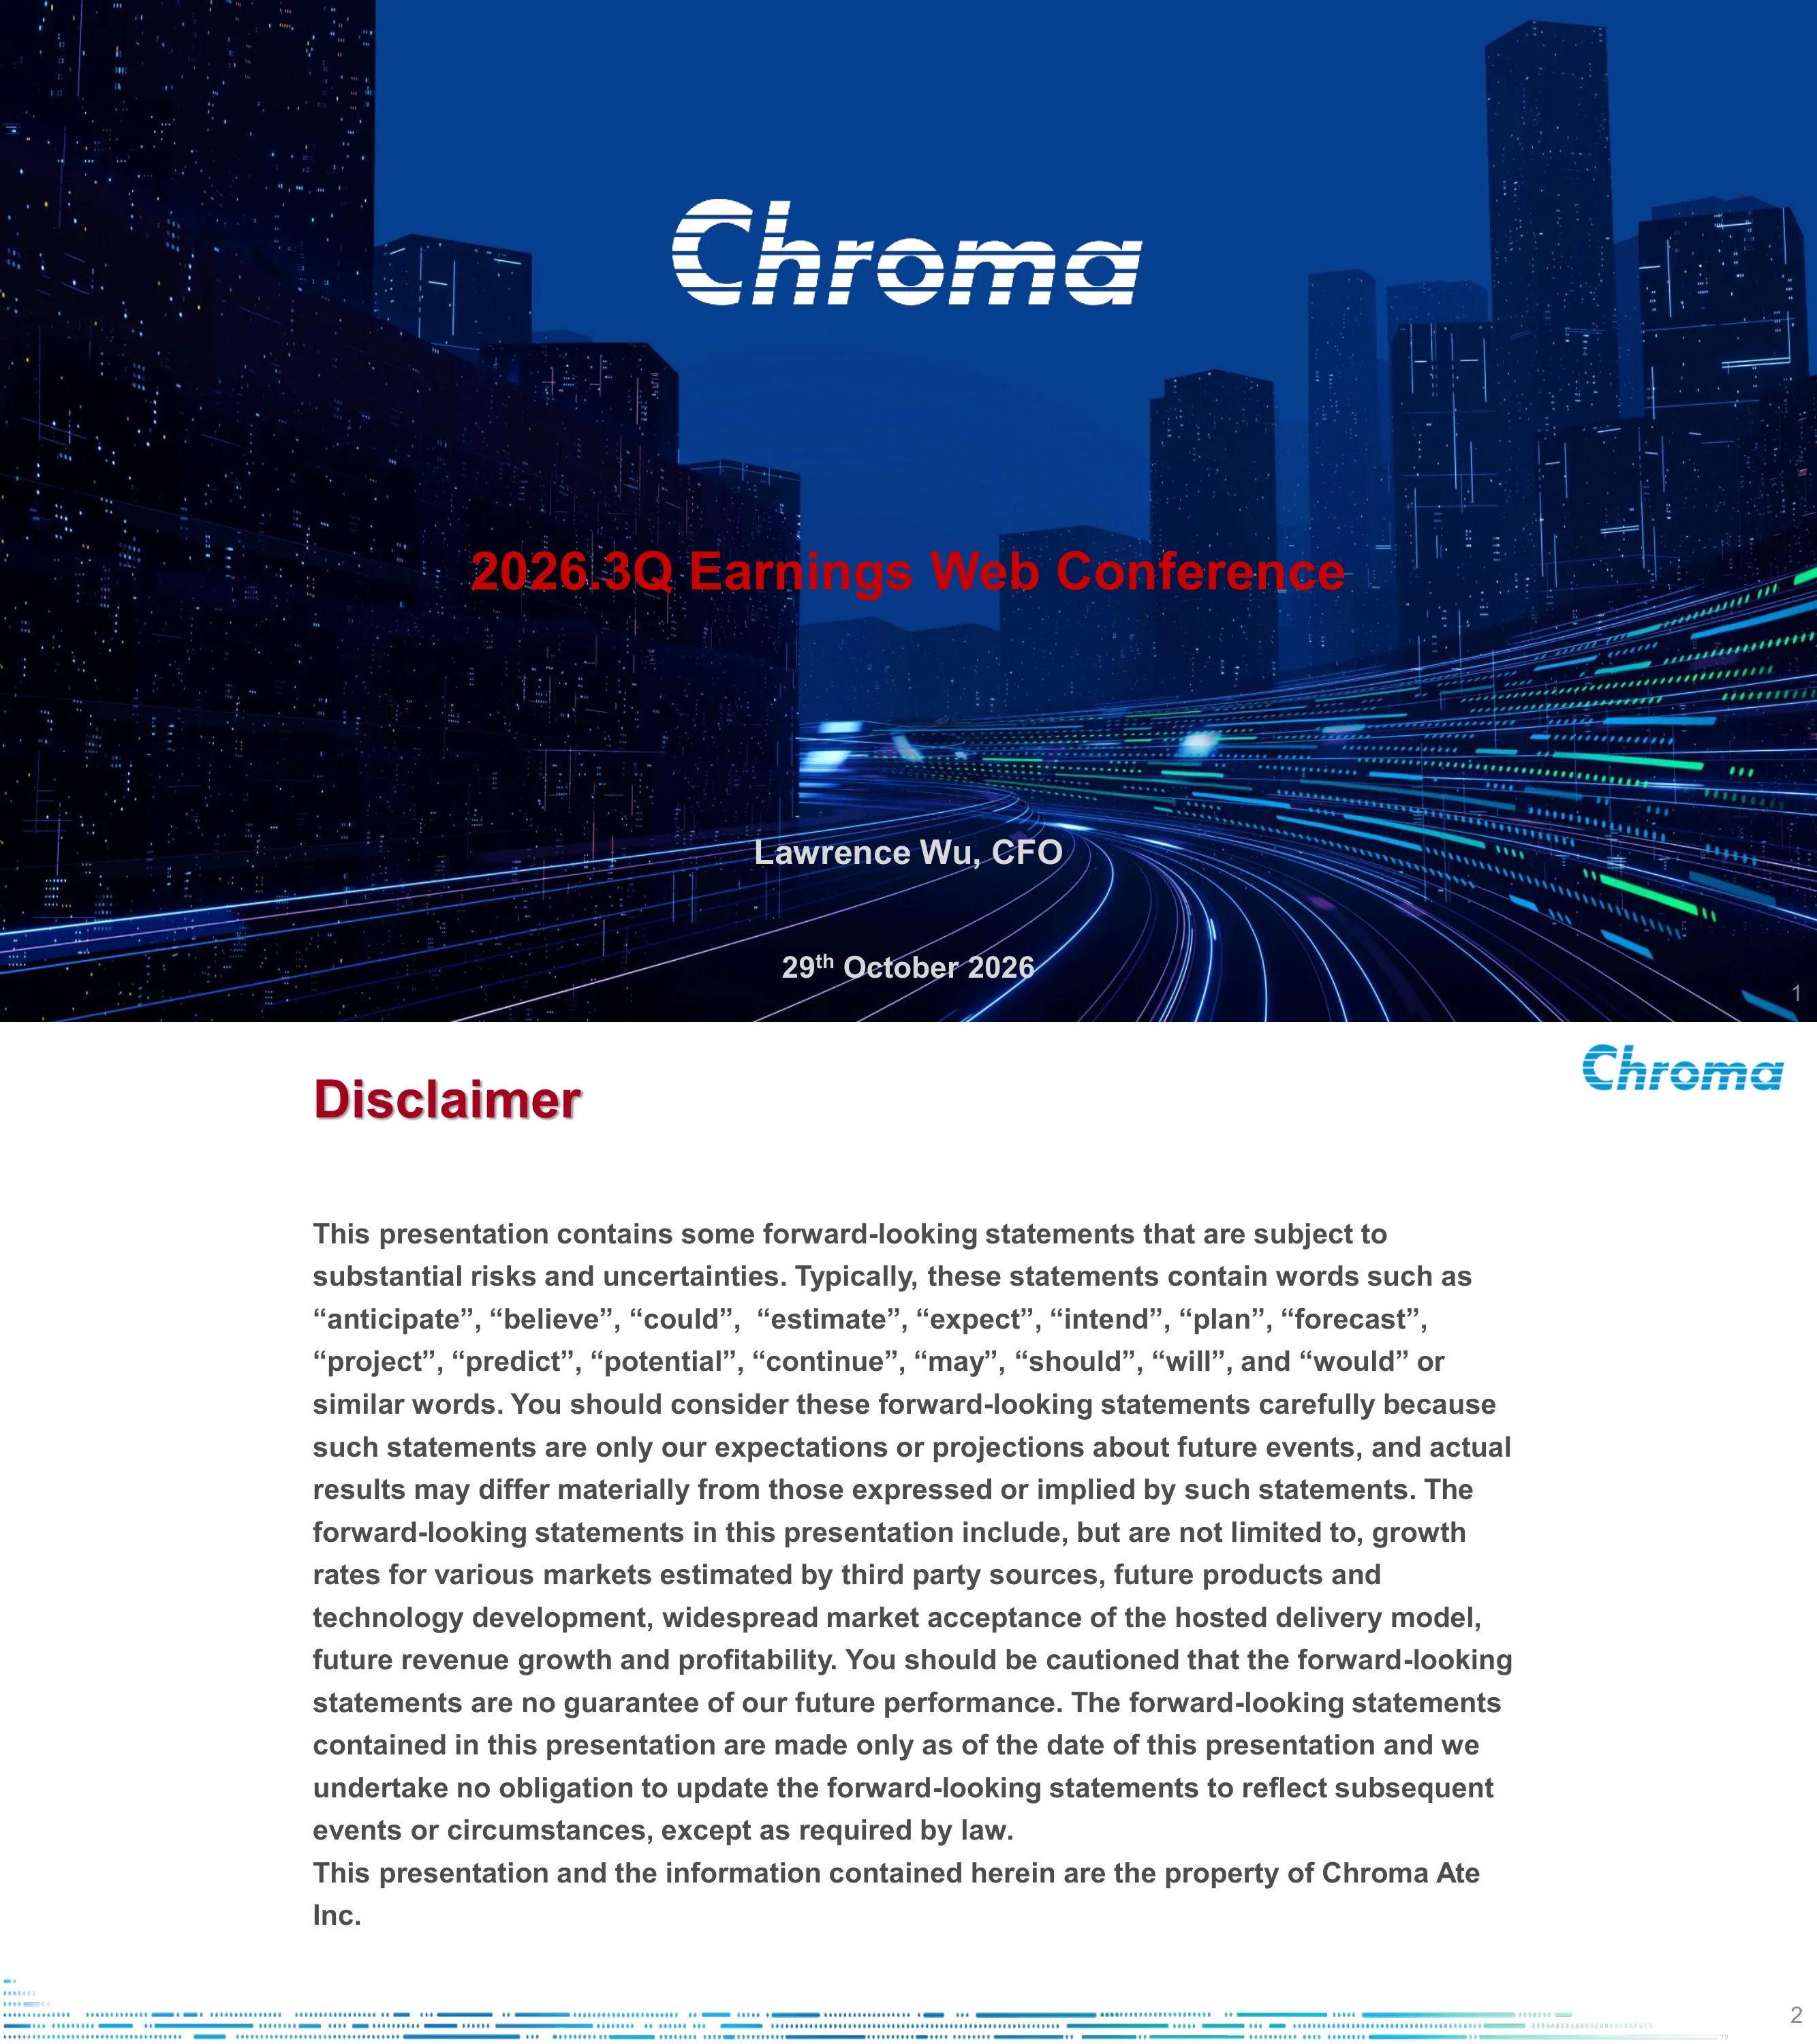
Cover slide with the Chroma logo, the title '2026.3Q Earnings Web Conference', presenter Lawrence Wu, CFO, and the date 29th October 2026.
Full-bleed night cityscape photo with light-trail streaks; centered white logo, red title in the middle band, presenter and date stacked at the bottom.
Forward-looking statements disclaimer: statements using words such as anticipate, believe, estimate, expect, forecast and similar are projections subject to risks and uncertainties, covering third-party market growth estimates, future products and technology, market acceptance and future revenue and profitability; no obligation to update except as required by law. The presentation is the property of Chroma ATE Inc.
Single block of bold grey body text under a dark-red heading, logo top right, dotted blue-green band along the footer.
Three agenda items: Financial Review, Operation Highlights and Q&A.
Light-blue gradient panel with a double-ruled navy box containing three large bulleted items.
Section divider introducing the Financial Review part of the deck.
Split layout: red section title on white at left, blue gradient panel at right with the Chroma logo and a 3D 'Test and Automation turnkey Solution provider' word graphic; green vertical and grey horizontal accent lines cross.
Q3 2026 net sales NT$17,926 million (+33% QoQ from NT$13,529 million, +180% YoY from NT$6,410 million), of which testing equipment business NT$17,589 million (98%), MAS NT$255 million and others NT$82 million. Gross profit NT$10,308 million (58% margin vs 61% in Q2 and 60% a year earlier). G&A NT$2,175 million and R&D NT$966 million; operating income NT$7,167 million (40% margin, +288% YoY). Non-operating income only NT$186 million vs NT$1,272 million in Q2 and NT$3,626 million in Q3 2025, as the earlier quarters included gains from disposal of a residential apartment held for sale (NT$444 million in 2026.2Q, NT$3,185 million in 2025.3Q). Pre-tax income NT$7,353 million, tax NT$1,573 million, net income NT$5,780 million (+11% QoQ, +13% YoY), NT$5,647 million attributable to the parent. EPS NT$13.34 basic and diluted vs NT$12.10 diluted in Q2 and NT$11.92 a year earlier.
Wide financial table with three period column groups (2026.3Q highlighted by a red frame, 2026.2Q, 2025.3Q) each with amount and % of sales, plus QoQ % and YoY % columns; key rows shaded light blue, segment sales rows shaded pink; footnote with red bullet marker.
Nine-month 2026 net sales NT$43,315 million vs NT$19,730 million (+120% YoY); testing equipment business NT$42,243 million (98%), MAS NT$860 million, others NT$212 million. Gross profit NT$25,917 million (60% margin vs 62%). G&A NT$6,000 million, R&D NT$2,711 million; operating income NT$17,206 million (40% margin, +177%). Non-operating income NT$1,755 million vs NT$4,300 million (-59%). Pre-tax income NT$18,961 million, tax NT$4,003 million, net income NT$14,958 million (+61%), NT$14,634 million to the parent. EPS NT$34.61 basic and NT$34.51 diluted vs NT$21.67 and NT$21.52.
Same table design as the quarterly slide but with two period groups (2026.1~3Q framed in red, 2025.1~3Q) and a YoY % column.
At September 2026 vs December 2025 (NT$ million): cash and short-term investments 8,011 vs 8,314 (-4%); inventory 13,805 vs 7,919 (+74%); short-term debt 3,135 vs 13; long-term debt 2,930 vs 3,304 (-11%); shareholders' equity 39,419 vs 32,563 (+21%); total assets 66,528 vs 47,150 (+41%). Inventory turnover 169 days vs 224, AR turnover 93 days vs 87, AP turnover 95 days vs 113; net cash position at both dates. Annualized ROE 54% vs 29% and ROA 34% vs 20%. Cash position for 1~3Q: EBITDA 19,780 vs 11,155 (+77%), cash flow from operations 6,206 vs 2,864 (+117%), free cash flow 6,810 vs 5,055 (+35%), with free cash flow defined as operating cash flow plus net cash used by investing activities.
Two stacked tables: balance sheet and ratio rows with period columns and change column, then a smaller cash-position table; ROE/ROA, total assets and free cash flow rows shaded; two footnotes with red dot markers.
Section divider introducing the Operation Highlight part of the deck.
Same split divider design as page 4: two-line red title at left, blue gradient panel with logo and 3D tagline word art at right.
Parent-company sales in Q3 2026 (NT$ million): Test Instruments & Automatic Testing System (ATS) 7,434 (52%, +21% QoQ, +147% YoY); Semiconductor / Photonics Test Solutions 6,056 (42%, +38% QoQ, +189% YoY); Turnkey Solutions 194 (1%, +266% QoQ, +253% YoY); Service & Others 651 (5%). Total parent sales 14,335 (+29% QoQ, +161% YoY), plus 3,254 from overseas operations and related subsidiaries, giving consolidated testing equipment business of 17,589 (+186% YoY). With MAS 255 and other subsidiaries 82, consolidated sales are 17,926 (+180% YoY). For 1~3Q 2026: ATS 18,992 (+140%), semiconductor/photonics 13,852 (+101%), turnkey 300 (-9%), service 1,550 (+66%), parent total 34,694 (+116%), consolidated 43,315 (+120%). Full-year 2025 reference column: consolidated sales 28,311, with ATS 10,545 and semiconductor/photonics 9,759.
Large segment table with Q3, QoQ, YoY and 1~3Q columns inside a dashed red frame, a faded 2025 full-year column at right, grey-boxed parent-company block, a curved blue arrow linking parent plus overseas sales to the consolidated testing business line, and a yellow consolidated-sales total row.
Closing slide with the Chroma logo, the tagline 'Advancing Excellence' and 'Thank You'; small copyright line reads Copyright © 2023 Chroma ATE Inc.
Solid navy background with dotted grids at left and flowing blue-green line streaks at right; logo and tagline centered left, thank-you text below.
이 슬라이드 및 기본 프레젠테이션 콘텐츠에 대한 일반적인 질문.
Consolidated net sales were NT$ (New Taiwan dollars) 17,926 million, up 180% year over year and 33% quarter over quarter. Gross margin was 58%, operating income NT$7,167 million (40% margin), net income NT$5,780 million and diluted EPS NT$13.34.
It is the English version of the presentation Chroma ATE Inc. (TWSE: 2360) filed on Taiwan's Market Observation Post System (MOPS) for its Q3 2026 investor conference (法說會), held as a web conference on 29 October 2026. MOPS also carries a Chinese-language version of the same deck.
Both main product lines more than doubled. In the parent company, Test Instruments & Automatic Testing System sales were NT$7,434 million (+147% YoY) and Semiconductor / Photonics Test Solutions NT$6,056 million (+189% YoY). Sales from overseas operations and related subsidiaries rose 391% to NT$3,254 million.
Operating income rose 288% YoY, but Q3 2025 included a NT$3,185 million gain from disposing of a residential apartment held for sale, booked in non-operating income. Without a similar gain this quarter, non-operating income fell to NT$186 million, so net income rose only 13% YoY.
For 1~3Q 2026 net sales were NT$43,315 million (+120%), operating income NT$17,206 million (+177%), net income NT$14,958 million (+61%) and diluted EPS NT$34.51 versus NT$21.52 a year earlier.
At September 2026 the company held a net cash position, total assets of NT$66,528 million and equity of NT$39,419 million. Inventory rose 74% to NT$13,805 million, while annualized ROE was 54% and ROA 34%. Nine-month free cash flow was NT$6,810 million.
Yes. The page offers the original PDF and an editable PPTX converted from it, so you can reuse the income statement, balance sheet and segment breakdown table layouts in your own earnings deck.
Original English PDF filed for the 29 October 2026 investor conference

Create Your Own Slides
Turn your ideas into professional presentations in seconds with 2slides AI.
전문 디자인을 참조하고, 스타일을 선택하며, 완벽한 텍스트 렌더링으로 슬라이드를 생성하세요. Nano Banana로 구동—지금 프레젠테이션 만들기를 시작하세요.


