
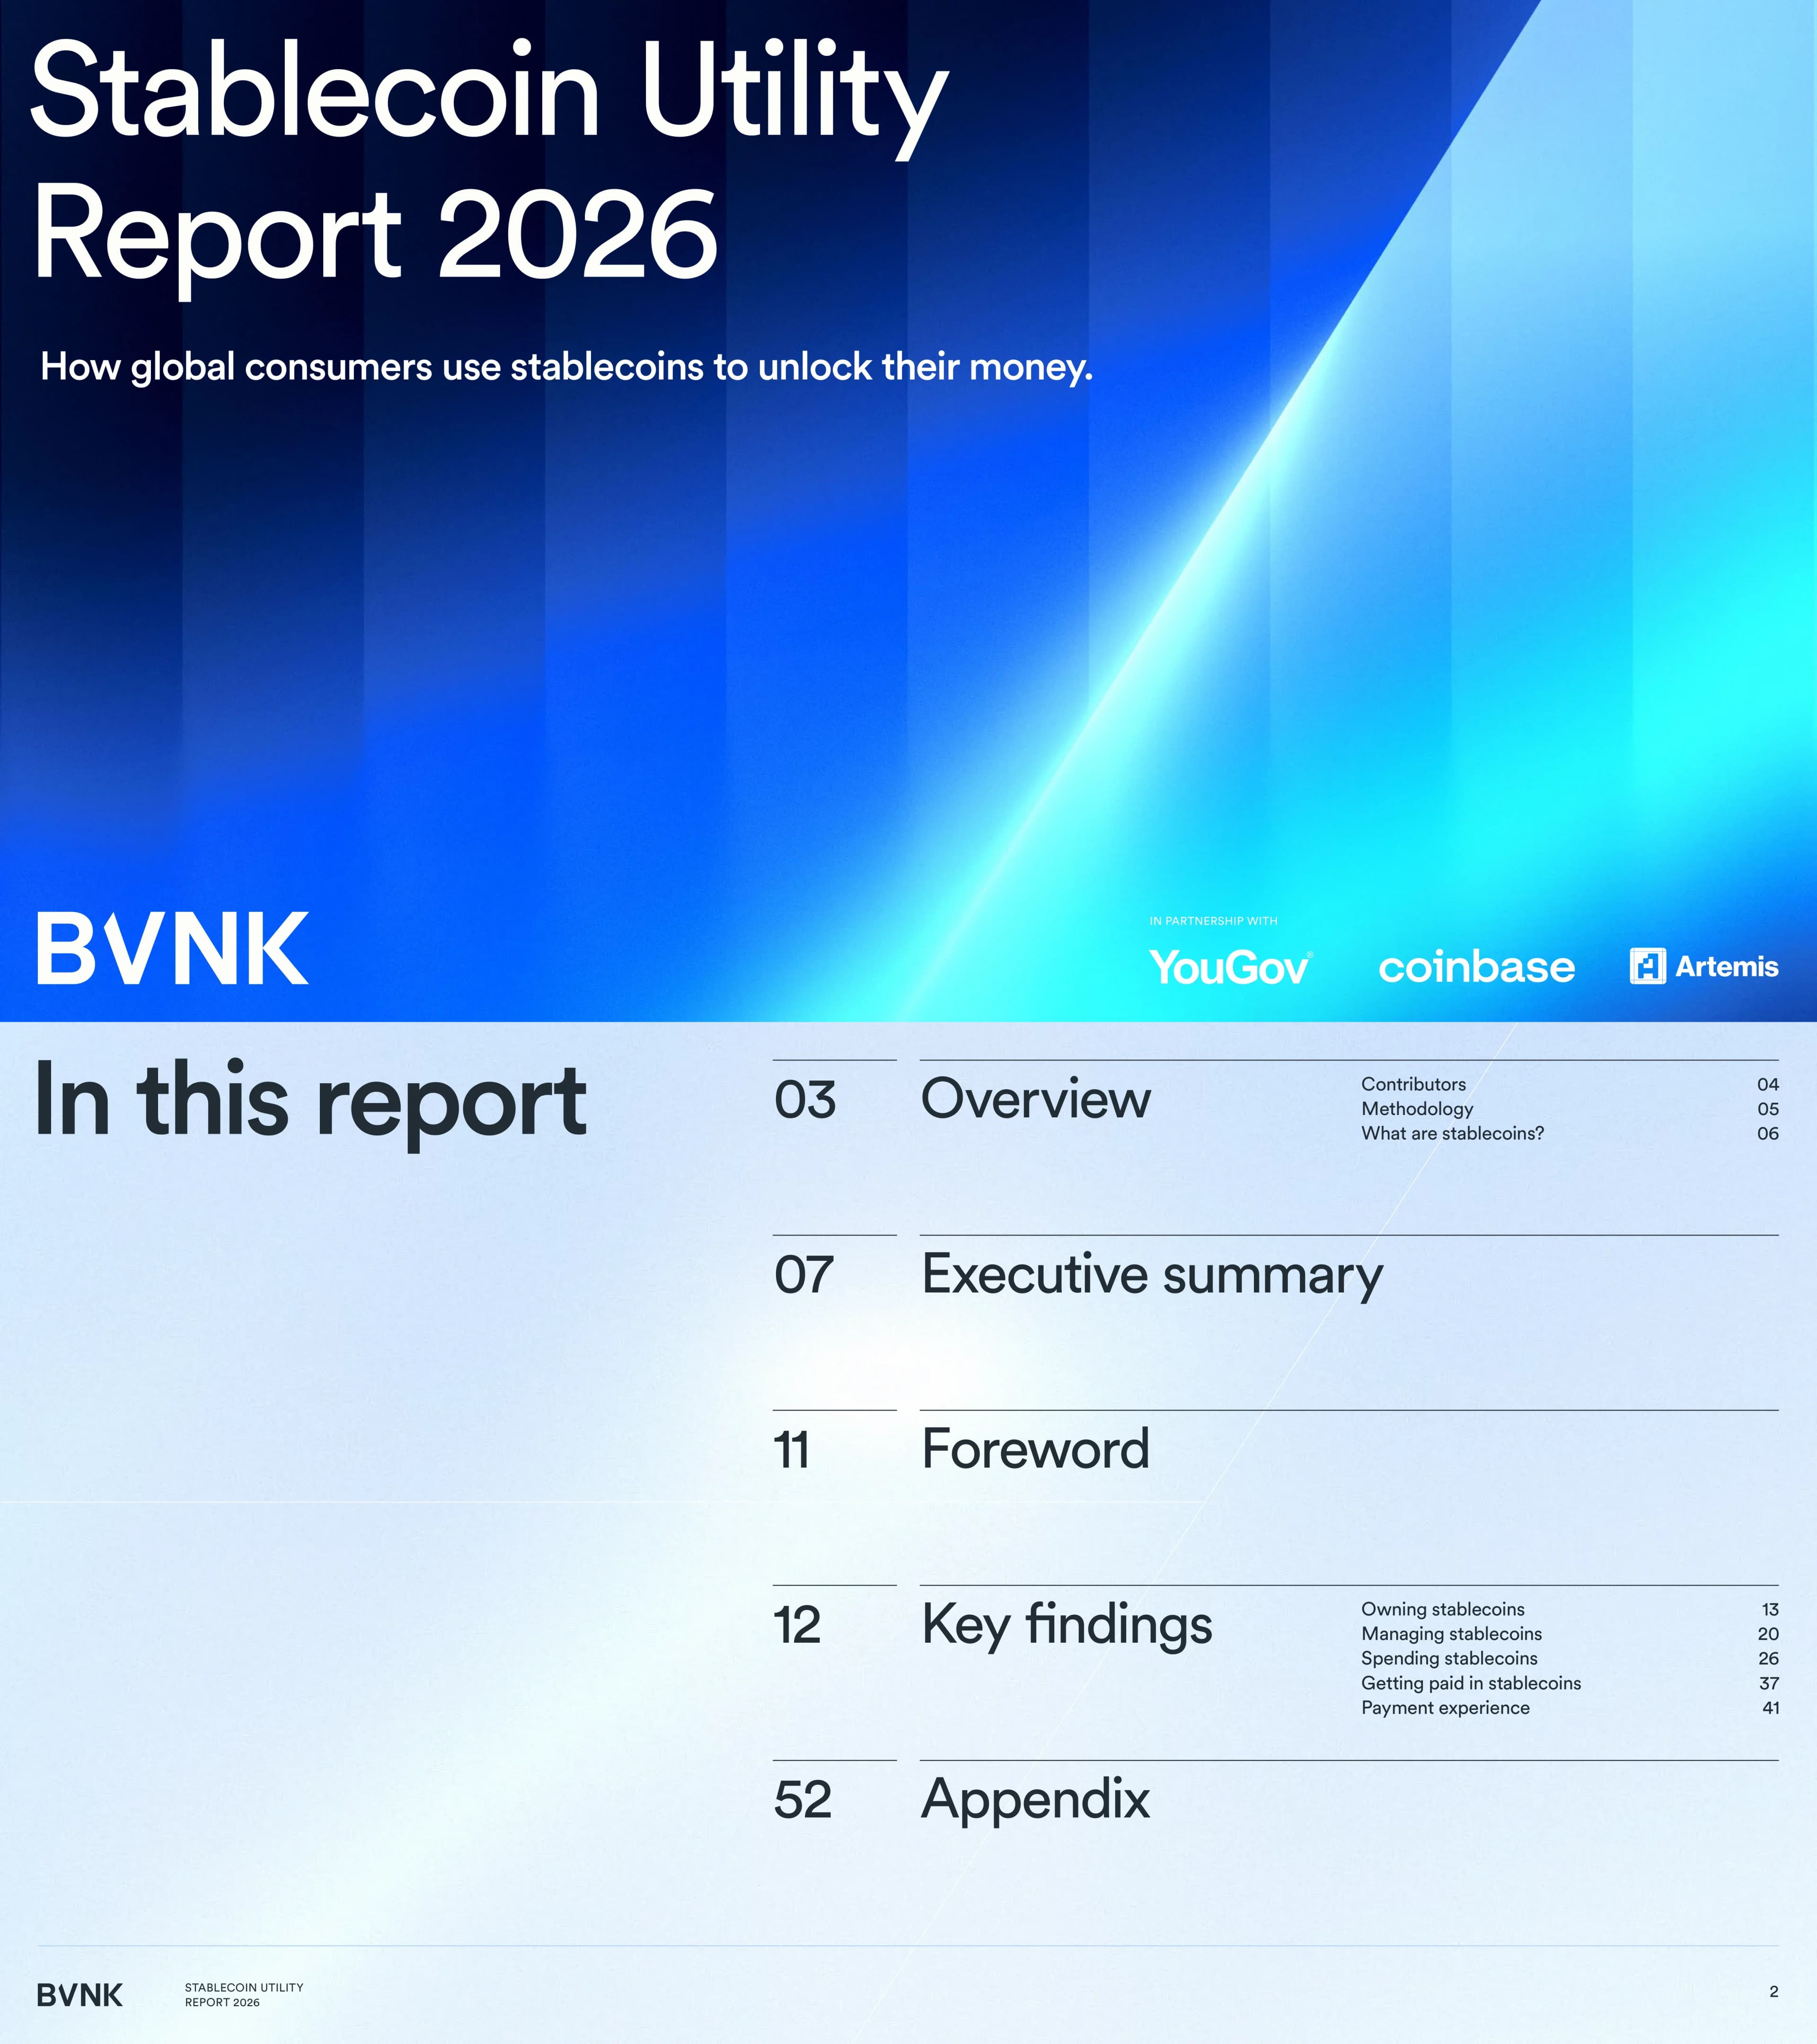
BVNK Stablecoin Utility Report 2026 - Global Consumer Survey on Stablecoin Usage
빠른 탐색
태그
슬라이드 공유
BVNK Stablecoin Utility Report 2026 - Global Consumer Survey on Stablecoin Usage
레이아웃, 주요 콘텐츠 및 시각적 요소를 포함한 각 슬라이드 페이지의 상세 보기.
Title slide with BVNK branding, subtitle 'How global consumers use stablecoins to unlock their money', partner logos: YouGov, Coinbase, Artemis
Full-bleed dark blue gradient background with bold white typography, partner logos at bottom
Report structure: Overview (p3), Executive Summary (p7), Foreword (p11), Key Findings (p12) with sub-sections, Appendix (p52)
Light background with left-aligned heading and right-aligned numbered sections
Section divider for the Overview section
Dark blue gradient background with large white 'Overview' text
Four contributing organizations: BVNK, YouGov, Coinbase, Artemis with descriptions and key personnel photos
Four-column layout with organization logos, descriptions, and contributor headshots
YouGov surveyed 4,658 adults aged 18+ across 15 countries grouped into 7 regions. Fieldwork September-October 2025.
Left text block with methodology details, right side has world map showing regional coverage
Stablecoins defined as digital currency pegged to fiat. Market grown to over $300 billion. Examples: USDC, USDT, PYUSD.
Left headline, right explanatory text, bottom hero stat '$300 billion' in oversized blue typography
Section divider for Executive Summary
Dark blue gradient with large white text
56% intend to acquire more in 12 months, 54% held in last 12 months, 13% non-holders intend to acquire. 35% of freelancer earnings in stablecoins.
Left stat cards (56%, 54%, 13%), right narrative text with gauge chart showing 35%
77% would open stablecoin wallet if bank offered one. Exchanges dominate but trust in traditional finance runs deep.
Left text with headline, right dot matrix visualization showing 77%, large 77% stat at bottom
28% convert/spend within days, 23% within 1-3 weeks. 42% want to spend on major purchases vs 28% currently do. Spending gap highlighted.
Top stat cards, right narrative text, bottom blue highlight boxes showing spending gap (42% vs 28%)
Foreword from BVNK Co-Founder discussing disconnect between macro stablecoin numbers and everyday usage, survey methodology and key findings preview
Left side with large quote text and headshot, right side with full-column editorial text
Section divider with sub-section list: Owning (13), Managing (20), Spending (26), Getting paid (37), Payment experience (41)
Dark blue gradient with large 'Key findings' text and right-aligned sub-section index
Sub-section divider for 'Owning stablecoins'
Light cyan gradient with large dark text
Higher ownership in low/middle-income economies (60%) vs high-income (45%). Africa leads at 79%. Average holdings under $200 globally, ~$1,000 in high-income.
Left photo of woman with phone, right side with bold headline and body text
49% increased holdings (all markets), 54% in low/middle-income, 40% in high-income. Only 7% decreased. NET any change: 55%.
Left headline text, right stacked horizontal bar charts segmented by market type
56% plan to acquire more. Africa highest ownership (79%) and forward intent (76%). +73% increase in Africa. Non-owner intent: 13% overall, 16% in low/middle-income.
Left text narrative, right side with large +73% hero stat and grouped bar chart by economy type
34% overall mean of savings in stablecoins. 36% in low/middle-income, 29% in high-income. 48% allocate up to 1/4 of savings.
Left headline, right bar chart showing proportion distribution, far right large percentage callouts
54% of owners aged 18-34. 60% male but Africa nearly equal (51:49). Demographics by age, income source, and interest groups.
Left text narrative, right multi-section grouped bar charts (Age, Main income, Groups of interest)
Statement slide emphasizing utility over speculation
Large bold text on light gradient background
Sub-section divider for 'Managing stablecoins'
Light cyan gradient with large dark text
Buying methods: centralized exchange (34%), crypto wallet apps (28%), crypto brokers (17%). Despite crypto's decentralized origins.
Left bold headline with body text, right lifestyle photo of woman on bridge using phone
Preferred platforms: exchange (46%), payment apps with crypto (40%), mobile wallet (39%), banking app (23%), hardware wallet (13%)
Left headline with large 46% stat, right horizontal grouped bar chart comparing all/low-middle/high-income
77% NET likely to open stablecoin wallet in banking app (83% low/middle-income, 67% high-income). Africa highest at 91%.
Left headline, right stacked horizontal bars showing likelihood by market type with NET likely callouts
Statement slide on banking opportunity
Large bold text on light gradient background
Expert commentary from Coinbase (Alec Lovett, John Turner) on institutional adoption, GENIUS Act, USDC growth, and future of stablecoin utility
Large headline, contributor photos and titles, multi-column editorial text
Sub-section divider for 'Spending stablecoins'
Light cyan gradient with large dark text
45% convert to local currency, 27% spend directly. 28% convert/spend within days. APAC (39%) and South Asia (36%) lead direct spending.
Left bold headline, right stacked horizontal bars showing storage duration by market type
South Asia 45% convert immediately/within days vs Europe 17%. Regional bubble chart comparison across 7 regions.
Top headline, bottom proportional circle chart showing conversion speed by region
71% NET likely to use linked debit card. 78% in low/middle-income, 60% in high-income. Africa leads at 89%.
Left headline with 89% callout, right stacked bars showing card interest by economy type
Desire to spend exceeds current spending in every category. Top: everyday/subscription spending (38%). Driven by Nigeria (62%), South Africa (50%).
Left headline and text, right lifestyle photo of person making mobile payment
Current vs desired spend across categories: online purchases (27% vs 34%), subscriptions (21% vs 27%), big purchases (18% vs 29%), travel (16% vs 26%)
Left headline, right dual-bubble chart comparing current vs desired spending across 10 categories
Country-level spending comparison. Nigeria leads (92% current, 96% desired). UK lowest (43% current, 57% desired).
Left headline, right horizontal dual-bubble chart ranked by 16 countries
52% have bought specifically because merchant accepted stablecoins. 60% in low/middle-income, 42% in high-income.
Left headline, right stacked bars showing yes-multiple/yes-once/not sure/no by economy type
Quote: 'Stablecoin acceptance doesn't just convert customers, it creates them. It's a universal payment rail...'
Large blue quote text with attribution on light gradient background
Expert commentary from Artemis (Anthony Yim, Andrew Van Aken) with active addresses chart showing 500% supply increase and 1,300% address growth
Large headline, contributor photos, editorial text, stacked bar chart of active addresses 2021-2026
2026 Artemis/McKinsey report shows volumes annualizing to $390B. Visa card settlement grew $1B to $3B. Breakdown by B2B, P2P, Remittance, Card, Prefunding.
Stacked bar chart showing monthly payment volume Jan 2024 - Oct 2025 by type, with editorial text above
Sub-section divider for 'Getting paid in stablecoins'
Light cyan gradient with large dark text
35% overall mean of annual earnings paid in stablecoins. 36% in low/middle-income, 32% in high-income. Core revenue, not supplemental.
Left bold headline, right bar chart distribution with three large % callouts
76% of marketplace sellers report improved sales/customer base. 73% of freelancers report improved international work ability. 77% interested in accepting crypto.
Left headline, right editorial text, bottom two stacked bars comparing sellers vs freelancers
77% NET interested overall. Africa 95%, APAC 87%. Breakdown by region, economy, crypto status, and interest groups. 44% very interested.
Left pie chart showing interest levels, right horizontal bars by region/economy/crypto status/groups
Sub-section divider for 'Payment experience'
Light cyan gradient with large dark text
Top motivations: lower fees (30%), security (28%), international use (27%), merchant acceptance (26%), faster settlement (25%)
Left bold headline and text, right horizontal bar chart ranking 13 motivations
40% mean saving on traditional payment fees. World Bank average cost of sending $200 internationally is 6.4%. Pie chart of savings distribution.
Left editorial text, right pie chart with 5 savings bands, bottom large 40% callout
Overall 40% saved. South Asia highest at 45%. Consistent across high-income (35%) and low/middle-income (41%). Freelancers and sellers both 44%.
Left headline, right horizontal bars segmented by region, economy, and groups of interest
26% cite speed and convenience as key benefit. Fast transactions, lower fees, global accessibility, 24/7 availability, strong security.
Bold headline with green 'like' accent, bullet checklist, three user quote cards
Irreversible payments (30%), too many steps (22%), limited merchant acceptance, wallet complexity, regulatory uncertainty, high network fees.
Bold headline with red 'dislike' accent, X-mark list, three user complaint quote cards
Frustration ranking: irreversible payments (30%), too many steps (22%), blockchain selection (20%), unfavorable exchange rates (20%)
Left headline, right horizontal bar chart ranking 10 frustration points
Quote: 'The problems consumers flag are ultimately design failures the industry can fix...'
Large blue quote text on light gradient background with attribution
Four user quotes on expectations: simple wallets, money-back guarantees, universal acceptance, transparent fees
Bold headline, four white quote cards arranged horizontally
Top 5 improvement requests: merchant acceptance (16%), speed/reliability (15%), consumer protection (14%), UX improvements (10%), lower fees (8%)
Left headline, right numbered grid (1-5) with descriptions for each improvement
Statement: what's missing is acceptance, simplicity, protection - connective tissue to make stablecoins a default payment method
Large bold statement text on light gradient background
Section divider for Appendix
Dark blue gradient with white 'Appendix' text
Sample sizes by country and region. Total 4,658 across 16 countries. High-income and low/middle-income economy tables.
Two data tables with green/teal highlighting showing sample distribution
Country-level stablecoin ownership vs intent. Africa leads (79% ownership, 76% intent). Europe lowest (36% ownership, 40% intent).
Two side-by-side data tables with green/teal highlighting and significance indicators
USDT vs USDC ownership by country. Nigeria leads USDT (59%) and USDC (48%). Western markets significantly lower.
Horizontal bar chart with dual bars (USDT darker, USDC lighter) per country
Heatmap-style matrix: 10 spending categories x 16 countries. Nigeria leads most categories. Online trading highest overall.
Large data matrix table with green gradient cell shading indicating percentage levels
Closing page with BVNK branding
Dark blue gradient - clean close
이 슬라이드 및 기본 프레젠테이션 콘텐츠에 대한 일반적인 질문.
It is a comprehensive 57-page research report by BVNK, in partnership with YouGov, Coinbase, and Artemis, surveying 4,658 adults across 15 countries to understand how global consumers actually use stablecoins for ownership, spending, earning, and payments.
The report covers 15 countries across 7 regions (North America, Latin America, Europe, Southeast Asia, South Asia, Africa, Asia-Pacific) with 4,658 survey respondents, grouped by high-income and low/middle-income economy classifications.
54% of respondents held stablecoins in the last 12 months, 56% intend to acquire more, and 49% increased their holdings. Ownership is highest in Africa (79%) and skews young (54% aged 18-34) and entrepreneurial.
Stablecoins move fast - 28% convert or spend within days. Desire to spend exceeds current spending in every category tested. 71% would use a linked debit card, and 52% have bought specifically because a merchant accepted stablecoins.
This template is ideal for fintech presentations, investor pitches, industry conference talks, board strategy decks, and market research briefings on stablecoin adoption, digital payments, and financial inclusion trends.
The report features a clean, modern design with BVNK's signature dark blue and cyan gradient palette, professional data visualizations, lifestyle photography, expert commentary sections, bold statement slides, and consistent branding throughout all 57 pages.
The top frustrations are irreversible payments and risk of losing funds (30%), too many steps to complete a payment (22%), needing to select specific blockchains (20%), and unfavorable exchange rates (20%). Users want stablecoins to work like everyday payments.
77% of respondents would open a stablecoin wallet if their bank or fintech app offered one (rising to 83% in low/middle-income economies). The trust is already there - the infrastructure gap is the only thing holding banks back.

Create Your Own Slides
Turn your ideas into professional presentations in seconds with 2slides AI.
전문 디자인을 참조하고, 스타일을 선택하며, 완벽한 텍스트 렌더링으로 슬라이드를 생성하세요. Nano Banana로 구동—지금 프레젠테이션 만들기를 시작하세요.
Your AI Agent for slides. Save time, shine faster with intelligent presentation creation.




© 2026 2slides. All rights reserved.