
수록 모음: 투자자 발표자료 사례 · 인도 기업 IR 자료 예시
Axis Bank's Investor Presentation for Quarterly Results Q2 FY27 (July–September 2026), a 69-slide earnings deck filed with BSE/NSE on 17 October 2026 covering financial highlights, capital and liquidity, business segments, asset quality, ESG, subsidiaries and full financial statements.
이 프레젠테이션의 표지를 스타일 참고 자료로 사용해 내 콘텐츠로 슬라이드를 만듭니다. 아래에서 원하는 페이지를 골라 그 레이아웃을 참고로 쓸 수도 있습니다.
빠른 탐색
태그
슬라이드 공유
Axis Bank's Investor Presentation for Quarterly Results Q2 FY27 (July–September 2026), a 69-slide earnings deck filed with BSE/NSE on 17 October 2026 covering financial highlights, capital and liquidity, business segments, asset quality, ESG, subsidiaries and full financial statements.
레이아웃, 주요 콘텐츠 및 시각적 요소를 포함한 각 슬라이드 페이지의 상세 보기.
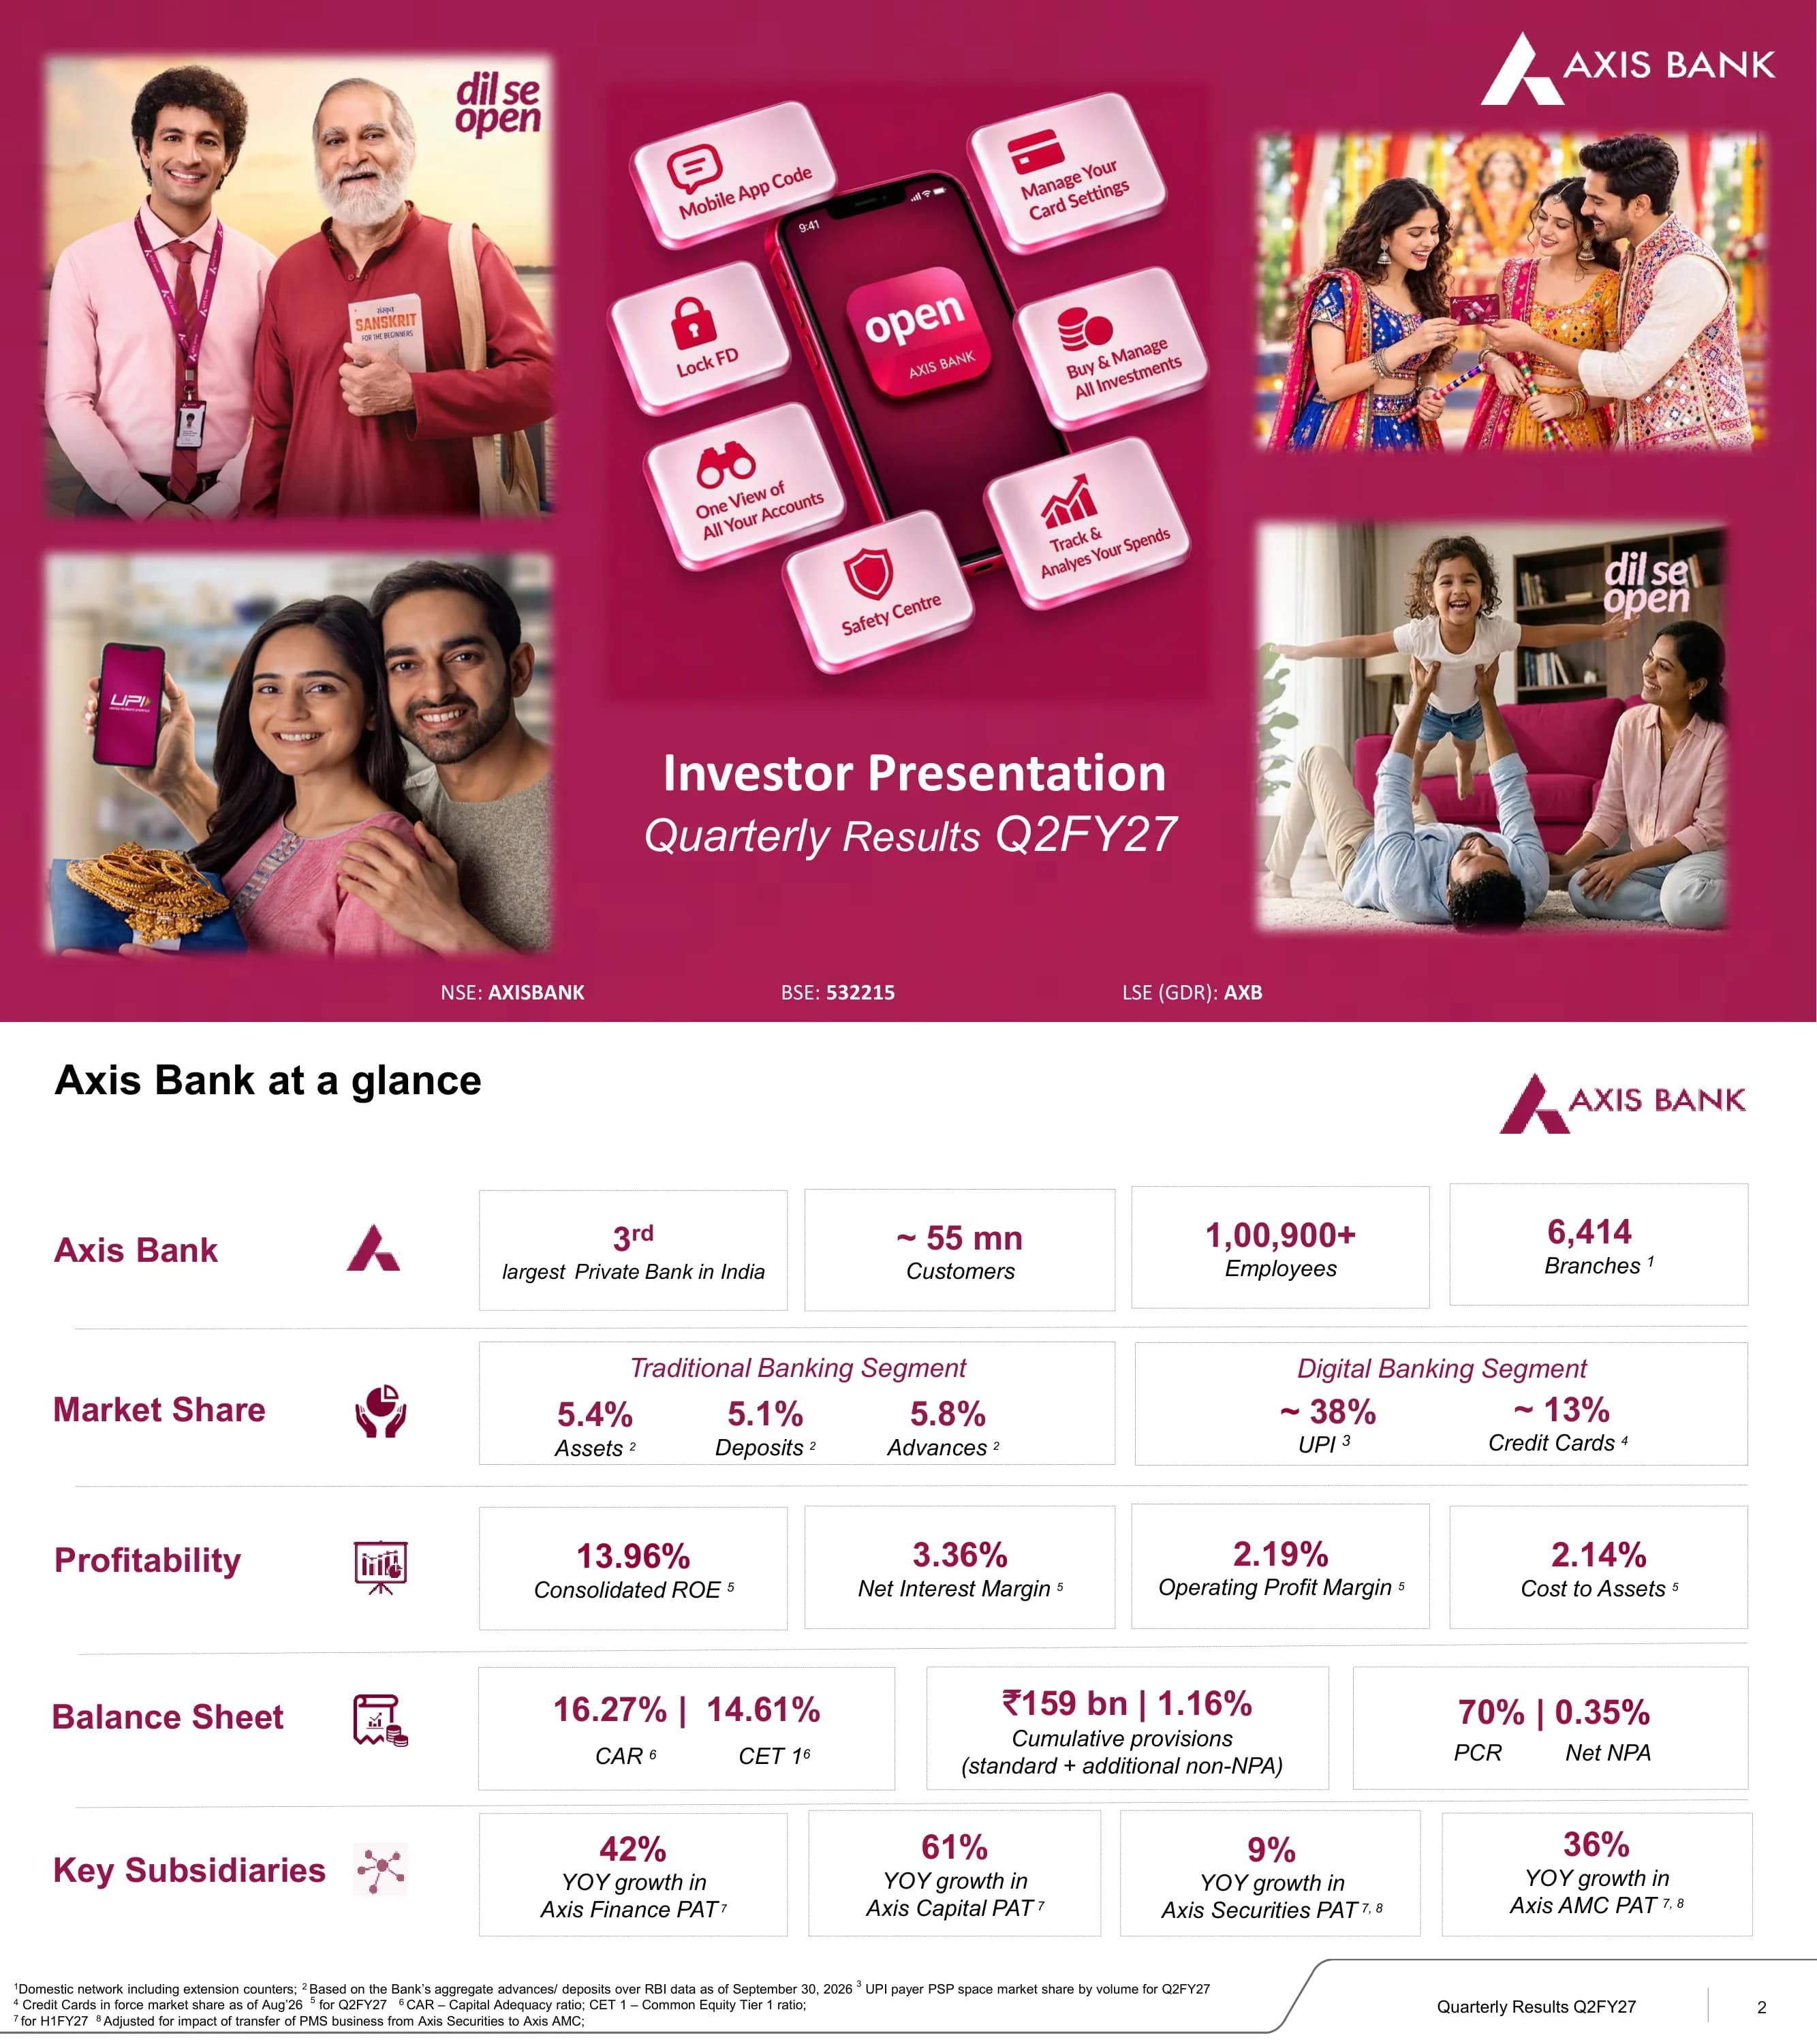
Cover slide titled 'Investor Presentation, Quarterly Results Q2FY27' with the Axis Bank logo and listing codes NSE: AXISBANK, BSE: 532215 and LSE (GDR): AXB. The visual centrepiece is the 'open' by Axis Bank mobile app with feature tiles such as Lock FD, One View of All Your Accounts and Safety Centre.
Full-bleed magenta background with four soft-edged lifestyle photographs in the corners, a central smartphone mock-up surrounded by 3D feature tiles, and the title in white beneath it; ticker codes along the bottom.
Third-largest private bank in India with ~55 million customers, 1,00,900+ employees and 6,414 branches. Market share of 5.4% in assets, 5.1% in deposits and 5.8% in advances, ~38% in UPI and ~13% in credit cards; consolidated ROE 13.96%, NIM 3.36%, CAR 16.27%, CET1 14.61%, PCR 70%, net NPA 0.35%, and H1 PAT growth of 42% at Axis Finance, 61% at Axis Capital, 9% at Axis Securities and 36% at Axis AMC.
Five labelled rows (Axis Bank, Market Share, Profitability, Balance Sheet, Key Subsidiaries), each with a burgundy row label, an icon and a strip of outlined KPI cards with large burgundy figures.
Section divider listing the deck's eight sections (Executive Summary, Financial Highlights, Capital and Liquidity Position, Business Segment Performance, Asset Quality, Sustainability, Subsidiaries' Performance, Other Important Information), with Executive Summary highlighted.
Staircase of slanted parallelogram bars descending to the right, active section in burgundy and the rest in grey, with a thin diagonal burgundy line.
Deposits grew 21% YOY and 6% QOQ, advances 23% YOY and 9% QOQ, and PAT rose 38% YOY to ₹7,003 crore. Core operating profit was ₹10,998 crore (up 11% YOY), NIM 3.36% (3.47% excluding FCNR (B) impact), CAR 16.27%, GNPA 1.16%, NNPA 0.35%, net credit cost 0.45%, and H1 FY27 consolidated ROE 14.23%, up 170 bps YOY.
Seven horizontal rows, each pairing a burgundy theme box on the left with a grey bullet panel of figures on the right; a burgundy-outlined callout bar at the bottom for consolidated ROE.
P&L table: NII ₹15,371 crore (+12% YOY), fee income ₹6,381 crore (+6%), operating profit ₹11,083 crore (+6%), core operating profit ₹10,998 crore (+11%), PAT ₹7,003 crore (+38%). Balance sheet: total assets ₹20,46,240 crore, net advances ₹13,73,727 crore, deposits ₹14,52,066 crore; key ratios include diluted EPS ₹88.80, book value ₹703, consolidated ROE 13.96%, GNPA 1.16%, NNPA 0.35%; deposit mix 36% CASA and loan mix 54% retail / 12% SME / 34% corporate.
Left half is a rounded-border table split into P&L, Balance Sheet and Key Ratios bands with vertical burgundy tabs; right half is a 2x2 grid of two pie charts and two bar charts with green up-arrows.
Total FCNR (B) deposits of ₹1,018 billion ($10.62 billion), including ₹438 billion backed by loans extended by the Bank and ₹449 billion backed by standby letters of credit; non-retail term deposits fell 8.6% QOQ. Excluding FCNR (B) deposits backed by the Bank's own loans, total deposits grew 17.0% YOY and advances 19.1% YOY versus reported 20.7% and 23.0%.
Burgundy panel on the left with stacked large rupee figures and a pink callout box beneath; on the right a burgundy-header table with alternating highlighted rows comparing reported and adjusted metrics.
Section divider with Financial Highlights highlighted in the eight-part agenda.
Same parallelogram staircase as page 3 with the second bar in burgundy.
QAB deposits rose to ₹13,964 billion in Q2 FY27 (23% YOY, 7% QOQ), with term deposits at ₹9,021 billion (65%), CA ₹1,549 billion and SA ₹3,394 billion; cost of deposits 4.80%. The loan book reached ₹13,737 billion (23% YOY, 9% QOQ): retail ₹7,399 billion (54%), SME ₹1,646 billion (12%), corporate ₹4,692 billion (34%); share of domestic loans fell to 93%.
Two side-by-side five-period stacked bar charts with YOY/QOQ growth columns, and rows of oval bubbles beneath showing retail-deposit share, cost of deposits and domestic loan share.
Operating revenue of ₹21,902 crore (NII ₹15,371 crore, non-interest income ₹6,531 crore), operating expenses of ₹10,819 crore (up 9% YOY), operating profit ₹11,083 crore and core operating profit ₹10,998 crore (up 11% YOY). PAT climbed from ₹5,090 crore in Q2 FY26 to ₹7,003 crore, up 38% YOY and down 2% QOQ.
Four-quadrant chart grid separated by dashed lines: stacked bars for revenue and opex, clustered bars for OP vs core OP, and a simple bar series for PAT, each with YOY/QOQ arrows.
Overall NIM eased from 3.73% in Q2 FY26 to 3.36% in Q2 FY27 (domestic NIM 3.55%); the Q1-to-Q2 bridge shows an 11 bp impact from FCNR deposits and a 1 bp interest reversal. About 72% of loans are floating (60% repo-linked), and cost of funds was 5.07%.
Four quadrants: stacked advances-mix bar exploding into an MCLR duration pie, a 13-quarter cost-of-funds line, a NIM line chart, and a waterfall bridge.
Three drivers: loans and investments rose to 89% of total assets (non-INR book 4.2%), low-yielding RIDF bonds fell from ₹30,564 crore (2.3% of assets) in Mar-23 to ₹7,203 crore (0.4%), and average CASA moved from 43.6% in FY23 to 36.1% in H1 FY27, with cost of CASA 41 bps lower than FY23.
Three numbered columns with coloured number badges (green, green, orange), each containing bar charts; burgundy bar highlights the latest period.
Retail banking fees reached ₹4,437 crore (4% YOY, 7% QOQ, 70% of total fees) and corporate & commercial banking fees ₹1,943 crore (10% YOY). TPP fees grew 9% YOY, retail assets fees (excluding cards & payments) 18%, transaction banking, forex and trade fees 5%, and treasury fees (ex forex) 263%.
Two stacked rows, each with a five-quarter bar chart on the left and a grouped fee-mix bar chart with bullets on the right; green oval tags show share of total fees.
Opex rose from ₹9,957 crore to ₹10,819 crore, split into volume-linked (+₹410 crore), technology & growth (+₹201 crore) and business-as-usual (+₹251 crore) costs. Technology is ~10% of opex, and cost-to-assets fell to 2.14%, down 24 bps YOY and 6 bps QOQ.
Left: 100% stacked bars with bracket connectors showing growth rates; right: a walk chart from Q2 FY26 to Q2 FY27 opex with circled YOY tags, and a cost-to-assets line chart beneath.
The AXIOM AI operating model has five focus areas and a reusable capability platform. Four platforms are live (VisionXtract document AI, Voice AI, Knowledge AI and RM Copilot), on top of a governance layer covering enterprise AI governance, an evaluation harness, model lifecycle monitoring and ISO 42001-certified responsible AI.
Two linked header boxes with bidirectional arrows, then a 'From use cases to platforms' band with four outlined capability cards marked LIVE and a row of pink governance tiles.
AI metrics across five focus areas, including ~34 million AI-assisted document reads, 2.50 million+ AI bot-led sales calls with ~9.5x QOQ growth in call conversions, ~0.75 million Knowledge Bot queries with ~90% liked, ~9.5 million calls transcribed, ~275 CitizenAI solutions and ~4 million monthly prompts. The bank says it was the first BFSI firm globally certified to ISO 42001.
Five-row matrix with a vertical burgundy 'Focus Areas' spine, lettered row labels in grey chevrons and metric cells holding bold numbers.
Section divider with Capital and Liquidity Position highlighted.
Parallelogram staircase agenda with the third bar in burgundy.
CET1 rose from 14.38% (Mar-26) to 14.61% (Sep-26) with 1.18% accretion and 0.95% consumption; total CAR was 16.27%. Consolidated LCR held around 119% against a 100% minimum, RWA to total assets fell to 71%, and excess SLR stood at ₹1,04,306 crore.
Four quadrants: CET1 waterfall, stacked CAR bars (CET1/AT1/Tier 2), a 13-quarter LCR line with a dashed regulatory floor, and an RWA-to-assets line.
Section divider with Business Segment Performance highlighted.
Parallelogram staircase agenda with the fourth bar in burgundy.
Retail franchise KPIs: ~52 million individual customers, 4th-largest credit card issuer, ₹8.20 trillion wealth AUM, 16% YOY retail advances growth, 20% rural advances growth, 54% share of advances, SA growth of 13% (QAB) and 12% (MEB), 36% CASA ratio and a 70% share of total fees.
Left half solid burgundy panel with a 3x3 grid of white KPIs separated by thin lines; right half a black-and-white lifestyle photograph.
LCR outflow rates improved to 29.0% in Sep'26; cost of deposits peaked at 5.19% in Q4 FY25 and stood at 4.80% in Q2 FY27. Axis deposits grew 21% (MEB) and 23% (QAB) over the last year versus 17% for the industry, with 5-year CAGRs of 15% and 14% versus 12%.
Three numbered columns with coloured badges and narrative headers, each holding a bar chart; burgundy bars mark Axis or latest values.
Five initiative pillars (productivity and micro-markets, premiumization, curated propositions, Bharat Banking, digital/partnerships) cite figures such as SA new-to-bank deposits up 13% YOY, 77% of requests serviced digitally, 30% CAGR in Burgundy AUM since Mar'20 and ~20K CSC VLEs. Outcomes: 6% growth in premium salary acquisitions, 28% YOY term-deposit growth and 2.7 million retail term deposits acquired in Q2 FY27.
Five burgundy-header columns of text cards funnelling via a grey trapezoid into three dashed-border outcome boxes.
Overall Burgundy AUM grew from ₹1.47 trillion (Mar-20) to ₹8.20 trillion (Sep-26), a 30% CAGR, up 27% YOY and 9% QOQ. Burgundy Private AUM was ₹2.77 trillion (12% YOY) across 18,750+ families and 44,400+ clients.
Left: AUM bar chart above a four-row KPI list with dashed growth badges; right: a dark award poster for Burgundy Private's PWM Wealth Tech Awards 2026 wins.
Retail loans of ₹7,39,905 crore (16% YOY, 10% QOQ), led by home loans ₹1,75,261 crore (24%), rural loans ₹1,22,338 crore (17%, up 20% YOY) and LAP ₹90,177 crore; ~74% of the book is secured. Existing-to-bank mix ranges from 78% in personal loans to 42% in auto loans; average LTVs are 62% for home loans and 44% for LAP.
Top-left bar-and-line chart, top-right rounded product table, a boxed MFI note, and a bottom row with ETB mix bars and icon-led callouts.
The SBB book reached ₹85,167 crore (21% YOY, 7% QOQ), including ₹18,865 crore of unsecured business loans; ~72% is secured, ~82% of working capital is PSL-compliant and the customer base is 7.02 lakh+. 24x7 end-to-end digital lending contributes ~78% of unsecured business-loan disbursements.
Three columns: stacked bar chart (working capital vs business loans), bulleted highlights with large burgundy numbers, and a multi-segment industry pie chart.
Card issuances were 1.09 million in Q2 FY27 across a 13-quarter trend; cards in force stood at 16.3 million+ (4.2 million Flipkart Axis Bank cards), with ~13.1% market share of cards in force and ~11.4% spends share. Axis was described as Apple Pay's first partner in India.
Left column of card images (Magnus, Horizon, Flipkart Axis); right a 13-bar issuance chart, four KPI figures and an outlined Apple Pay callout.
Overall Q2 FY27 credit card spends of ₹72,853 crore with an 11.4% market share; debit card spends rose to ₹9,055 crore. Axis held 2nd rank in POS terminal market share at 25.7% (Aug'26), and its 'Grab Deals' platform posted ₹54 crore GMV in H1 FY27.
Two outlined callout boxes on top, then three chart columns: stacked market-share bars, debit-spend bars and POS share bars topped by star rank icons.
Rural loans grew to ₹1,22,338 crore (20% YOY, 21% CAGR since Mar-21) across 687 districts, served by 2,995 Bharat Banking branches and a 19,813-strong CSC VLE network; rural deposits grew 17% YOY. Growth businesses include MFI-retail, farm mechanization, gold loans, Bharat Enterprises, farmer funding and social security schemes.
Three columns under burgundy header bars: a bar chart plus 3D pie, a stack of large KPI numbers, and a bulleted business list with burgundy subheads.
Domestic branches grew from 4,903 (Mar-23) to 6,414 (Sep-26), up 7% YOY, split 29% metro, 23% urban, 29% semi-urban and 19% rural, plus 353 BCBOs. The Axis Virtual Centre connects with ~4.4 million customers a month through 1,669 virtual RMs across 8 centres.
Three-column top row (bar chart, pie chart, overlapping rounded KPI boxes) and two rounded bullet panels beneath.
Wholesale KPIs: corporate loans up 34% YOY, SME 25%, mid-corporate 29%, transaction banking fees 9% (H1 FY27), 91% of corporate advances rated A- and above, 88% of incremental sanctions to A- and above, CA deposits up 15% (QAB) and 7% (MEB), 11% foreign LC share and 38% NEFT share.
Burgundy left panel with a 3x3 KPI grid and a black-and-white industrial photograph on the right, mirroring page 19.
Corporate & Commercial Banking was reorganised into 8 coverage groups (e.g. Conglomerates & Large Corporate, Mid Corporate, Multi-national, Government Coverage). It offers a 'one stop shop' across transaction banking, loans and deposits, treasury/capital markets/investment banking and retail linkage, supported by group entities Axis Trustee, A.TREDS, Axis Capital, Axis Finance and Axis MF.
Dashed column of coverage-group tiles on the left, a four-segment semicircular wheel in the centre linked to colour-coded product bands, and dashed entity boxes on the right, framed by axis arrows.
Corporate loans reached ₹4,69,230 crore (34% YOY, 8% QOQ), including ₹47,777 crore overseas. 91% of the book is rated A- or better and 70% AA- and above; 89% of the overseas book is India-linked and 98% is rated A- and above.
Three columns: stacked domestic/overseas bars with YOY/QOQ arrows, 100% stacked rating bars with oval sanction tags, and overseas book bars below a rounded bullet box.
Payments market shares: NEFT volume 38%, IMPS volume 26%, BBPS value 16%, foreign LC 11%, RTGS value 9% and GST payments 6%. Current-account month-end balances grew 7% YOY, and 83% of current-account customers are registered for internet or mobile banking.
Central circular jigsaw-puzzle wheel with burgundy line icons and the Axis logo at the hub, surrounded by eight labelled metric callouts.
Axis arranged ₹63,820 crore of debt in H1 FY27 (₹65,363 crore in H1 FY26) with market share rising from 18.5% to 21.9%, ranking 1st on the Bloomberg India bonds league table. Corporate bond holdings were ₹47,851 crore, falling to 10% of corporate loans.
Left: paired bar charts with star rank badges and trophy-icon callouts; right: a bar chart with a declining percentage line overlay.
The neo corporate digital platform counts 7.3K+ neo partnership customers, 4.5K+ neo API customers and 6L+ neo for corporates customers, and its app is rated 4.6. The Infiniti onboarding platform has opened 1.8 lakh+ accounts, cut account-opening time by 50% and reduced CIB onboarding turnaround 3x.
Three columns under rounded outlined headers: product screenshots and neo app icons, app rating laurel and award badges, and the Infiniti device mock-up with bullets.
Top-10 sector exposures as of 30 Sep'26: financial companies ₹2,18,273 crore (12.92%), engineering & electronics ₹78,830 crore (4.67%), trade ₹73,673 crore (4.36%), power ₹68,226 crore (4.04%) and real estate ₹66,369 crore (3.93%), down to petroleum products at 1.82%. Each sector is split into advances, investments and non-fund-based exposure.
Full-width table with a burgundy header row, ranked sector rows and footnotes beneath.
Sub-section opener introducing the commercial banking (SBB, SME and mid-corporate) pages.
Left half burgundy panel with white title text; right half black-and-white photograph of a shopkeeper in a textile store.
The combined SBB, SME and mid-corporate book grew from ₹1,02,097 crore (Sep'21) to ₹3,31,571 crore (Sep'26), a 27% CAGR, raising its share of total loans from 16.4% to 24.1% (~772 bps). Axis holds 8.9% incremental MSME market share over five years and 8.2% of industry MSME credit.
Stacked bar chart with a share-of-book line overlay and CAGR badges, a burgundy banner below, and a right column of three large KPI figures.
SME advances reached ₹1,646 billion (25% YOY, 9% QOQ), 67% rated on the SME model and 33% on the large-corporate model, with 84% PSL-compliant. 84% of SME-model loans are SME3 or better, and 35% of large-corporate-model loans are A- and better.
Top banner with two icon statements; left stacked bar chart linked by dashed connector lines to two 100% stacked rating charts on the right.
The SME book is diversified by loan size (27% under ₹5 crore, 27% over ₹25 crore) and geography (West 32%, South 28%, North 24%, East & others 16%). Short-term loans were 63% of the book in Sep-26, and 87% of incremental sanctions went to SME3-and-above borrowers.
Grid of three pie charts on top and two bar charts below, plus a large multi-sector pie with a two-column legend on the right.
Digital KPIs: 98% digital transactions, 92% of credit cards issued digitally, 61% of new SA acquisition, 84% of personal loans disbursed end-to-end digitally, ~16 million mobile banking MAU, a 4.8 app rating, 675 APIs, 4,450+ robotic processes, ~2,500 tech staff and ~12 million non-Axis customers using the Axis Mobile app.
Gradient magenta full-bleed slide with three icon-labelled rows (D2C products, Transformation, Capabilities) of white KPIs and a large phone mock-up on the right showing the 'open' app.
The digital strategy positions 'open' as a fully digital bank within the bank. Its goals are to acquire customers at scale (45% of retail TDs acquired digitally), lead digital consumer lending (84% of PL disbursed digitally), run a benchmark mobile app and lead new platforms such as Account Aggregator, ONDC, CBDC and OCEN. Three pillars: proprietary capabilities, re-imagined customer experience and a full product suite.
Left stack of five grey cards with burgundy left borders; right column of three lettered burgundy circles paired with outlined boxes, separated by a vertical rule.
Technology firsts include being the first Indian bank to be ISO-certified for AWS and Azure cloud security, a 99.75% CIS benchmark score, a BitSight rating of 810 and UPI declines of 0.01%. Customer metrics: ~₹8.2 trillion mobile banking spends (up 13% YOY), ~16 million MAU and a 4.8 rating with 3.5 million+ reviews. Account Aggregator-based personal loan disbursals grew 3.4x.
Three lettered columns under burgundy headers: dashed KPI boxes plus an award panel, a phone image with stacked metrics and a rating badge, and app-feature screenshots.
As payer PSP, quarterly UPI value reached ₹34,78,612 crore (34% YOY) and volume 28,008 million (29% YOY); UPI P2M throughput was ₹6,02,711 crore (27% YOY). Axis has a 2,953 million cumulative VPA base, ~16.2 million merchants transacting daily and ~38% payer PSP market share by volume.
Rounded icon banner on top; three columns beneath with partner logos, a bar-plus-line combo chart and a bar chart; burgundy footer banner.
Section divider with Asset Quality highlighted.
Parallelogram staircase agenda with the fifth bar in burgundy.
GNPA fell from 1.46% to 1.16% and NNPA from 0.44% to 0.35% YOY. Annualised gross slippages were 1.48% (net 0.75%) and credit cost 0.72% (net 0.45%). By segment, retail GNPA was 1.74% (PCR 65%), CBG 0.70% and WBG 0.48% (PCR 94%), with a total PCR of 70%.
Four quadrants of line charts and small grouped bars, with green oval PCR tags above the segmental bars.
Gross NPAs moved from an opening ₹17,125 crore to a closing ₹16,778 crore in Q2 FY27 after ₹4,762 crore of fresh slippages, ₹2,380 crore of upgrades and recoveries and ₹2,729 crore of write-offs; net NPA was ₹5,054 crore. PCR was 70% (92% including technical write-offs), and total provisions fell to ₹1,694 crore from ₹3,547 crore a year earlier.
Two stacked tables with burgundy header rows and grey-shaded subtotal rows: NPA walk on top and P&L provisions below.
Section divider with Sustainability highlighted.
Parallelogram staircase agenda with the sixth bar in burgundy.
Environmental, social and governance metrics include ₹61,348 crore of wholesale financing to positive-outcome sectors, ~4.16 million saplings, EV penetration of 9.01% (2-W) and 7.2% (4-W), ~2.8 million households reached, 30.1% female workforce and 64% independent directors. Ratings include an MSCI ESG AAA (Sept 2026), a 10th year on FTSE4Good, a DJSI score of 58 and a Sustainalytics 18.4 low-risk rating.
Three icon-headed E/S/G columns of large burgundy figures, a right sidebar of ESG benchmark logos, and a bottom row of index logo cards.
Progress against September 2021 commitments: the ₹10,000 crore Asha Home Loans target was achieved in 2024, ~₹61,348 crore was achieved against the ₹60,000 crore wholesale target for FY2030, EV shares reached 9.01% (2-W) and 7.2% (4-W) against 8%/7% FY27 targets, female representation reached 30.1% against 30%, and ~4.16 million of 8 million saplings have been planted.
Three-column commitment / unit / achievement table with burgundy headers and star markers, plus a vertical strip of UN SDG icons on the right.
Retail Bank NPS rose from a baseline of 100 (Q1 FY23) to 159 in Q2 FY27 (+59). The Adi GenAI chatbot processed 14.87 lakh queries YTD, and the Kaleidoscope CXM tool logged 74.20 lakh interactions. Sparsh Week 2026 generated 6.2 lakh+ customer connects with 1 lakh+ employees participating.
Dense two-column layout with burgundy section bars: NPS bar chart and digital-enabler bullets on the left; Sparsh Week KPIs, launch lists and cohort cards on the right.
Section divider with Subsidiaries' Performance highlighted.
Parallelogram staircase agenda with the seventh bar in burgundy.
The One Axis Group spans asset management, investment banking, a consumer NBFC, brokerage, trustee, fintech, TReDS and insurance (19.99% co-promoter stake in Axis Max Life). Total investments were ₹5,336 crore, combined net worth of operating subsidiaries ₹15,866 crore (31% CAGR), and combined PAT ₹1,210 crore in H1 FY27 (29% YOY).
Pyramid header with the Axis logo, a row of chevron category tabs above subsidiary logo cards with stake percentages, and three bar charts beneath.
Axis Finance AUM reached ₹54,594 crore (30% CAGR, 23% YOY) and 85% of the book is secured. H1 FY27 PAT was ₹546 crore (42% YOY) on pre-provision profit of ₹897 crore, with GNPA 0.97%, NNPA 0.35%, CRAR 22.15% and ROE 13.33%.
Four quadrants with outlined headers: AUM bars with a dashed book-highlights box, clustered PPP/PAT bars, two donut charts linked by an arrow, and a key-highlights table.
Overall QAAUM rose to ₹3,82,966 crore (9% YOY) and equity QAAUM to ₹2,01,245 crore (2% YOY). H1 FY27 PAT was ₹370 crore (36% YOY), revenue ₹871 crore (up 22%), with a 4.4% AAUM market share and ~14 million folios; equity is 52% of AAUM by asset class.
Grid of two QAAUM bar charts, two pie charts and a PAT bar chart, plus a rounded major-highlights panel.
H1 FY27 revenue from operations was ₹404 crore (35% YOY) and PAT ₹149 crore (61% YOY). Axis Capital executed 20 ECM and 5 non-ECM transactions in Q2 FY27, has a 60+ mandate pipeline and covers 314 stocks representing 66% of India's market cap.
Two rounded highlight panels on top and two bar charts beneath with CAGR and YOY badges.
The customer base reached 7.32 million (8% YOY). H1 FY27 revenue was ₹842 crore (15% YOY) and PAT ₹191 crore (9% YOY), both adjusted for the PMS transfer; 46% of Q2 volumes came from mobile trading.
Top row with a customer bar chart and a rounded highlights panel; bottom row with revenue and PAT bar charts.
H1 FY27 revenue was ₹43 crore and PAT ₹22 crore, both up 20% YOY; operating margin expanded to 55% and cost-to-income improved to 38%. Axis Trustee ranks No. 2 in debenture trusteeship with a 21% market share, and its InvIT share rose to 70%.
Rounded highlights panel beside a grouped market-share bar chart on top; revenue and PAT bar charts beneath.
A.TREDS's Invoicemart platform has financed ₹3,36,000 crore+ of MSME invoices, discounted ~65 lakh invoices and onboarded ~78,800 participants across 1,400+ locations with 76 financiers. H1 FY27 revenue was ₹71 crore (19% YOY) and PAT ₹25 crore (15% YOY).
Wide rounded panel with bullets and an icon-led 'progress so far' column, plus two bar charts below.
Freecharge Payment Technologies received RBI in-principle approval as a payment aggregator (online and physical) and processed ₹21,000+ crore of GMV in H1 FY27. Freecharge Business and Technology Services grew unsecured business loans 72% QOQ with over 99.5% collection efficiency, and its MFI business grew 18% QOQ across 220 locations.
Two mirrored columns, each with a burgundy entity label, a logo, an outlined description box and a bullet list.
Section divider with Other Important Information highlighted.
Parallelogram staircase agenda with the last bar in burgundy.
A wall of 20 awards, including 'India's Best Digital Bank' (Financial Express), 'Best Bank in India (Private Sector – Large)' from the Indian Chamber of Commerce, ICAI's Gold Shield for financial reporting, Asset Triple A digital awards, the Infosys Finacle Innovation Award 2026 and 'Best GenAI use case in Retail Banking'.
4x5 grid of bordered tiles, each with an award logo above a short description with burgundy award names.
Indian institutions hold 44.54%, FIIs 38.05%, LIC 7.86%, GDRs 3.11% and others 6.44%. Share capital is ₹623 crore, shareholders' funds ₹2,18,749 crore, book value per share ₹703, annualised diluted EPS ₹88.80, and market capitalisation ₹4,01,043 crore as on 15 October 2026.
Large 3D pie chart with callout labels, with a square-bullet list of capital metrics beneath.
Full P&L: interest income ₹36,419 crore (18% YOY), NII ₹15,371 crore, other income ₹6,531 crore (trading income only ₹85 crore), operating expenses ₹10,819 crore, provisions ₹1,694 crore (down 52%), PBT ₹9,389 crore (37% YOY) and net profit ₹7,003 crore (38% YOY). H1 FY27 net profit was ₹14,117 crore (30% YOY), ROA 1.38% and ROE 13.30% for the quarter.
Dense full-width table with a burgundy header row, formula column (A, B=C+D+E…) and grey-shaded subtotal rows comparing quarters and half-years.
The same P&L converted at ₹95.8254 per US$: net interest income $1,604 million, operating profit $1,157 million and Q2 FY27 net profit $731 million (38% YOY). H1 FY27 net profit was $1,473 million.
Identical table template to page 63 in US dollar terms, with a conversion-rate footnote.
As of 30 Sep'26, total assets/liabilities were ₹20,46,240 crore ($2,13,538 million), up 22% YOY. Deposits were ₹14,52,066 crore (CASA ₹5,29,539 crore, term deposits ₹9,22,527 crore), borrowings ₹2,73,086 crore (37% YOY), and advances ₹13,73,727 crore, split into corporate ₹4,69,230 crore, SME ₹1,64,592 crore and retail ₹7,39,905 crore.
Full-width table with rupee and dollar column groups plus QOQ/YOY growth columns; capital-and-liabilities and assets sections separated by grey bands.
Credit costs from FY12 to Q2 FY27 peaked at 3.57% in FY18 and were 0.72% (net 0.45%) in Q2 FY27, against a 15-year rolling average of 1.36%. The BB-rated corporate book shrank from 7.29% of GCA (Jun'16) to 0.15% (Sep'26); GNPA fell from 5.26% (Mar'19) to 1.16%, and PCR rose from 56% (Mar'16) to 70%.
Large long-run dual line chart with dotted average lines on the left, a 'Drivers of Credit Costs' bullet panel below it, and two small bar charts with burgundy PCR ovals on the right.
Net NPA (0.35%) plus fund-based BB-and-below (0.15%) totalled 0.50% of customer assets, with PCR steady at 70%. Outstanding Covid restructuring is ₹897 crore (0.06% of GCA) with ~16% coverage. The fund-based BB-and-below book rose to ₹2,155 crore after ₹261 crore of downgrades, with an average ticket size of ~₹40 crore.
Left: stacked bar chart with a PCR line and a small BB-and-below table; right: a restructuring table, a rounded bullet box and key-comment bullets, linked by a grey arrow.
Forward-looking statements disclaimer noting that statements using words such as 'will', 'expect' or 'strategy' involve risks and uncertainties, including NPL levels, provisioning policies and market risk exposure, and that Axis Bank undertakes no obligation to update them.
Single justified paragraph of body text under a bold title on a white slide.
Closing slide with a centred 'Thank You' message.
White slide with a centred burgundy headline, the logo top-right and the standard footer.
이 슬라이드 및 기본 프레젠테이션 콘텐츠에 대한 일반적인 질문.
For the quarter ended 30 September 2026, Axis Bank reported net profit of ₹7,003 crore (up 38% YOY), net interest income of ₹15,371 crore (up 12%), core operating profit of ₹10,998 crore (up 11%) and a NIM of 3.36%. Deposits grew 21% YOY to ₹14,52,066 crore and advances grew 23% to ₹13,73,727 crore. Asset quality improved, with GNPA at 1.16%, NNPA at 0.35% and PCR at 70%. Total CAR was 16.27% (CET1 14.61%), and H1 FY27 consolidated ROE was 14.23%.
Indian banks follow an April–March fiscal year, so FY27 runs from April 2026 to March 2027 and Q2 FY27 covers July to September 2026. The deck compares Q2 FY27 with Q1 FY27 (April–June 2026) and Q2 FY26 (July–September 2025), and also reports H1 FY27 (April–September 2026) figures.
Yes. This page offers the original 69-page PDF of the investor presentation and an editable PPTX converted from that PDF. The PPTX lets you reuse the slide layouts, tables and chart structures in PowerPoint, Keynote or Google Slides. Because it is a conversion, check fonts, charts and alignment before reusing any slide.
The deck is Axis Bank's own English-language investor presentation. It was filed with BSE and NSE on 17 October 2026 as a stock exchange disclosure under SEBI Regulation 30. The exchange filing also contained a cover letter, a press release and financial statements; those pages were removed, so page 1 here is the deck cover. The original filing is available on the BSE website.
During the quarter Axis Bank raised ₹1,018 billion ($10.62 billion) of FCNR (B) foreign-currency deposits under an RBI special window. That total includes ₹438 billion backed by loans from the Bank's own international branches and ₹449 billion backed by standby letters of credit. Because the back-to-back loans inflate both deposits and advances, the deck also reports growth excluding that effect: deposits rose 17% YOY on that basis (21% reported) and advances 19% (23% reported). The FCNR deposits also took 11 bps off NIM in the quarter.
Combined H1 FY27 PAT of the domestic subsidiaries was ₹1,210 crore, up 29% YOY. Axis Finance earned ₹546 crore (up 42%) on AUM of ₹54,594 crore, Axis AMC ₹370 crore (up 36%), Axis Capital ₹149 crore (up 61%), Axis Securities ₹191 crore (up 9%) and Axis Trustee ₹22 crore (up 20%). Separate slides cover Invoicemart (TReDS) and the Freecharge fintech entities.
The deck is a good model for a data-heavy financial results presentation. Useful patterns include a two-colour palette (burgundy for emphasis, grey for comparisons), the latest period highlighted in burgundy on every chart, YOY/QOQ arrow columns next to charts, a KPI-card 'at a glance' page, parallelogram agenda dividers that track the current section, and burgundy-and-photo opener slides. With 2Slides you can upload your own results or the PDF and generate a deck with similar structure and styling, or download the PPTX here and adapt the layouts.
Equity and credit analysts covering Indian banks will get the most out of it, since the deck includes full P&L, balance sheet, NPA-walk and capital tables. It also suits investors comparing Axis Bank with HDFC Bank, ICICI Bank or Kotak, finance students learning Indian banking metrics, and IR teams or designers looking for a well-organised template for a quarterly bank earnings deck.
Exchange filing; includes cover letter, press release and financial statements ahead of the slides

Create Your Own Slides
Turn your ideas into professional presentations in seconds with 2slides AI.
전문 디자인을 참조하고, 스타일을 선택하며, 완벽한 텍스트 렌더링으로 슬라이드를 생성하세요. Nano Banana로 구동—지금 프레젠테이션 만들기를 시작하세요.


