
수록 모음: 투자자 발표자료 사례 · 반도체 기업 IR 자료 예시
ASE Technology Holding (日月光投控, TWSE: 3711) Third Quarter 2026 Earnings Release presentation, dated 29 October 2026 and filed on Taiwan's Market Observation Post System (MOPS) for the investor conference (法說會). The English deck reports record consolidated net revenues of NT$ (New Taiwan dollars) 244.2 billion, up 28% quarter over quarter and 45% year over year, gross margin of 22.1%, operating margin of 13.6% and diluted EPS of NT$5.84, alongside segment detail for ATM (assembly, testing and material) and EMS (electronic manufacturing services), the balance sheet, capex versus EBITDA, and guidance for the fourth quarter of 2026.
이 프레젠테이션의 표지를 스타일 참고 자료로 사용해 내 콘텐츠로 슬라이드를 만듭니다. 아래에서 원하는 페이지를 골라 그 레이아웃을 참고로 쓸 수도 있습니다.
빠른 탐색
태그
슬라이드 공유
ASE Technology Holding (日月光投控, TWSE: 3711) Third Quarter 2026 Earnings Release presentation, dated 29 October 2026 and filed on Taiwan's Market Observation Post System (MOPS) for the investor conference (法說會). The English deck reports record consolidated net revenues of NT$ (New Taiwan dollars) 244.2 billion, up 28% quarter over quarter and 45% year over year, gross margin of 22.1%, operating margin of 13.6% and diluted EPS of NT$5.84, alongside segment detail for ATM (assembly, testing and material) and EMS (electronic manufacturing services), the balance sheet, capex versus EBITDA, and guidance for the fourth quarter of 2026.
레이아웃, 주요 콘텐츠 및 시각적 요소를 포함한 각 슬라이드 페이지의 상세 보기.
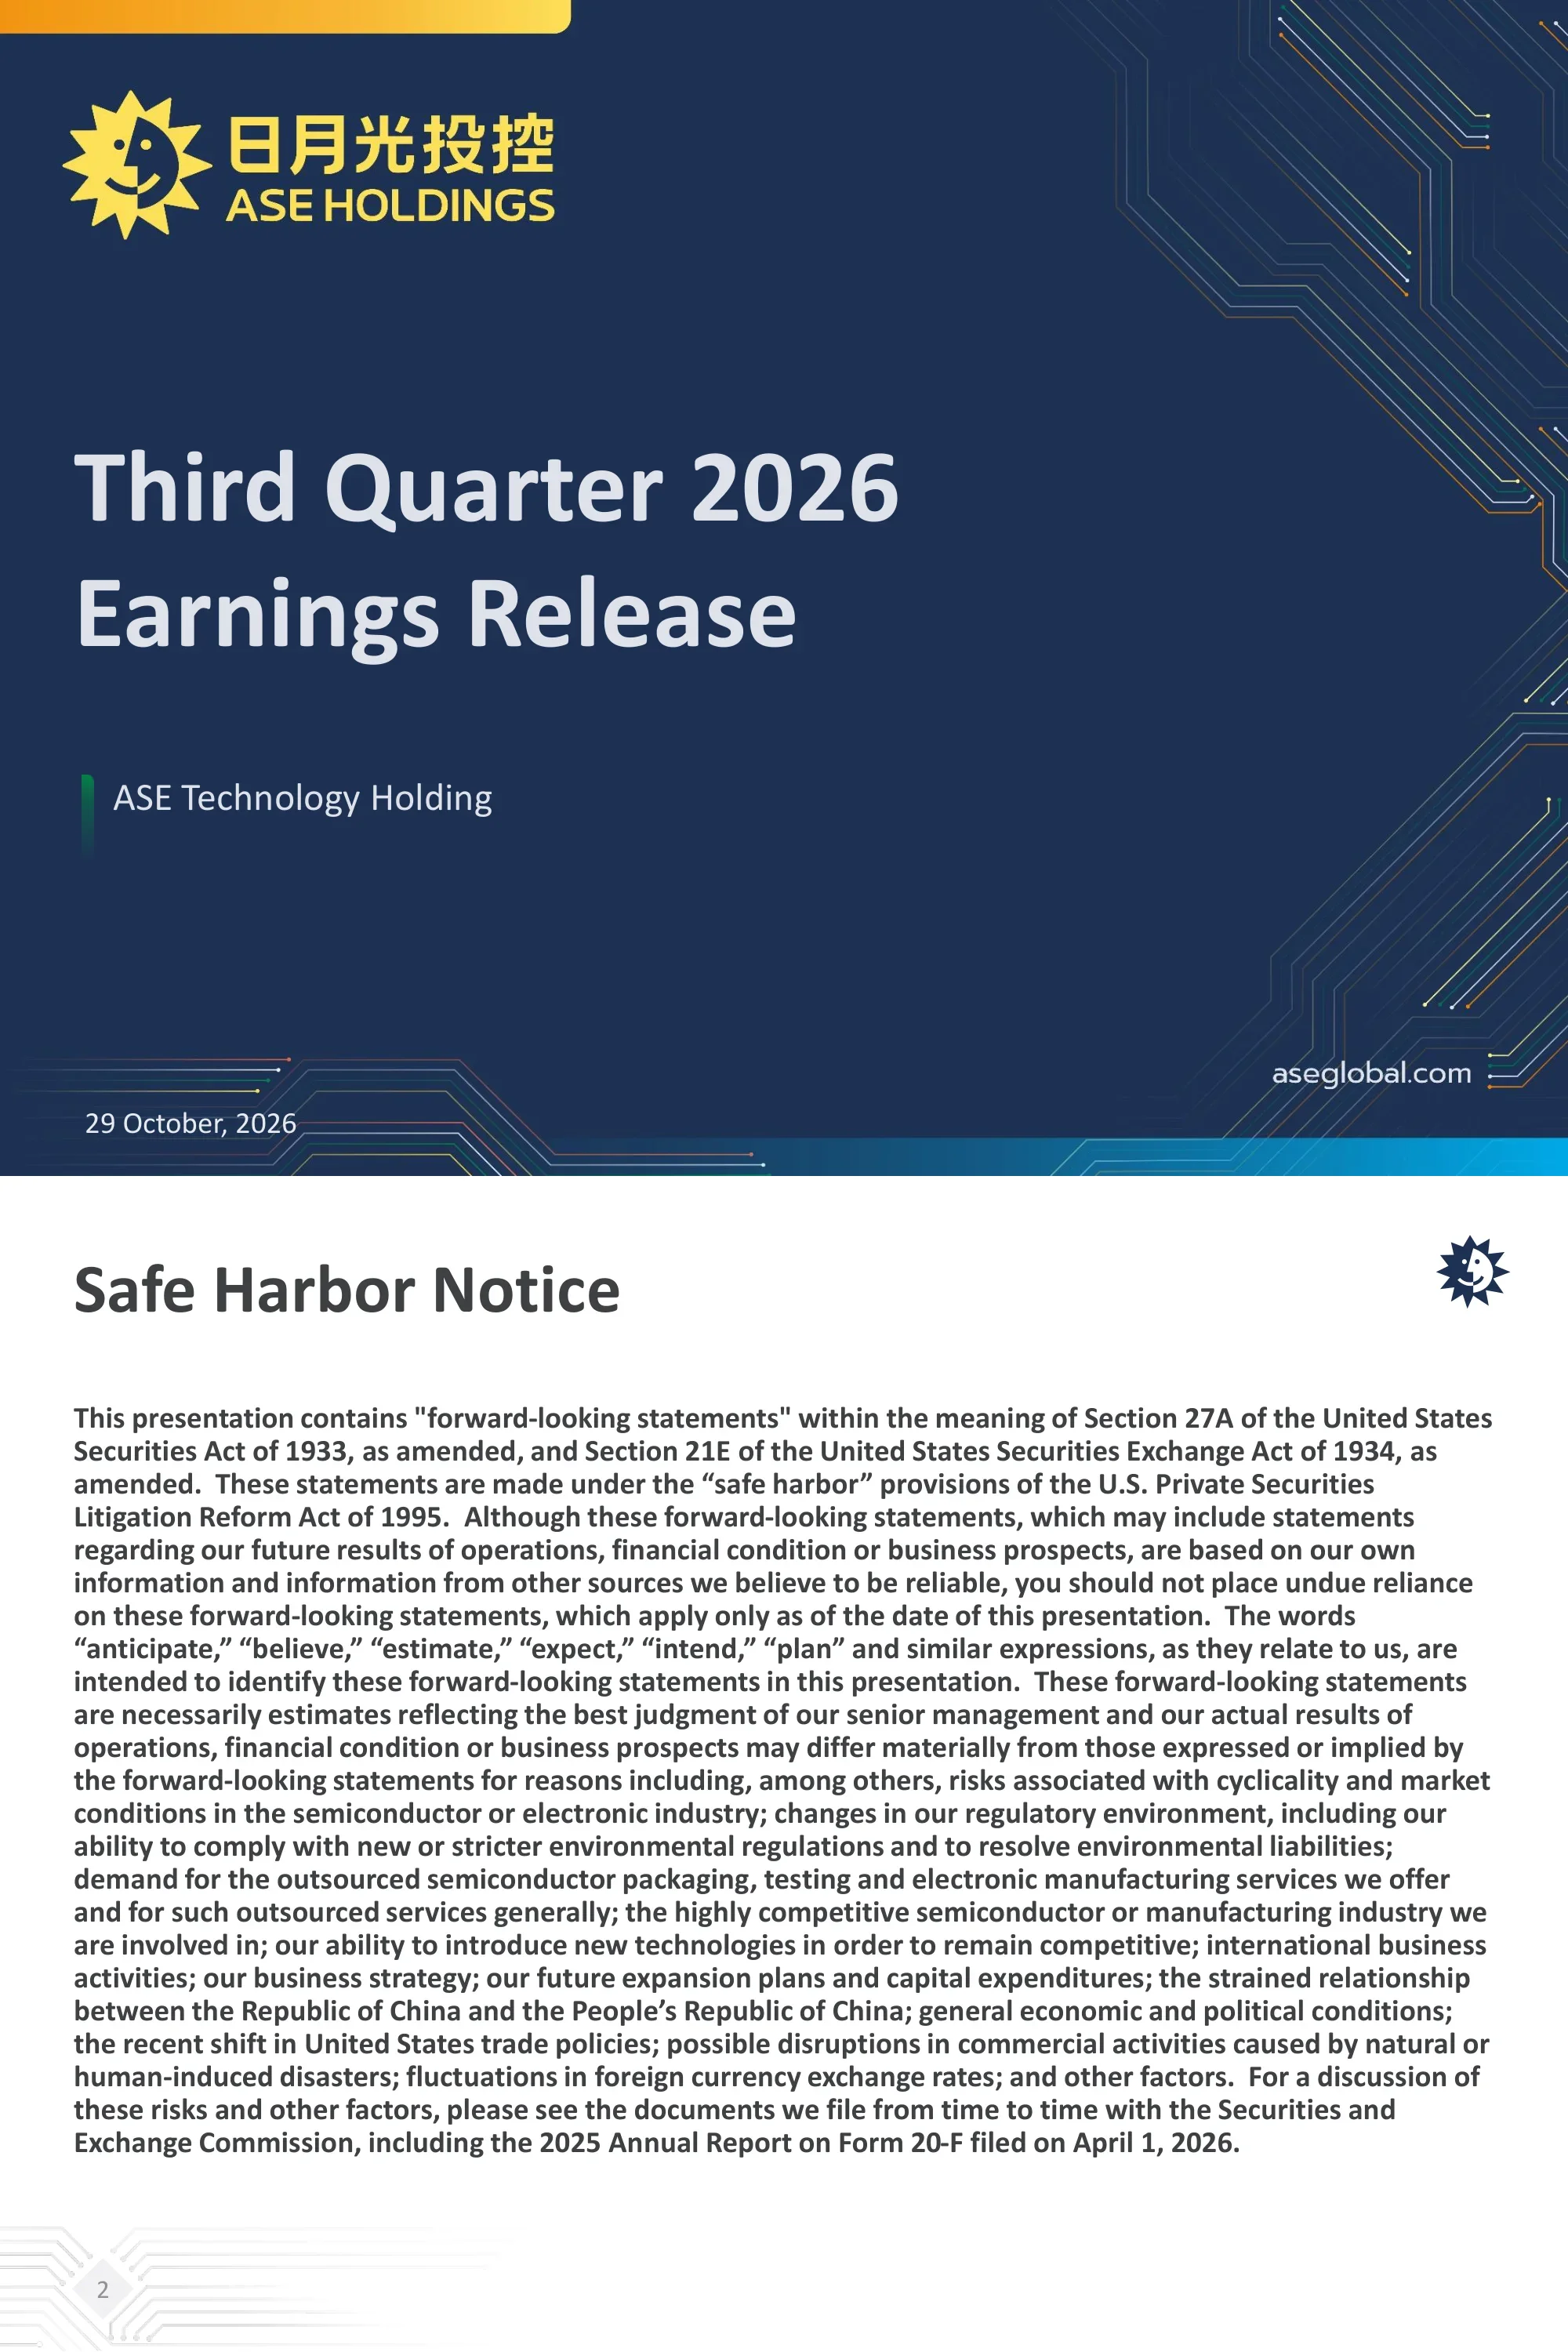
Cover slide for ASE Technology Holding's Third Quarter 2026 Earnings Release, dated 29 October 2026, with the bilingual 日月光投控 / ASE HOLDINGS logo and the aseglobal.com web address.
Full-bleed dark navy background with the sun-face logo top left, a large two-line white title on the left, presenter line with a green accent bar below, date bottom left, and circuit-trace line art along the right and bottom edges.
Forward-looking statements disclaimer under Section 27A of the US Securities Act of 1933 and Section 21E of the Exchange Act. Lists risk factors including semiconductor industry cyclicality, environmental regulation, demand for outsourced packaging, testing and EMS services, competition, capex and expansion plans, cross-strait relations between the ROC and PRC, recent shifts in US trade policy, natural or human-induced disasters and FX fluctuations, and refers to the 2025 Annual Report on Form 20-F filed on April 1, 2026.
White slide with a bold dark-grey title top left, small navy logo top right, and a single dense justified paragraph of bold body text filling the page; page number in a diamond at bottom left.
Unaudited consolidated income statement in NT$ million. Q3 2026 net revenues were 244,161 (ATM 150,593 or 61.7%, EMS 92,997 or 38.1%, others 571), up 28% QoQ from 191,064 and 45% YoY from 168,569. Gross profit 53,967 (22.1% margin, +87% YoY); operating income 33,142 (13.6%, +57% QoQ, +151% YoY); pretax income 32,710; income tax expense (4,831); non-controlling interests (883); net income attributable to shareholders of the parent 26,996 (11.1%, +28% QoQ, +148% YoY). Basic EPS NT$6.13 (Q2: 4.80; Q3 2025: 2.50) and diluted EPS NT$5.84 (Q2: 4.61; Q3 2025: 2.41).
Financial table with line items on the left and three period columns (Q3/2026, Q2/2026, Q3/2025), each paired with a percent-of-revenue column, followed by QoQ and YoY growth columns; negative values shown in red parentheses.
Seven-quarter chart (Q1/25 to Q3/26) of revenue in NT$ billion stacked by ATM and EMS, with gross and operating margin lines. ATM revenue rose from 85.6 to 150.6 and EMS from 61.9 to 93.0. Gross margin climbed from 16.8% (Q1/25) through 17.0%, 17.1%, 19.5%, 20.0% and 21.0% to 22.1% in Q3/26; operating margin rose from 6.5% through 6.8%, 7.8%, 9.9%, 10.1% and 11.1% to 13.6%.
Combo chart with stacked columns on the left axis (0–250 NT$ billion) and two margin lines on the right axis (0–30%); legend box beneath the chart.
Unaudited ATM segment income statement in NT$ million. Q3 2026 total ATM net revenues 151,485 (+20% QoQ, +51% YoY): packaging 122,945 (81.2%, +53% YoY), testing 26,302 (17.4%, +43% YoY), direct material 2,148 and others 90. Gross profit 46,412 with a 30.6% margin (vs 27.3% in Q2 and 22.6% a year earlier, +104% YoY); operating income 30,243, a 20.0% margin (+53% QoQ, +178% YoY). A footnote says ATM revenue includes intercompany revenue between ATM and EMS that is eliminated at the holding company level.
Same quarterly comparison table format as page 3 with Q3/2026, Q2/2026 and Q3/2025 columns plus QoQ and YoY; footnote at the bottom.
Seven-quarter ATM chart in NT$ billion: revenue grew from 86.7 (Q1/25) to 92.6, 100.3, 109.7, 112.4, 126.1 and 151.5 (Q3/26). Gross profit rose from 19.6 to 46.4, and gross margin moved from 22.6%, 21.9%, 22.6%, 26.3%, 26.0% and 27.3% to 30.6%.
Column chart with grey revenue bars topped by purple gross-profit segments on the left axis (0–200) and a yellow gross margin line on the right axis (10%–50%); legend below.
100% stacked chart of ATM revenue by end application over seven quarters. Communication fell from 48% (Q1/25) to 46%, 45%, 45%, 43%, 41% and 38% (Q3/26); computing rose from 22% to 24%, 25%, 25%, 27%, 30% and 34%; automotive, consumer and others held at about 30% before easing to 29% and 28%.
Seven 100% stacked columns with percentage labels inside each segment; legend box below the chart.
100% stacked chart of ATM revenue by service type. Bump/FC/WLP/SiP (advanced packaging) rose from 46% in Q1/25 to 47%, 48%, 49%, 49%, 49% and 51% in Q3/26; wirebonding declined from 28% to 24%; testing was 17% in Q3/26 (18–19% in earlier quarters); others 6% and material 2%.
Seven 100% stacked columns with the legend box placed to the right of the chart.
EMS segment table in NT$ million: Q3 2026 net revenues 93,469 (+42% QoQ from 65,789; +35% YoY from 69,022); gross profit 7,793 at an 8.3% margin (8.9% in Q2, 9.2% a year earlier); operating income 3,111 at 3.3% (+98% QoQ, +22% YoY). Below it, a 100% stacked chart of EMS revenue by application for Q1/25 to Q3/26 shows consumer at 41% in Q3/26, computing up from 10% to 21%, communication down from 33% to 19%, industrial 12%, automotive 6% and others 1%.
Split layout: compact three-row comparison table at the top, seven-column 100% stacked chart underneath, and a six-item legend at the bottom.
Unaudited balance sheet in NT$ million, Sept. 30, 2026 vs Jun. 30, 2026: cash and cash equivalents 88,421 (91,292); current financial assets 19,517; non-current financial assets and equity-method investments 70,189; property, plant and equipment 621,962 (517,715); total assets 1,244,785 (1,071,443). Total interest-bearing debt rose to 406,461 from 306,230, including long-term loans and bills of 276,633 and bonds payable of 42,201. Total liabilities 790,863; total equity including non-controlling interest 453,922. Quarterly EBITDA 57,963 (45,779); current ratio 1.16 (1.07); net debt to equity 0.66 (0.47). A footnote defines EBITDA.
Two-column comparison table grouped into assets, debt and liabilities, and ratios, with bold subtotals and an EBITDA definition footnote.
Clustered column chart in US$ million comparing equipment capex with EBITDA for seven quarters: Q1/25 892 vs 843, Q2/25 992 vs 879, Q3/25 779 vs 1,095, Q4/25 733 vs 1,242, Q1/26 1,003 vs 1,210, Q2/26 1,695 vs 1,450 and Q3/26 2,104 vs 1,814. Capex has exceeded EBITDA for the last two quarters.
Paired grey and purple columns per quarter with value labels above, a single y-axis from 0 to 2,500 and a small legend below.
Guidance based on an exchange rate of 31.9 NT dollars per US dollar (the same as in Q3 2026): consolidated Q4 2026 revenue in NT dollar terms should grow 6% to 8% quarter over quarter, gross margin should be 23% to 24%, and operating margin 14.5% to 15.5%.
Text slide with an introductory assumption paragraph, a bold 'Consolidated' heading and three square-bulleted guidance statements.
Segment guidance on the same 31.9 NT$/US$ assumption: ATM Q4 2026 revenue should grow 11% to 13% quarter over quarter and ATM gross margin should rise by 100 to 200 basis points QoQ; EMS Q4 revenue should be flattish QoQ with an operating margin of around 2%.
Text slide repeating the assumption paragraph, then two bold section headings (ATM, EMS), each with two square-bulleted guidance points.
Closing slide with 'Thank you' centred on the navy background, the yellow sun logo top right and the aseglobal.com address bottom right.
Full-bleed navy background matching the cover, centred white text, logo in the corner and circuit line art along the bottom and right edges.
Unaudited eight-period income table in NT$ thousand (Q1 2025 to Q4 2025, FY 2025, Q1 2026 to Q3 2026) with reported and PPA-excluded lines. FY 2025 revenue was 645,387,638, operating income 50,755,532 and net income attributable to the parent 40,658,196 (basic EPS NT$9.37, diluted NT$8.89). Q3 2026 revenue 244,161,159; operating income 33,141,882 (33,933,592 excluding PPA); net income attributable to the parent 26,996,438 (27,762,503 excluding PPA); total PPA expenses 780,675; diluted EPS NT$5.84 (NT$6.01 excluding PPA). Footnotes explain that PPA expenses come from purchase price allocation for the ASE/SPIL, ASE/Infineon and ASE/ADI transactions and for the USI/Asteelflash, USI/Hirschmann and USI/Eugenlight Technologies transactions.
Dense full-width table with black reported lines and blue PPA-related lines across eight columns; two long footnotes beneath.
이 슬라이드 및 기본 프레젠테이션 콘텐츠에 대한 일반적인 질문.
ASE Technology Holding reported consolidated net revenues of NT$244.2 billion for Q3 2026, up 28% from Q2 2026 and 45% from Q3 2025. Gross margin was 22.1%, operating margin 13.6%, net income attributable to shareholders of the parent was NT$27.0 billion, and diluted EPS was NT$5.84.
This English deck was filed on Taiwan's Market Observation Post System (MOPS, 公開資訊觀測站) for ASE's Q3 2026 investor conference (法說會) held on 29 October 2026. MOPS also carries a Chinese-language version of the 法說會 materials; this page uses the English file.
ATM stands for assembly, testing and material, ASE's core semiconductor packaging and test business, which produced NT$151.5 billion of revenue at a 30.6% gross margin in Q3 2026. EMS stands for electronic manufacturing services, mainly run through its subsidiary USI, which produced NT$93.5 billion at an 8.3% gross margin.
Assuming 31.9 NT dollars per US dollar, ASE guided consolidated Q4 2026 revenue up 6% to 8% QoQ, with gross margin of 23% to 24% and operating margin of 14.5% to 15.5%. ATM revenue should grow 11% to 13% QoQ with gross margin up 100 to 200 basis points, while EMS revenue should be flattish with an operating margin of around 2%.
Computing rose from 22% of ATM revenue in Q1 2025 to 34% in Q3 2026, while communication fell from 48% to 38%. Bump, flip chip, wafer-level packaging and SiP reached 51% of ATM revenue in Q3 2026, up from 46% in Q1 2025.
Yes. The page offers the original 15-page PDF and a PPTX conversion, so you can edit the quarterly comparison tables, stacked revenue-mix charts and guidance slides or reuse the layout for your own earnings presentation.
PPA (purchase price allocation) expenses are the profit-and-loss effects of acquisition accounting from deals such as ASE/SPIL, ASE/Infineon and ASE/ADI, and USI's acquisitions of Asteelflash, Hirschmann and Eugenlight Technologies. Excluding total PPA expenses of about NT$781 million, Q3 2026 diluted EPS would be NT$6.01 instead of NT$5.84.
It suits semiconductor investors and analysts tracking OSAT and AI-driven packaging demand, IR and finance teams designing quarterly results decks, and anyone who wants a clean example of how a Taiwan-listed company structures its 法說會 slides.
Original English PDF filed for the 29 October 2026 investor conference (法說會).

Create Your Own Slides
Turn your ideas into professional presentations in seconds with 2slides AI.
전문 디자인을 참조하고, 스타일을 선택하며, 완벽한 텍스트 렌더링으로 슬라이드를 생성하세요. Nano Banana로 구동—지금 프레젠테이션 만들기를 시작하세요.


