
수록 모음: 투자자 발표자료 사례 · 호주 기업 IR 자료 예시
ANZ FY2026 Full Year Results Presentation — ANZ Group Holdings (Australia and New Zealand Banking Group) Results Presentation & Investor Discussion Pack for the full year ended 30 September 2026, lodged with the ASX on 9 November 2026. All amounts are in Australian dollars (A$, shown in the deck as $m / $b) unless stated otherwise. The 111-page deck pairs the CEO (Nuno Matos) and CFO (Farhan Faruqui) presentations with a detailed investor discussion pack: cash profit of $7,591m (+10% on FY25 excluding significant items, +31% reported), statutory profit of $7,270m, revenue of $22,479m (+1%), expenses down 7% to $11,074m, a cost-to-income ratio of 49.26%, ROTE of 11.56%, a Level 2 CET1 ratio of 11.99%, and a full-year dividend of 166 cents per share.
이 프레젠테이션의 표지를 스타일 참고 자료로 사용해 내 콘텐츠로 슬라이드를 만듭니다. 아래에서 원하는 페이지를 골라 그 레이아웃을 참고로 쓸 수도 있습니다.
빠른 탐색
태그
슬라이드 공유
ANZ FY2026 Full Year Results Presentation — ANZ Group Holdings (Australia and New Zealand Banking Group) Results Presentation & Investor Discussion Pack for the full year ended 30 September 2026, lodged with the ASX on 9 November 2026. All amounts are in Australian dollars (A$, shown in the deck as $m / $b) unless stated otherwise. The 111-page deck pairs the CEO (Nuno Matos) and CFO (Farhan Faruqui) presentations with a detailed investor discussion pack: cash profit of $7,591m (+10% on FY25 excluding significant items, +31% reported), statutory profit of $7,270m, revenue of $22,479m (+1%), expenses down 7% to $11,074m, a cost-to-income ratio of 49.26%, ROTE of 11.56%, a Level 2 CET1 ratio of 11.99%, and a full-year dividend of 166 cents per share.
레이아웃, 주요 콘텐츠 및 시각적 요소를 포함한 각 슬라이드 페이지의 상세 보기.
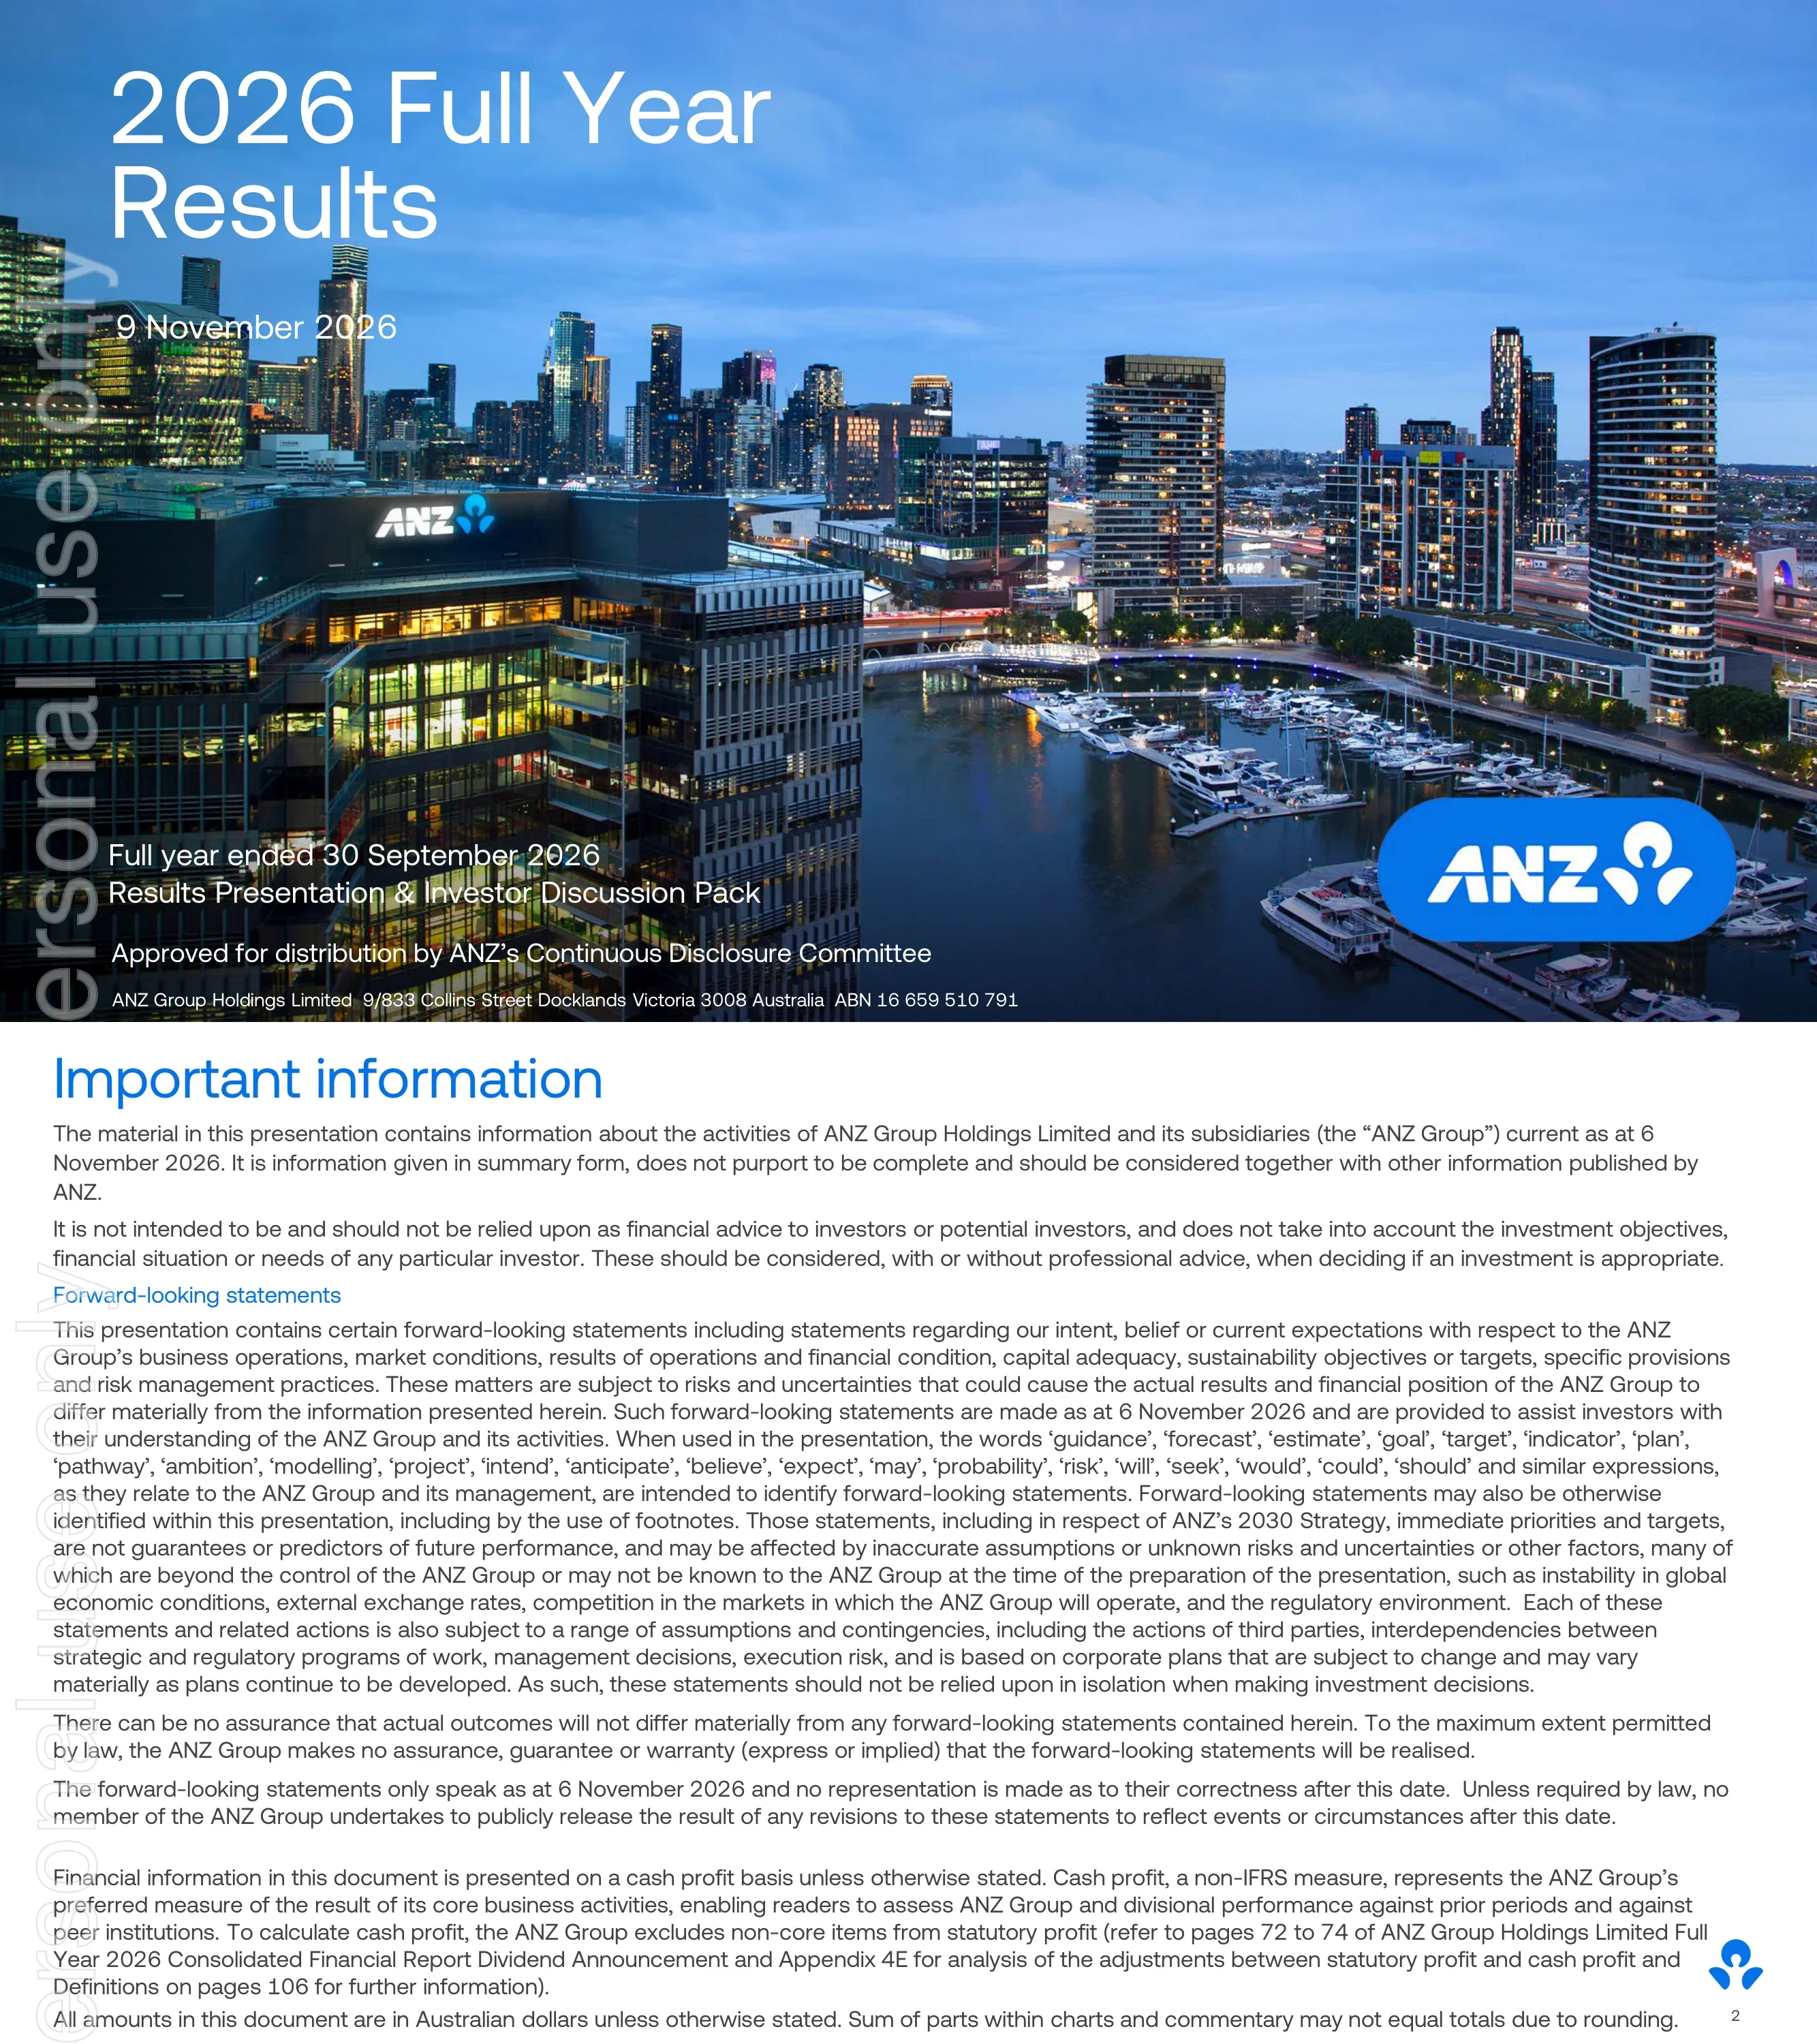
Cover for ANZ Group Holdings' 2026 Full Year Results, dated 9 November 2026, for the full year ended 30 September 2026 (Results Presentation & Investor Discussion Pack), approved for distribution by ANZ's Continuous Disclosure Committee.
Full-bleed dusk photograph with large white headline top-left, date beneath, descriptive lines and company address bottom-left, and ANZ logo in a rounded blue badge bottom-right.
Disclaimer stating information is current as at 6 November 2026, describing forward-looking statements and cash profit as a non-IFRS measure, and noting all amounts are in Australian dollars unless otherwise stated.
Dense full-width text page with blue title and a blue sub-heading for forward-looking statements.
Agenda: CEO presentation (p4), CFO presentation (p25), and Investor Discussion Pack sections — Corporate overview (40), Additional financial information (56), Treasury (68), Risk management and Housing (81), Climate & Nature Strategy (104), Further information (111).
Full-bleed atrium interior photo with a translucent white panel on the lower left listing sections and page numbers.
Section divider opening the Chief Executive Officer presentation by Nuno Matos.
Minimal white slide with large blue headline top-left, presenter name and title bottom-left, ANZ logo bottom-right.
Strategy-on-a-page with four pillars (Customer first, Simplicity, Resilience, Delivering value), five immediate priorities, broader initiatives and metrics such as Strategic NPS, cost-to-income, FY26 cost savings, Suncorp Bank synergies, CET1, ROTE and Revenue/RWA, underpinned by Culture, People and Technology.
Blue background matrix: four pillar columns with icons, a white highlighted band of immediate priorities, then rows for initiatives and metrics, with enablers along the bottom.
Three charts: global investment in clean energy, defence and AI (USD trn, rising to ~15 by 2030); Australian vs US 10-year bond yields since 2000; and GDP growth forecasts for 2026-2028 (e.g. Australia 2.0/1.3/2.0%, Asia 5.2/4.0/3.7%, China 4.6/4.5/4.4%).
Blue header band above three side-by-side panels in white and light-blue tones, each with its own chart and legend; sources in footer.
ROTE rose to 11.56% from 10.47% (8.79% including FY25 significant items); dividend per share held at 166 cents with franking lifted to 75% (interim) and 80% (final); Level 2 CET1 ratio 11.99% vs 12.03%.
Three equal columns (Financial performance, Shareholder outcomes, Balance sheet strength), each a two-bar FY25 vs FY26 chart, with a small franking table below.
New values launched; Suncorp Bank migration 60% complete (85% expected by March 2027, completion by June 2027); single customer front-end 45% complete (80% by March 2027); $902m gross cost savings vs $875m estimate and ~3,500 role reductions complete; on track with the Root Cause Remediation Plan.
Numbered vertical list of five light-blue rounded cards connected to circular number markers on a curved line at left.
ANZ's four new values: Put customers first, Deliver with excellence, Own the outcome, and Work as one, each with a one-line explanation.
Blue background with four evenly spaced colourful rounded-square icon tiles, each with a value name and short description below.
Goal to complete a safe and secure migration of Suncorp Bank to ANZ by June 2027; integration activity 34% completed in 1H26 and 60% by 2H26, with 85% expected by March 2027.
Blue header, light-blue left panel with large goal statement, white right panel with donut progress chart and legend.
Goal to deliver the single customer front-end to 8 million Retail and Small Business customers by September 2027; execution 13% complete at 1H26 and 45% at 2H26, with 80% expected by March 2027.
Same template as page 10: goal statement on left, donut progress chart on right.
Delivered $902m in gross cost savings in FY26 ($392m in 1H26 and $510m in 2H26), exceeding guidance of $800m at FY25 results and $875m at 1H26 results.
Left light-blue panel with headline claim; right white panel with three-column bar chart comparing guidance to actual.
On track to deliver the Root Cause Remediation Plan: second and third Promontory independent assurance reports released, foundations built under the PACT program, and most deliverables transitioning from Design to Implement.
Left goal panel; right panel with a vertical Design-Implement-Embed process flow beside a grey bullet box.
Restates the four strategic pillars — Customer first, Simplicity, Resilience, Delivering value — with descriptions, plus core enablers Culture, People and Technology.
Blue slide with ANZ 2030 lockup and tagline at top, four icon columns with text, and enablers row at bottom.
6.57m customers, MFI share 11.3% (-0.4%), NPS +5.2 (+3.5 pts); save and transact deposits up 2% to $103b with total deposits +5%; home lending up 4% to $275b while proprietary origination fell from 32% to 29%.
Left light-blue KPI column with large numbers; right white area with two stacked bar charts (deposits, home lending) and circled origination percentages.
590k customers, MFI share 17.1% (+0.7%), NPS -5.0 (-3.2 pts); save and transact deposits flat at $85b (total deposits +6%); lending up 6% to $156b ($84b home loans, $72b business and private bank loans).
Same divisional template: KPI column left, deposits and lending stacked bars right.
1.25m customers, retail MFI share 1.9% (-0.6%), retail NPS +11.5 (-5.0 pts); save and transact deposits down 7% to $31b (total deposits -3%) and lending down 1% to $72b.
Divisional template with KPI column left and two stacked bar charts right.
Ranked #2 in Australia and #1 in New Zealand for relationship strength and best bank for corporate banking in Asia; operational/at-call deposits up 8% to $135b (+10% constant currency, total deposits +24% cc); Markets revenue $2,067m (-3% reported, +1% cc).
Left panel with ranking statement; right white area with deposit bar chart and stacked Markets revenue chart, using reported and constant-currency pills.
2.72m personal and business customers; personal MFI 33.6% and NPS +26.8, business MFI 31.3% and NPS -2.5; save and transact deposits up 4% to NZ$64b and lending up 5% to NZ$145b, with home loan proprietary origination steady at 39%.
KPI column split into Personal and Business blocks; right side with NZD deposit and lending stacked bars.
AI framework aligned to the four ANZ 2030 pillars, governed by the Enterprise AI Council and monitored by an Enterprise AI Control Plane, underpinned by AI architecture and platforms, AI-ready data and AI skills and literacy.
Three horizontal tiers: four outlined pillar cards, a navy full-width control-plane bar, and three grey foundation tiles.
Three priority use cases: tools for frontline bankers (>50% AI-assisted interactions in Business & Private Bank), contact centre re-platforming (>90% AI-assisted interactions expected) and AI-accelerated engineering (2x software engineering capacity on SCFE deliverables).
Three columns in graduated blue tints, each with a navy header card, bullets and a large blue headline statistic.
Control plane being implemented to scale AI safely with humans in control, across five capabilities: common point of control, visibility across all AI, ongoing governance, built-in safety guardrails, and auditability; the initial MVP builds on the AI Council and existing controls.
Five light-blue rounded columns with blue headings and bullets, plus an outlined summary box beneath.
Three foundations: AI architecture and platforms (hybrid AI platform, document intelligence, knowledge management, agentic workflow), AI-ready data foundations, and AI skills — with 9,000+ enrolments in Data & Responsible AI fundamentals and 5,000+ AI Masterclass attendees.
Three columns with icons, italic descriptors and blue sub-headings; statistics in the third column.
CEO closing messages: transformation is moving at pace and shareholders are being rewarded; continuing to invest for growth in line with ANZ 2030; the business is gaining momentum.
Blue slide with a large white rounded card containing three icon-led statements separated by thin dividers.
Section divider opening the Chief Financial Officer presentation by Farhan Faruqui.
Minimal white divider matching page 4 with presenter name bottom-left and logo bottom-right.
Cash profit $7,591m, up 10% on FY25's $6,896m excluding significant items ($5,787m reported); Revenue/Avg RWA 4.83% (4.75%), cost-to-income 49.26% (53.42%), ROTE 11.56% (10.47%), CET1 11.99% (12.03%).
Left light-blue panel with stacked cash profit bar chart; right panel with four small FY25 vs FY26 bar pairs.
Statutory profit $7,270m (+23%); cash profit $7,591m (+31%, +32% cc); excluding FY25 significant items of $1,109m, cash profit +10%; revenue $22,479m (+1%), expenses $11,074m (-7%), profit before provisions $11,405m (+10%), cost-to-income -416bps, ROTE +109bps.
Financial table with FY25, FY26, reported change and italic constant-currency columns; adjusted rows shaded light blue.
Revenue bridge from FY25 $21,899m ($22,184m excluding Panin impairment) through -$351m FX to $21,833m constant currency, then +$467m net interest income, +$78m fees, +$72m other income and +$29m Markets to FY26 $22,479m (+1% reported, +3% cc).
Horizontal waterfall chart on a light-blue rounded panel with reported and constant-currency arrows across the top.
Half-on-half bridge: 1H26 $11,204m, FX -$142m, net interest income +$347m, fees +$28m, other income -$43m and Markets -$119m to 2H26 $11,275m (+1% reported, +2% cc).
Waterfall chart in the same style as page 28.
Group NIM ex Markets rose 2bps each half to 230bps; Group NIM flat at 153bps in 2H26 (asset pricing -4, deposit pricing +2, wholesale funding +1, capital and replicating portfolio +5, mix -3, Markets -1). FY27: 4bps replicating portfolio benefit expected; 1H27 NIM ex Markets broadly stable.
Left panel with three-bar NIM ex Markets chart; right waterfall with blue annotation boxes and an FY27 expectations callout at top right.
Customer deposits (ex Markets) grew 6% (+8% cc) from $633b to $670b, led by Institutional +$25b; by type, transact $230b, save $179b, term deposits $193b (+14%) and home loan offset $68b (+9%).
Divisional waterfall on the left; stacked deposits-by-type column pair with reported/cc pills on a light-blue right panel.
Net loans and advances (ex Markets) rose 4% (+6% cc) from $782b to $811b, with Australia Retail +$11b, Business & Private Bank +$9b and Institutional +$15b; by geography Australia $604b, New Zealand $132b (NZ$162b) and International $76b (+19%).
Same structure as page 31: division waterfall left, geography stacked bars right.
First-half Markets revenue up 3% to $1,108m but second half down 10% to $959m; FY26 total $2,067m vs $2,139m (-3% reported, +1% cc), with Australia $646m, New Zealand $272m and International & PNG $1,149m.
Two pairs of stacked columns by product for first and second halves, plus a geography stacked chart on a light-blue right panel.
Expenses fell from $11,849m (ex significant items) to $11,074m (-7% reported, -4% cc): FX -$302m, inflation +$286m, investment -$53m, other +$278m (incl. NZ litigation and ANZ Worldline $142m), productivity -$984m. FY27 expenses expected flat to the pro forma FY26 cost base of ~$11.26b.
Expense waterfall with blue explanation boxes, a pale pro forma bar at the end and an FY27 expectations callout.
Individual provision loss rate 5bps in 2H26 vs an 11bps long-run rate; IP charge $212m in 2H26 ($321m new and increased less $109m writebacks); consumer 90+ DPD at 0.95% for Australian home loans, 0.83% NZ home loans and 0.46% Australian cards; wholesale control list trending down.
Four-quadrant grid: loss rate bars, IP charge bars, consumer 90+ DPD line chart and control list line chart.
Collective provision balance rose to $4,530m (CP coverage 1.20%) after a $96m 2H26 charge, $2.1b above the base case; 53% of scenario weights are on downside outcomes; CP loss coverage of 12.6 years vs 5.0-8.9 years for major bank peers.
Left: coverage ratio strip above stacked CP balance bars and a bullet commentary box; right light-blue panel with peer comparison bars.
Level 2 CET1 moved from 12.39% (Mar 26) to 11.99% (Sep 26): cash profit +80bps, net dividend -53bps, underlying RWA -24bps, capital deductions/IRRBB/other -42bps (incl. -29bps IRRBB), capital floor +7bps, ANZ Worldline -8bps; Level 1 CET1 12.60%.
Waterfall bridge on light-blue panel with Level 1 boxes above start and end bars and blue annotation boxes.
Term wholesale funding issuance of $40b in FY26 vs maturities of $34b (FY27) and $32b (FY28); NSFR 116% with a $109b surplus; average LCR 132% with a $75b surplus, against a 100% regulatory minimum.
Three bar charts across a light-blue panel: stacked funding profile, NSFR bars and LCR bars with a dashed minimum line.
CFO priorities for FY27: sustaining revenue momentum, maintaining cost discipline, and efficient funding and capital allocation.
Blue slide with a white rounded card listing three icon-led statements.
Section divider for the Corporate overview part of the Investor Discussion Pack.
White divider with large blue headline and section label bottom-left.
History dating to 1828 as a Big Four bank; operating in 29 markets with >11m customers; assets of $1,365b including $861b net loans and advances; liabilities of $1,293b including $815b customer deposits; market capitalisation $115.5b with ~37% retail and ~63% institutional shareholding (as at 30 September 2026).
Black-and-white heritage building photo with a white text panel on the left containing icon-labelled facts.
Repeats the ANZ 2030 vision and four strategic pillars with Culture, People and Technology enablers to open the corporate overview.
Identical layout to page 14: blue background, four icon columns, enablers row.
Targets: increase ROTE towards 12% by FY28 and towards 13% by FY30; achieve a cost-to-income ratio in the mid-40s percent by FY28 sustained to FY30; including estimated Suncorp Bank synergies of $500m with full run-rate in FY29.
Blue header with a white card listing three check-marked target statements, key phrases highlighted in blue.
MFI share and NPS by division: Australia Retail 11.3% / +5.2, Business & Private Bank 17.1% / -5.0, Suncorp Bank 1.9% / +11.5, NZ Retail 33.6% / +26.8, NZ Business 31.3% / -2.5, plus NPS peer rankings and Institutional relationship leadership.
Six-column KPI scorecard in a white card on blue, with large numbers, red/grey change text and ranking notes.
Cost-to-income 49.26% (-416bps), $902m gross cost savings, $108m Suncorp Bank synergies since acquisition, CET1 11.99% (-4bps), Promontory assurance reports released, ROTE 11.56% (+109bps), Revenue/RWA 4.83% (+8bps).
Three-column KPI scorecard headed by pillar names and icons, with two rows of large metrics.
Australia Retail priorities: differentiated propositions (mass affluent, people relocating to Australia), stronger proprietary origination (up to 50% more lenders in branches over five years) and elevated channel experiences (single customer front-end, banker tools, contact centre re-platforming).
Blue slide with a white card of three icon-topped columns separated by thin blue rules.
Grow bankers by close to 50% with better tools and a Commercial Bankers Academy; extend Transactive Global to the middle market and the single customer front-end to small business by end FY27; build on Private Bank foundations.
Same three-column white card template as page 46.
Targeted acquisition of financial institutions, corporates linked to Australia and New Zealand and intra-Asia multinationals; extending leadership in payments, cash management and markets flow; a new capital management structure with originate-to-distribute and balance sheet recycling.
Three-column white card template with icons.
New Zealand priorities: re-platformed customer journey, refreshed propositions for affluent and small business segments, and investment in business bankers' tools.
Three-column white card template with icons.
A formal simplification program across four areas: automation and artificial intelligence, external spend optimisation, organisational change, and investment portfolio review.
Blue slide with four white rounded quadrant cards around a central blue circle.
Strong capital, funding and liquidity, one of only 13 banks globally in the AA band from all three rating agencies; reshaped lending book with 83% of wholesale lending to investment-grade counterparties; non-financial risk management aimed at 'a better run bank'.
Three-column white card on blue with icons for capital, credit quality and non-financial risk.
Suncorp Bank integration: estimated $500m pre-tax annual cost synergies at full run-rate from FY29 (~$108m achieved, ~$392m remaining) and estimated $745m integration costs (~$565m spent, ~$180m remaining, ~$165m expected in FY27).
Two large blue cards side by side, each with a hero number and a horizontal progress bar split into achieved and remaining.
Distribution of FY26 revenue: 65% to customers and debt investors, 10% to people, 7% to suppliers and partners, 5% income tax, 1% major bank levy and 12% to shareholders.
Left text column describing each stakeholder group; right light-blue panel with a large donut chart and legend.
Three priorities with 2035 visions — financial inclusion, banking the First Nations economy (forecast at $50b annual revenue within a decade) and cultural intelligence; 2026 outcomes include surpassing $180m cumulative lending through the First Nations Guarantee and reaching 258 people via First Nations Foundation events.
Intro text above three column cards with blue headers, vision and outcomes sections; Aboriginal artwork border at lower right.
Four focus areas with FY26 outcomes: 28 Māori Business Champions and more than NZ$104m in Commercial & Agri deals, 16 Māori Regional Champions, a Māori Investor Forum (Māori entities control almost NZ$130b in assets), and 17,792 Māori language and cultural training modules completed.
Blue header text, four photographs in a row with white captions and descriptive text columns beneath.
Section divider for additional financial information.
White divider with blue title and section label.
FY26 revenue of $22,479m split Institutional 28%, Australia Retail 25%, Business & Private Bank 20%, New Zealand 15%, Suncorp Bank 7%, Other 5%; half-yearly revenue of $11.0b, $10.9b, $11.2b and $11.3b; expenses of $5.7b, $7.1b, $5.5b and $5.5b.
Left grey panel with revenue composition donut; right two stacked half-yearly bar charts for revenue and expenses.
Investment spend fell from $1,703m to $1,461m (Growth & Simplification $736m, Digital Front End $214m, Regulatory/Compliance/Risk $402m, Asset Lifecycle $109m); 71% expensed ($1,030m); capitalised software $1,090m; amortisation $258m; average amortisation period 3.9 years.
Stacked column chart on the left and a two-column data table in a grey card on the right.
Divisional mix over Sep 24 to Sep 26 for EAD (rising to $1,364b), RWA ($486b), net loans and advances ($861b) and customer deposits ($815b), with Institutional the largest share of EAD (47%) and deposits (41%).
Four small-multiple 100% stacked column charts in a row with a shared divisional legend.
Divisional lending Mar 25 to Sep 26: Australia Retail $280b, Business & Private Bank $156b, Suncorp Bank $72b, New Zealand NZ$146b and Institutional $234b at Sep 26.
Five small-multiple stacked column charts, each with four half-year bars and its own legend.
Divisional deposits at Sep 26: Australia Retail $180b, Business & Private Bank $142b, Suncorp Bank $55b, New Zealand NZ$120b and Institutional $336b (including $145b Markets and $135b PCM).
Five small-multiple stacked column charts matching page 60.
Revenue/average RWA for 2H26: Group 4.79%, Australia Retail 5.51%, Business & Private Bank 5.78%, Suncorp Bank 4.47%, New Zealand 5.60%, Institutional 3.34%; average Group RWA $470b.
Six small-multiple bar trios (2H25, 1H26, 2H26) in two rows: revenue/RWA on top and average RWA below.
Customer franchise revenue $2.8b in 2H26; ROTE 11%; core lending $182b with NIM 1.35%; operational/at-call deposits $135b; investment-grade share of core lending EAD 79%; IP loss rate 0.04% vs 0.32% FY11-17 average.
Six-panel grid of bar and line combination charts, with broken axes separating Sep 19/2H19 baselines.
Institutional NIM ex Markets fell from 220bps to 211bps in 2H26 (funding -5, deposit mix -3, lending -1); lending NIM 135bps and deposits NIM 69bps; risk-adjusted NIM 337bps overall, Australia & PNG 356, New Zealand 384, International 286.
Left: NIM driver waterfall and two bar series; right grey panel with four small geography bar charts.
Total Markets revenue FY23-FY26: $2,107m, $2,184m, $2,139m and $2,067m (FY26: customer franchise $1,389m, balance sheet $666m, DVA $12m); customer franchise revenue $628m in 2H26 and $761m in 1H26 by product.
Left large stacked column chart for four years; right two rows of stacked half-year charts.
PCM revenue $777m in 2H26 (NII $653m, OOI $124m); PCM deposits $191b including $56b term deposits; $135b balance by rate sensitivity of which $11b is zero/low-rate; operating cost per customer deposit down 27% vs Sep 19.
Left stacked revenue and deposit charts; right grey panel with rate-sensitivity column, currency breakdown and dashed explanatory callouts.
NZ housing lending NZ$121.2b, business lending NZ$7.5b and agri lending NZ$15.7b at Sep 26; 2H26 provision charge NZ$25m; CRWA NZ$61b with intensity 36.9%; NII/avg CRWA 6.00%.
Two rows of three small charts: lending trends on top, credit quality, exposures and performance below.
Section divider for the Treasury section.
White divider with blue title and section label.
Group capital $99.4b (CET1 $58.5b, AT1 $5.8b, Tier 2 $35.0b); Level 2 CET1 12.0% (-40bps HoH), Tier 1 13.2%, total capital 20.4%, leverage 4.3%, RWA $486b; Level 1 CET1 12.6%; Basel Harmonised CET1 17.9%.
Stacked capital composition columns on the left and a blue-header ratio table on the right with highlighted Sep 26 column.
APRA Level 2 CET1 of 12.0% reconciles to a Basel Harmonised CET1 of 17.9% via adjustments such as residential mortgages +1.01%, IRRBB RWA +1.27%, IRB scaling factor +0.87% and NZ exposures +0.87%; total capital 20.4% APRA vs 29.0% Basel Harmonised.
Paired stacked columns (APRA vs Basel) on the left; reconciliation table with descriptions on the right.
Commentary on the 2H26 CET1 movement to 11.99% (Level 1 12.60%): +3bps from profit less dividend and RWA growth, -29bps IRRBB, -9bps data methodology, -8bps ANZ Worldline, +7bps capital floor; final dividend of 83 cents partially franked at 80% (~66% full-year payout on cash NPAT).
Bullet commentary at top followed by the CET1 waterfall chart repeated from page 37.
Level 2 RWA rose from $464.0b to $485.9b (FX -2.9, divisional lending +8.1, other credit +4.6, traded market risk +2.4, IRRBB +11.1, capital floor -2.6, ANZ Worldline +2.5); IRRBB RWA reached $44.3b at Sep 26 on the revised APS 117 basis.
Top RWA waterfall chart; bottom stacked IRRBB RWA columns over five periods.
NSFR rose from 115% to 116% (deposits +7.6, wholesale debt +1.4, loans -5.4, FX/other -1.8); available stable funding $773b vs required $664b; funding mix led by retail and SME deposits 32% and corporate/PSE/operational 25%; assets 39% mortgages.
Left: NSFR waterfall and stacked NSFR composition bars; right: tall paired stacked bars for assets vs funding.
Average FY26 total liquid assets $308b and net cash outflows $234b give an average LCR of 132% and LCR surplus of $75b; adjusting for offshore short-dated FI deposits held with central banks, FY26 LCR would be ~145%.
Left data table with FY25, FY26 and YoY columns; right two stacked bars with dashed highlight box and side callout.
FY26 term funding issuance of $40b including $3.5b FY27 prefunding (~52% in domestic currencies); FY27 term funding expected at ~$25-30b including ~$5b from ANZNZ; ANZBGL senior ratings AA-/Aa2/AA-.
Bullets top-left, issuance and maturities stacked bar chart FY20-FY34+, ratings table bottom-left, four pie charts (product and currency, Sep 16 vs Sep 26) right.
ANZBGL issued ~$6b of Tier 2 in FY26 including the first AUD benchmark 15nc10 FRN; FY27 requirement ~$5-6b APRA Tier 2 plus $1-1.5b RBNZ transitional Tier 2; APRA Level 2 Tier 2 ratio 7.2% (8.4% including grandfathered AT1).
Bullet panel top-left, two pie charts top-right, AT1 call profile and Tier 2 amortisation stacked bars below.
Australia: APRA credit risk capital reforms expected from 1 April 2027 and proposed covered bond limit increase from 8% to 12%; New Zealand: capital requirements up 50bps from October 2026, with ANZNZ at 16.1% total capital vs a 15.0% requirement (21.0% once 2025 decisions are fully implemented).
Full-width bullet list at top; lower half split into two light-blue NZ text boxes and a stacked RBNZ capital chart.
Portfolio earnings rate rose to 3.68% in Australia and 3.72% in New Zealand in 2H26; the portfolio totals ~A$93b in Australia, ~A$30b in New Zealand and ~A$12b internationally, with hedging of ~86-89% and hedged duration of 2.7 years (Australia) and 2.0 years (NZ).
Two line charts on the left (Australia and NZ rates since 2021) and two data tables on the right.
FY26 cash profit of $7.6b is 63% AUD, 25% NZD and 12% USD and other; earnings hedge P&L of $99m in 1H26 and $135m in 2H26; NZD hedges of NZ$2.3b at 1.13 and USD hedges of US$0.4b at 0.66.
Strategy bullets top-left, donut chart bottom-left, hedge P&L stacked bars top-right and FX rate line chart bottom-right.
Timeline of regulatory changes across 2026-2028+: APRA AT1 phase-out and standardised credit risk capital (2027), APS210 liquidity review (2028 onwards), FRTB (2028 TBC), RBNZ capital framework (2028 onwards) and Deposit Takers Act standards (2028-2029).
Gantt-style table with blue year headers, grey consultation/implementation bars and an implementation-date column.
Section divider for Risk Management & Housing, noting risk metrics include Suncorp Bank from Sep 24 onwards.
White divider with blue title, section label and a small note.
IP charge $212m in 2H26; CP balance $4,530m (modelled ECL $4,125m plus $405m overlays, 1.20% coverage); 2H26 CP charge $96m (volume/mix +42, risk +72, economics +1, methodology +70, overlays -89); IP loss rate 5bps and total loss rate 7bps.
Left: IP stacked bars and CP balance stacked bars with coverage line; right: CP driver table and ratio table.
CP balance $4.53b at Sep 26 by division (Institutional $1.47b, Business & Private Bank $1.30b, Australia Retail $0.98b) and portfolio (corporate $1.89b, residential mortgage $1.23b); provisions by stage $2.28b, $1.54b and $1.09b; CP coverage 0.52% of GLA and 1.20% of credit RWA.
Top-left stacked stage bars, top-right 100% portfolio composition bars, bottom two blue-header tables.
CP balance $4,530m = $2,428m base case + $2,102m scenario weighting; 100% scenarios would give $1,838m upside, $5,130m downside and $9,980m severe; weights 1% / 46% / 39% / 14%; base case Australian GDP 1.9% in CY26 with house prices -4.3%.
Left stacked bar and scenario bars with weightings strip; right three economic tables for base case and peak impacts.
ANZ IP loss rates since 1991 against the long-run median, peaking above 200bps in the early 1990s and near zero recently; half-yearly total credit impairment charges by component from 1H20 to 2H26.
Left long-run line chart with median line; right stacked positive/negative column chart.
Observed loss rates of 36bps (1991-2026), 23bps (2001-2026), 16bps and 10bps; implied loss rate 23bps for the 2008 portfolio vs 11bps for the 2026 portfolio, as residential mortgages rose from 35% to 41% of EAD; asset-class loss history from 0bps (sovereign/banks) to 120bps (other retail).
Left stacked EAD mix columns; right grey panel with bar chart and two small tables, one value circled.
Probability of default distribution for wholesale IRB EAD in 2H26 (83% investment grade, 0.22% in default) and retail IRB EAD (1% in default).
Two side-by-side column histograms by rating or PD band.
Non-performing exposures rose to $9,048m at Sep 26 ($7,750m well secured, $1,298m not well secured); new not-well-secured NPEs of $711m in the period.
Four stacked column charts by security level and division, each with four half-year periods.
90+ DPD trends since Sep 18 for Australian home loans (0.83% per footnote), Australian consumer cards and NZ home loans, plus a wholesale control list indexed to Sep 20 = 100, now well below 100.
Two long-range line charts side by side.
EAD $1,346b and total RWA $486b at Sep 26; credit RWA rose from $369.6b to $377.3b (FX -8.8, volume/mix +19.2, risk -4.8, model +0.5, CVA +1.6); Group risk intensity steady at 28%.
Three charts across the top (EAD stack, RWA stack, CRWA waterfall) with a risk-intensity table below.
Group EAD of $1,346b at Sep 26: consumer lending 42.8%, finance/investment/insurance 22.3%, government 8.9%, commercial property 6.1%; non-performing not well secured $1,298m (0.1% of EAD).
Donut chart on the left and a detailed colour-keyed industry table on the right.
Commercial property outstandings of $66.9b (7.8% of Group GLA) at Sep 26: Australia $56.7b, New Zealand $8.0b, International $2.2b; sector mix residential 27%, offices 22%, industrial 22%, retail 20%; 77% of the portfolio well secured.
Three panels: stacked region bars with share line, 100% sector bars and collateral distribution column chart in a dashed box.
Institutional EAD of $600b by market (International $310b, Asia $128b, China $14b, labelled Mar 26) with tenor split; industry led by finance/investment/insurance 44%; products led by loans 33%; Australia 38% by market of incorporation.
Left stacked tenor columns followed by three donut charts with legends.
Asia portfolio $128b (97% investment grade) and China $14b; China corporate exposure fell from $8.4b (Sep 20) to $3.6b (Sep 26); Asia industry mix 69% finance/investment/insurance and products 29% loans, 28% cash.
Left stacked rating columns with a small trend chart; middle two donuts; right one donut.
Resources EAD fell from $16.2b (Sep 16) to $10.4b (Sep 26): oil and gas $3.2b, metal ore $4.6b, mining services $1.4b, other mining $0.8b, metallurgical coal $0.3b and thermal coal $0.1b.
Single wide stacked column chart across seven periods with a detailed footnote block.
Portfolio of 920k accounts and $356b FUM, average loan $387k, 33% investor, 11% interest only, 63% broker; average dynamic LVR 46% (40% incl. offset), market share 13.3%, offset balances $57b, 87% ahead of repayments, loss rate 0.00%.
Two navy/blue-header data tables side by side with Sep 26 columns highlighted.
Home loan balances grew from $341b to $356b (new sales +$58b, net refinancing -$2b, redraw/interest +$27b, repayments -$68b), with owner-occupier P&I $234b and investor P&I $81b; MoM growth vs APRA system and major banks.
Left stacked composition columns; right balance waterfall above a line chart of monthly growth.
Portfolio 66% owner occupied and 33% investor at Sep 26, flow 60/40 in FY26; by location VIC/TAS 33%, NSW/ACT 32%, QLD 17%, WA 11%, SA/NT 7%, with QLD's share of flow rising to 21%.
Four 100% stacked column charts in a 2x2 grid (portfolio and flow by purpose and location).
Dynamic LVR: 84% of balances below 80% LVR; origination flow 68% below 80% LVR with 12% above 80%; broker share of portfolio 63% and of FY26 flow 71%.
Four 100% stacked column charts in a 2x2 grid.
Repayment buffers by account, on-time profile drivers, dynamic LVR distribution (6.4% of portfolio above 90% LVR; negative equity 2.3%, or 1.7% net of offset) and offset balances of $57b, equal to 16% of home loan balances.
2x2 grid: clustered bars, stacked bars, clustered LVR bars with two text callouts, and offset bar-plus-line chart.
Home loan 90+ DPD by state from Sep 23 to Sep 26 (portfolio rising to just under 1.0%), 30+ and 90+ delinquency trends since 2019 split by owner-occupier and investor, and 90+ DPD curves by vintage FY16-FY26.
Left clustered column chart by state; right two line charts stacked vertically.
ANZLMI gross written premium $64.6m, net claims paid $1.6m and loss rate 0.7bps for FY26; 96% of new business FUM not LMI insured; reinsurance via quota share (>90% LVR) and aggregate stop loss (>80% LVR).
Left KPI table and LMI industry share bar chart with dotted share line; right grey panel with pie chart and reinsurance structure diagram.
602k accounts and NZ$121b FUM at Sep 26, market share 29.7%, 78% owner occupied, 92% fixed rate, 54% broker originated, average dynamic LVR 46%; 45% of balances below 60% LVR and 43% in Auckland.
Two data tables on top; two small pie charts (LVR profile, region) below.
Section divider for the Climate & Nature Strategy section.
White divider with blue title and section label.
Vision to finance a sustainable and orderly transition, with climate and nature objectives mapped to the four ANZ 2030 pillars, from supporting customers' transition to delivering measurable commercial value.
Left light-blue vision panel; right four stacked blue rows each with a pillar icon and statement.
$114.05b delivered since 1 April 2023 ($56.17b funded, $50.67b facilitated, $7.21b direct investments), reaching the original $100b target four years early; target extended to $200b by end-2030; $30.06b delivered in 2026 across 165 transactions.
Top light-blue bullet band; left text cards (light and dark blue); right donut chart in a rounded outline.
160 LEEP customers assessed: 26 Emerging, 53 Progressing and 81 Mature; limits capped or reduced for most of the 22 Emerging customers with account plans; largest sectors oil and gas (39), transport (33) and power generation (23).
Top statement band; left bullets and horizontal stacked outcome bar; right donut chart by sector.
Ten sectoral emissions pathways with 2030 interim targets (e.g. power generation 36-54% intensity reduction, oil and gas 32% absolute reduction, thermal coal 100%); most on track, aviation off-track and cement close to on-track.
Left table of sector pathways with coloured status pills; right light-blue key considerations bullet panel.
Climate disclaimer outlining data, methodology and scenario limitations for the climate statements on pages 105-108 and pointing to the forward-looking statement notice on page 2.
Full-width text page with blue title and bullet list.
Footnotes for page 44 citing Roy Morgan Single Source, RFI Global Consumer and Business Atlas, Insights HQ Retail Market Monitor, Kantar Business Finance Monitor and Coalition Greenwich Voice of Client 2026 studies.
Dense numbered small-print list under a blue title.
Contacts for Group Investor Relations, retail investors and debt investors, with links to the ANZ Shareholder Centre (anz.com/shareholder/centre) and ANZ Debt Investors Centre.
Top half photograph of illuminated ANZ wall logo; bottom blue band with three contact groups in columns.
이 슬라이드 및 기본 프레젠테이션 콘텐츠에 대한 일반적인 질문.
It is ANZ Group's 111-page Results Presentation & Investor Discussion Pack for the year ended 30 September 2026, lodged with the ASX on 9 November 2026. It contains the CEO presentation (strategy, ANZ 2030 priorities, divisional franchise metrics, AI), the CFO presentation (cash profit, revenue, NIM, expenses, credit quality, capital, liquidity) and an investor discussion pack covering corporate overview, additional financials, treasury, risk management and housing, and climate and nature strategy.
Cash profit was A$7,591m, up 10% on FY25 excluding significant items (+31% reported), and statutory profit was $7,270m. Revenue rose 1% to $22,479m while expenses fell 7% to $11,074m, taking the cost-to-income ratio to 49.26%. ROTE improved to 11.56%, the Level 2 CET1 ratio was 11.99% and the full-year dividend was 166 cents per share, including a final dividend of 83 cents franked at 80%.
ANZ's financial year ends on 30 September. FY2026 (FY26) covers 1 October 2025 to 30 September 2026, as the cover confirms ('Full year ended 30 September 2026'). The first half (1H26) runs from October to March and the second half (2H26) from April to September, which is why the deck compares 1H26 and 2H26 and refers to balances at Mar 26 and Sep 26.
All amounts are in Australian dollars unless stated otherwise ($m = A$ millions, $b = A$ billions); New Zealand division charts are labelled NZDb. Cash profit is ANZ's preferred non-IFRS measure of core earnings, which excludes certain non-core items from statutory profit. Many slides also show growth on a constant-currency basis alongside reported figures.
The CFO slides expect FY27 total expenses to stay flat to a pro forma FY26 cost base of about $11.26b, a 4bps NIM benefit from the replicating portfolio over the next 12 months, broadly stable 1H27 NIM ex Markets, and FY27 term funding of about $25-30b. Longer-term targets are ROTE towards 12% by FY28 and 13% by FY30, and a cost-to-income ratio in the mid-40s by FY28. These are forward-looking statements subject to the deck's disclaimer.
ANZ published the original as a PDF, which is available from the ASX announcements platform and ANZ's Shareholder Centre. On 2slides you can browse the deck page by page as a design reference. If you need an editable PowerPoint, use 2slides to build a deck with the same structure (title, KPI overview, waterfall bridges, divisional dashboards, appendix) using your own data. ANZ's branding and content belong to ANZ.
Use its structure: a cover and disclaimer, a CEO strategy section with priorities and progress donuts, a CFO section with a KPI overview, P&L table and revenue, expense, NIM and capital waterfalls, then an appendix-style discussion pack with small-multiple charts and data tables. It works well for banks, lenders, insurers or any listed company that reports half-yearly or annually. Swap in your own figures, brand colours and logo.
Yes. It is ANZ Group Holdings Limited's own results presentation, approved for distribution by ANZ's Continuous Disclosure Committee and lodged with the ASX on 9 November 2026. You can find the original and related documents, such as the Consolidated Financial Report, Dividend Announcement and Appendix 4E, through the ANZ Shareholder Centre and the ASX announcements platform (ticker ANZ).
Official investor relations hub with ANZ results presentations, financial reports and ASX announcements; listed on page 111 of the deck.
Official ANZ resource for debt investors covering funding, capital and credit ratings; listed on page 111 of the deck.

Create Your Own Slides
Turn your ideas into professional presentations in seconds with 2slides AI.
전문 디자인을 참조하고, 스타일을 선택하며, 완벽한 텍스트 렌더링으로 슬라이드를 생성하세요. Nano Banana로 구동—지금 프레젠테이션 만들기를 시작하세요.


