
収録コレクション: 投資家向けプレゼン資料の実例
onsemi Investor Day 2026 (September 16, 2026): a 100-slide investor day presentation built around one thesis. Power density, not compute or memory, is the physical constraint on AI. onsemi sets out its 2030 targets: 12–14% revenue CAGR, 53% non-GAAP gross margin, 38% operating margin and 30–35% free cash flow margin.
クイックナビゲーション
タグ
スライドを共有
onsemi Investor Day 2026 (September 16, 2026): a 100-slide investor day presentation built around one thesis. Power density, not compute or memory, is the physical constraint on AI. onsemi sets out its 2030 targets: 12–14% revenue CAGR, 53% non-GAAP gross margin, 38% operating margin and 30–35% free cash flow margin.
レイアウト、主要コンテンツ、視覚要素を含む各スライドページの詳細ビュー。
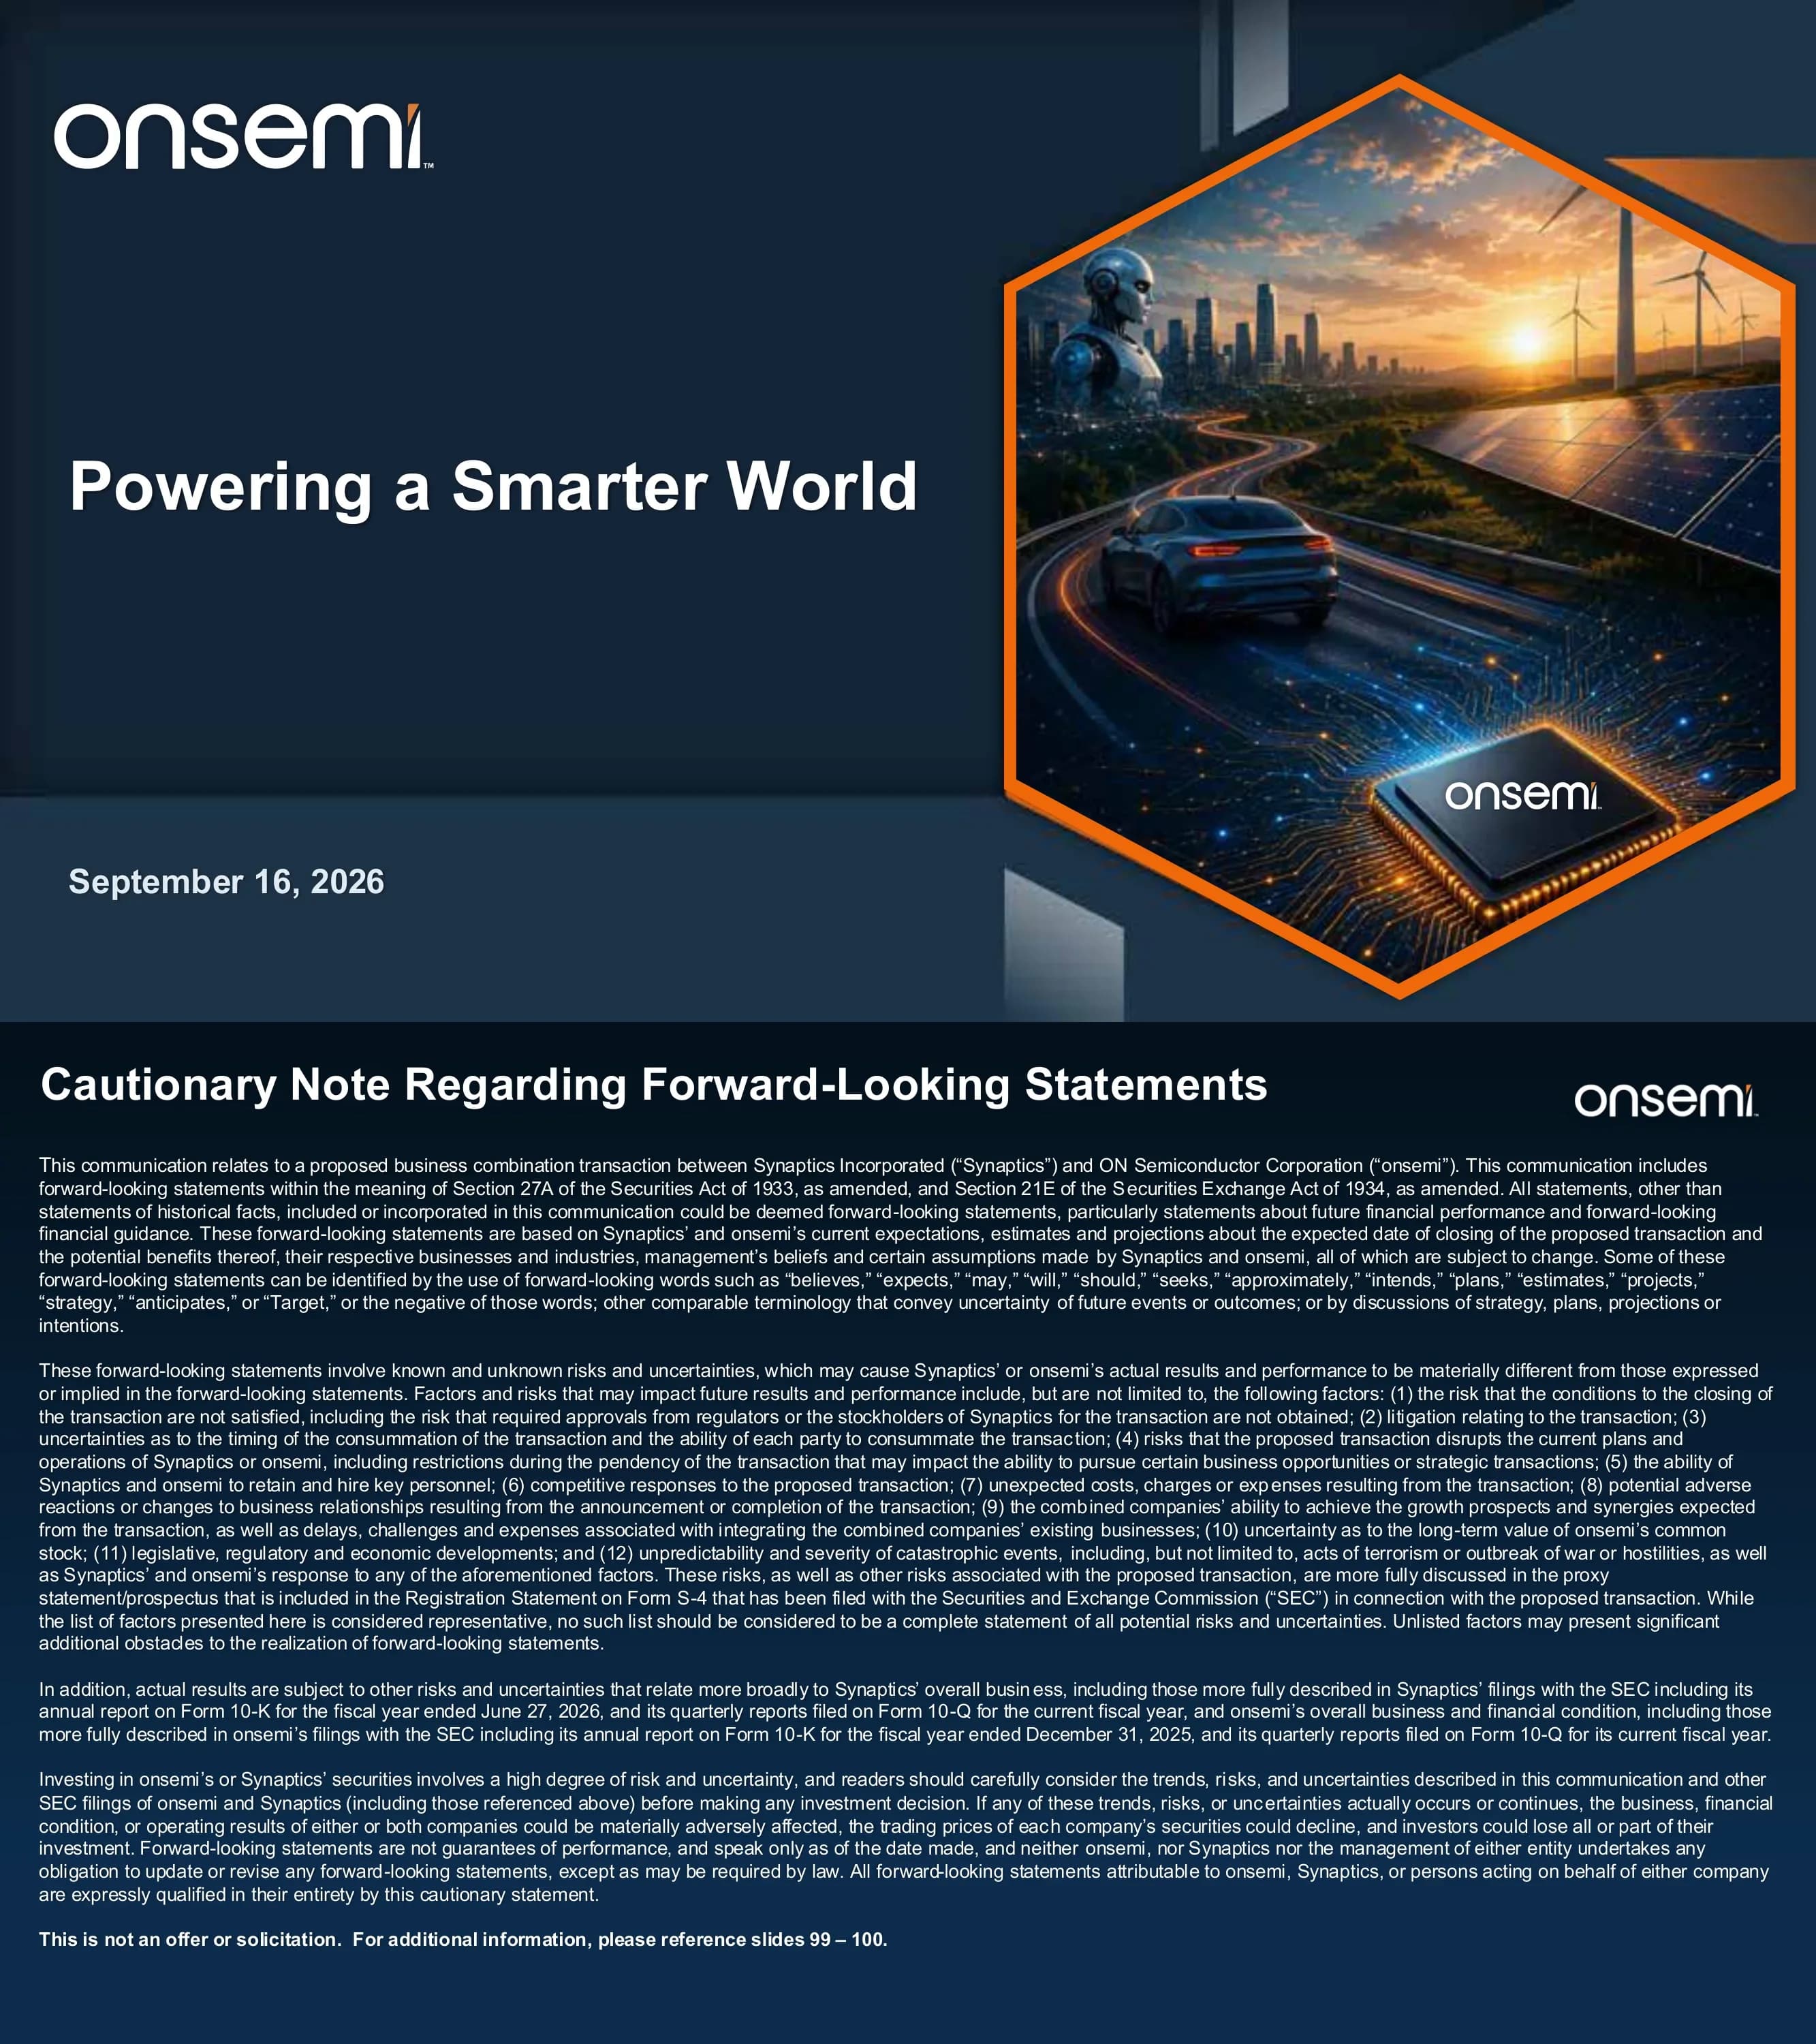
Title slide for the onsemi Investor Day dated September 16, 2026, under the tagline Powering a Smarter World.
Dark navy left panel with logo, large headline and date; right side hexagonal image frame with orange outline.
Legal notice tied to the proposed Synaptics and onsemi business combination, listing 12 risk factors and referencing SEC filings (Form S-4, 10-K, 10-Q). States this is not an offer or solicitation and points to slides 99-100.
Full-width dense text on a dark gradient background with a title top left and logo top right.
Explains that the deck uses non-GAAP measures such as free cash flow, FCF margin, non-GAAP gross margin and operating margin, and that forward-looking reconciliations are unavailable. Directs readers to the Appendix on slide 89 for historical reconciliation.
Single text block on a dark gradient background, with a bold reference line below the paragraph.
Agenda listing five segments: Hassane El-Khoury on the next decade of innovation, Achyut Shah on powering the AI revolution, Sudhir Gopalswamy on automotive and industrial, Thad Trent on durable financial performance, then Q&A with all.
Two-column table with blue TOPIC and PRESENTER headers and five dark rows, each pairing a topic with a presenter name and title.
Opening presenter slide for Hassane El-Khoury, President and CEO, introducing the topic Charting a Path to Power the Next Decade of Innovation.
Diagonal split: navy left panel with logo and orange parallelogram outline; right side full-bleed tech imagery; title and speaker in a dark banner at bottom.
Dramatic statement slide arguing that every foundational technology hits a physical limit and that the world has now reached it.
Full-bleed dark cinematic image with headline text top left and a large bold statement beneath; logo bottom right.
Compares how long each foundational technology took, gated by a physical constraint: steam engine ~60 years, electricity ~90, automobile ~37, computing ~26, internet ~13, AI ~9 years. AI's constraints are compute, memory and power.
Six equal vertical image cards along a horizontal timeline arrow, each with a big year count and a constraint label below; banner caption at the bottom.
Three stacked tiers show Compute (constraint on breadth) and Memory (constraint on potential) as addressed, while Power (constraint on existence) remains a physical constraint. Concludes that until power density breaks through, the AI revolution is limited.
Three horizontal 3D slabs stacked top to bottom, each with a chip image, descriptor, four sub-factors and a status box on the right; a vertical MORE PHYSICAL arrow on the left and a banner at the bottom.
Contrasts yesterday's predictable power for factories, appliances, buildings and conventional vehicles with tomorrow's always-on power for AI data centers, robots, autonomous vehicles and edge AI. Power must be more efficient, dense, reliable, precise, autonomous and scalable.
Three-part layout: blue Yesterday panel left, central challenge with six icon grid, orange Tomorrow panel right with a circular INTELLIGENCE graphic and callout labels.
Shifts from electrical component thinking (more watts, bigger, centralized) to multi-physics systems (more watts, smaller, distributed) spanning electrical, thermal, mechanical and physical domains. Tagline: more power, less space, higher efficiency, unmatched reliability.
Left blue card for power of yesterday, four central icon columns, right orange card for power of today, with a full-width gradient arrow banner at the bottom.
Customer asks for rising input voltage and power, falling output voltage and physical space, and cost always challenged. Examples: AI data center 800V and higher to 6V or less; solid-state transformer 13.8kV to 34.5kV; xEV 400V to 900V+.
Left requirements checklist box, center four overlapping-free circles labeled no overlap, right callout; three application cards in a bottom band.
Moves from solving power (efficiency, conversion, components, scale) to solving power density (electrical, thermal, mechanical, physical). States that power density is not solved by one device and requires a different company.
Two framed panels (blue From, orange To) flanking a central network icon and message; wide banner with large logo and statement at the bottom.
Timeline from 2021 to And Beyond showing acquisitions (GTAT, 300mm East Fishkill NY fab, SWIR Vision, SiC JFET, VCORE, RISC-V, Silver Atena, Synaptics) and in-house developments (SiC MOSFET, Treo, vertical GaN, EPP, lateral GaN, advanced material deposition).
Horizontal blue-to-orange timeline with acquisitions as circular icons above the line and technology developments below it; vertical label STRONG TECHNOLOGY BASE at left.
Four pillars of Physical AI: Power, Sense, Control and Connected Compute, with Synaptics adding HMI and tactile sensing and the Connected Compute pillar (single pair ethernet, AI-first compute, Wi-Fi/BLE/Thread). Machines that sense, decide, act and adapt.
Four side-by-side bordered cards over a dimmed robotics background, with an orange banner and subtitle beneath.
Sankey-style flow of a $213B TAM from markets (Auto $93B, Industrial $69B, AI DC $47B, Emerging $3B) through applications to technologies (Power $118B, Compute $34B, Sense $30B, Connectivity $7B, Other $23B). AI Halo: $9B of industrial built to support data centers.
Three-column flow diagram: Market on left, Application list in middle with dollar values, Technology blocks on right, connected by colored ribbons with a central orange TAM circle.
Pyramid of Technology, Products, Solutions and Systems with rising ASP and scale, spanning examples such as BCD65, SiC, vGaN, EPP, intelligent power modules, solid state transformer and 800V to 12V or 800V to under 6V systems. Combined, these create a sustainable competitive advantage.
Left 3D stepped pyramid with four labeled tiers, each extending into a horizontal band of item labels on the right; vertical ASP to Scale arrow and bottom banner.
Sets up the problem with four separate circles (Electrical, Thermal, Mechanical, Physical) labeled no overlap.
Minimal slide with title top left and four circles in a 2x2 arrangement at center on a dark gradient.
Introduces three technology answers: HV as the device, Treo as the intelligence, and EPP as the integration, supported by a complete portfolio of differentiated power and sensing technologies.
Four non-overlapping circles at center, three labeled columns along the bottom, and a full-width banner at the base.
The four constraint circles now overlap in a Venn diagram, showing HV, Treo and EPP together unlocking the power density problem.
Overlapping four-circle Venn diagram at center, three technology columns beneath, and a supporting banner at the bottom.
HV portfolio from IGBT, SiC MOSFET/JFET and GaN to vertical GaN, trading off unconstrained, HV conversion, efficiency and density, with cost falling from IGBT to vGaN. The Syracuse, NY vGaN fab is in production: 66,000 sq ft on a 14-acre site, 20,000 sq ft clean room, $40M+ tools, $120M+ investment.
Left stepped bar chart comparing technology options with a cost arrow and orange callout; right wafer-to-package-to-board image, fab render and four stat tiles; HV/Treo/EPP tab chips top right.
Treo platform built on BCD 65nm process with the industry's widest voltage range of 1-90V and a modular architecture for fast time-to-market. Block diagram shows communications, power and compute subsystems.
Left block diagram of colored subsystems, right large chevron with headline claim, and three feature cards across the bottom; navigation tabs top right.
Roadmap of Treo products sampling in 2024 (e.g. low-power AFE ASIC, 10BASE-T1S MAC-PHY), 2025 (e.g. platform MCU, LIN transceiver) and 2026 (e.g. 48V SmartFET drivers, isolated SiC gate driver, ReRAM). Color-coded by market: automotive, industrial, AI/client, compute, medical, mass market.
Color legend across the top and three year columns, each listing products with market tags and color bars.
The silicon becomes the system: EPP uses the silicon wafer itself as the package, embedding heterogeneous die. Claims 3-5x power density, 30% highest system value, 12 in. standard manufacturing, 4 MOS fastest time to market, plus best-in-class inductance and superior thermal performance. Not a product, a platform.
Left large headline and stat strip over a lower description block; right a wafer with magnified circular inset of embedded die.
Compares lead-frame/DBC (B2S), panel PCB embedding and onsemi EPP: power density 1x, 1.3x, 3x to 5x; system cost 1.0, 1.1, 0.7-0.8; thermal path 4, 0.4 and 148 W/mK; idea to production 12 months vs 4 months. EPP obsoletes the state of the art.
Three-column comparison table with product photos on top and seven evaluation criteria rows, with the EPP column highlighted in orange; banner at the bottom.
Eight-step EPP customer flow: input in under 48 hours, design studio output in under 5 days, interposer manufacturing in under 3 months using 12-inch silicon fab with no new CapEx, then customer-dependent integration and production. Customers shown include an industrial customer (Subaru logo) and an AI DC customer.
Four orange header columns by timeline with two numbered steps each, and a bottom row of images: simulation views, EPP module, customer box.
Checklist comparing onsemi with four peers across IGBT, silicon MOSFET, SiC MOSFET, SiC JFET, lateral GaN, small signal, vertical GaN, Treo and EPP; onsemi covers all. Callouts: 1500+ power patents, vertical GaN 180+ patents with 700 V and 1200 V sampling, EPP 60+ patents.
Matrix table with technology rows and onsemi plus Peer 1-4 columns using check, partial and cross icons; right sidebar panel with three patent callouts.
Recap of the three layers: HV as the device (technology for every power problem), Treo as the intelligence (analog and mixed-signal platform), EPP as the integration (silicon as the system). onsemi makes the requirements converge and solves power density at every level.
Three bordered columns, each embedding a visual from earlier slides (HV chart, Treo block diagram, EPP wafer), with a wide statement banner at the bottom.
Presenter title slide for Achyut Shah, Group President, Power Solutions Group, introducing the AI revolution segment.
Diagonal split with navy left panel, orange outline accents and logo; right full-bleed AI data center image; title banner at bottom.
Quote from Jensen Huang, Founder, President and CEO of NVIDIA: the bottleneck has shifted from chips to power. Electrical, Thermal, Mechanical and Physical icons tie it back to the power density theme.
Full-bleed dimmed photo of a data center and transmission towers, centered icon row at top, dark quote band in the middle, attribution with NVIDIA logo below.
Bank of America chart shows cumulative data center power consumption rising from 2026 to 2030 on a 60 to 300 GW axis. Quotes: NVIDIA on 800 VDC architecture, Goldman Sachs on 1,000 homes of power in a filing cabinet, and Roland Berger that power, not GPUs, is the limiting factor.
Left line chart panel, right panel with two attributed quotes, and a wide quote banner across the bottom.
Three outcomes of higher power density: fewer data centers with less real estate, more compute with more tokens per dollar, and higher efficiency with less water used.
Three tall arched columns each with a circular image and overlaid label, and an orange caption below; orange gradient title bar at top.
Contrasts the AC and low voltage path (480VAC, 54VDC bus bar, 12V IBC, lateral Vcore, 1kW xPU) with the high voltage DC path (35kVAC solid state transformer, 800VDC bus bar, 6V, vertical Vcore, 5kW+ xPU).
Two stacked power-chain flow diagrams, blue top and orange bottom, separated by an arrow, each ending in an xPU chip with a banner caption below.
Content per rack grows from $15K today to $115K by 2030 as architecture moves from AC to 800V DC with a solid state transformer.
Four server rack illustrations left to right on a rising curve, with a blue Today box at lower left and an orange 2030 box at upper right; low/high voltage legend bottom right.
Power chain from utility grid to xPU with dashed boxes marking onsemi content, spanning the industrial AI Halo and AI DC segments. Drivers: more power in limited space, more high voltage content, more energy storage and load balancing, mechanical to semiconductor content, more control, intelligence and safety.
Top power-chain diagram with onsemi CONTENT legend and segment bar, bottom data center illustration with five stacked bands feeding an orange chevron and a closing statement.
Maps the AI data center power chain from 35kVAC utility grid through 800VDC distribution to 6VDC and 0.8V GPU Vcore. Competitor 'peer' counts shrink from many at low voltage power and control to a single peer in SiC JFET high voltage.
Full-width power-chain block diagram on top with three labeled technology zones below, each with an onsemi pill and stacked grey peer pills
Same utility-to-GPU power chain, now summarized as proven leadership across SiC JFET, SiC + GaN and LV power and control, plus innovation breakthroughs in HV vGaN and EPP.
Power-chain diagram across the top; lower area has onsemi logo, a bordered breadth box, a plus sign and a bordered innovation box
onsemi's vGaN plus unique magnetics gives a 20% smaller 800V to 6V intermediate bus converter than two competitor boards. Higher power density means more compute in the rack and lower cost per token.
Three horizontal board photos stacked (Competitor 1, Competitor 2, onsemi) with a callout box and orange footer banner
High voltage architectures need multiple fault protection points, moving from mechanical circuit breakers to solid state circuit breakers.
Two-panel image comparison (cutaway breaker left, three packaged chips right) with captions and a full-width bottom statement bar
The EPP SSCB is over 50% smaller than the industry-standard solid state circuit breaker built from three packages.
Side-by-side product photos (three packages vs one small EPP module) with caption pills and a size callout
Adds thermal images: the industry-standard SSCB peaks at 135C versus 106C for the EPP SSCB, which is 20% cooler. Smaller size plus less cooling equals better TCO.
Same side-by-side layout with a thermal heat-map row below each product and an orange takeaway banner
Lateral power delivery (2-phase SPS plus inductor, 5 mm height) delivers 2 A/mm2 and is available now; onsemi-enabled 4-phase vertical power delivery reaches over 3 A/mm2 at 2 mm height, available 2027. Marked as a new Vcore win in 2026.
Left-to-right before/after layout with big metrics, component photos, a transition arrow and feature list below
AI data center revenue is expected to grow more than 2X in 2026 and 2X in 2027, about 5X from over $500M in 2026 to over $2.5B in 2030. Long-term growth of 10 points above market with a 50%+ revenue CAGR for 2026-2030; analyst TAM CAGR estimates range from 21% (BofA) to 81% (Mizuho) against a ~40% baseline.
Left panel with TAM CAGR dot scale; right column of three stacked KPI cards; wide gradient banner across the bottom
Closing slide of the AI data center section: AI turns power into one connected system, the prize grows while the field shrinks, and onsemi solves the toughest challenges.
Full-bleed night data-center photo with three text groups left, center (curved perspective text) and right with onsemi logo
Section title slide for Sudhir Gopalswamy, Group President, Analog & Mixed-Signal and Intelligent Sensing Groups.
Dark panel with diagonal orange divider on left, futuristic robots-and-car image on right, title and speaker block in a bottom banner
Introduces the two end markets covered in this section: Automotive and Industrial.
Full-bleed dark photo split left (car) and right (robots/factory) with two orange label bands and a centered title
Since 2019 onsemi has grown 9% faster than flat automotive SAAR by building a franchise around electrification (intelligent power: HV FET, MV FET, power IC) and autonomous driving (intelligent sensing: image, ultrasonic, inductive).
Timeline chart from 2019 to Today with two rising arrows over a pyramid, row labels with car images on the left and a tall arrow KPI at right
Through 2030 onsemi expects to keep outperforming SAAR by 9% while shifting to higher value across electrification ($47B TAM), autonomous ($15B TAM) and SDV/zonal ($9B TAM).
Three stacked bands (SDV/Zonal, Autonomous, Electrification) with milestone chips rising Today to 2030, left TAM labels
Three-part plan for intelligent power: extend SiC technology leadership, expand system value with Treo power ICs, and change the game with EPP.
Orange gradient title banner, three equal cards in a row, large car x-ray image below
SiC performance improves +25% per generation through device structure enhancement, and onsemi extends from 750V and 1200V to 1400V SiC for 400V, 800V and 1000V batteries. Customer value spans efficiency, power density and faster charging.
Two side-by-side chart panels with orange headers, customer value strip along the bottom, small TAM label bottom left
Treo power ICs address five vehicle functions: power protection and LDOs in the power tree, current controllers for traction and OBC, LED drivers for lighting, and SPS/DC-DC controllers for the 'brain'.
Five-column row of product images over orange labels inside a green panel
The Treo-enabled intelligent SiC current controller, available 2026, adds a 1-Gen SiC boost and 5% BOM savings in the optimized inverter by replacing Hall effect sensors with integrated current sensing.
Left block diagram panel, right two large arrow KPIs, customer value box bottom right
EPP, available 2026, replaces state-of-the-art inverter modules with 4x power density, 15% lower power losses and one inverter platform scaling from low end to high end.
Left before/after module photos, right three arrow KPIs, customer value list bottom right
Three-part sensing plan: capitalize on sensor proliferation, extend sensing performance leadership with Treo, and enhance vision with new image sensing modalities.
Orange gradient title banner, three equal cards, wireframe cars with sensing beam below
onsemi offers image, ultrasonic and inductive sensing for autonomous driving, a $15B TAM.
X-ray car at left, three vertical product columns at right with dashed highlights and labels
From 2026 to 2030, image sensors grow 3x as autonomy moves from L2 to L4, while ultrasonic sensors grow 1.5x with more use cases and inductive sensors grow 1.5x as x-by-wire extends.
Three upward arrows of different heights between 2026 and 2030 baselines, with icons and captions
Next-gen sensing, available 2027 and enabled by Treo: image sensor with integrated serializer (10% BOM savings), ultrasonic range from 6 cm to under 1 cm, and inductive accuracy from ~0.1 to under 0.005 degrees (>20x). Headline 20x performance.
Three bordered panels (image, ultrasonic, inductive) on top; two arrow KPIs and customer value box below
In the perception stack, vision is highlighted versus radar and lidar; challenges are adverse weather for vision, spatial resolution for radar and system cost for lidar.
Two-column table-style layout with perception stack rows and challenge text, left-hand TAM label
SWIR sees through fog and rain (industrial today, auto in advanced R&D); iToF gives high-res depth under 15M and hazard detection at 100M (auto in proof-of-concept); vision HDR is available today.
Centered orange heading with three staggered feature rows and a customer value box at bottom right
Introduces SDV/zonal as a new growth driver: expand content and intelligence at the nodes.
Orange gradient title bar, subtitle band, top-down car x-ray image
In-vehicle networks evolve from complex domain-based ECU sprawl today to simplified zonal architecture with 10BT1S and then an architecture with onsemi RCP, optimized for SDV software in central compute and intelligent nodes. $9B TAM.
Three-panel left-to-right evolution with network diagrams and colored caption boxes, red chevrons between
Compares three node types: basic Ethernet node with MCU, Ethernet node with RCP, and Treo intelligent node. onsemi content grows along the value arrow while zonal controller cost ($$$) falls to zonal switch ($).
Three columns of stacked block diagrams for ultrasonic and LED nodes with an onsemi VALUE arrow along the bottom
Basic Ethernet node is in production at $ today; Ethernet node with RCP is design-in 2027 at 2x $ today; Treo intelligent node arrives next-gen in 2028 at 3x $ today.
Same three-column structure with blocks unlabeled, growing orange blocks and bottom milestone bars
Up to $2000 of onsemi content per vehicle across xEV electrification (EPP, EliteSiC FET, SiC current controller, 48V), zonal electronics (LED drivers, SmartFET/eFuse, 10BASE-T1S) and ADAS (image sensors, iToF, SWIR, ultrasonic, inductive).
Left stacked category boxes with bullet lists, large x-ray car with colored overlays at right, orange banner at bottom
Five automotive innovations form an innovation engine: ultrasonic park assist, SiC traction, image sensing for ADAS, 10BASE-T1S for IVN and inductive x-by-wire.
Circular radial layout with onsemi logo and 'Innovation Engine' at center and five circular photos with labels around a ring
The same innovation engine applies to industrial: ultrasonic flow metering, SiC energy infrastructure, image sensing for machine vision, 10BASE-T1S Ethernet nodes and inductive joint control.
Same radial layout as previous slide with industrial photos and a robotic arm background
Physical AI is built on three capabilities: Power (efficient power conversion), Sense (perception of the physical world) and Control (precise actuation and control).
Full-bleed photo of robots on a circular stage with three labeled captions arranged in an arc and orange dotted ring
Autonomous machines that sense, decide, act and adapt, from robot vacuums and drones to cobots and autonomous cars, sit along rising power/performance and autonomy axes, with an arrow marking the onsemi content opportunity.
Scatter-style chart with circular photos plotted on autonomy vs power/performance axes and a diagonal orange arrow overlay
Three robot lineages (warehouse AMRs to legged AMR, factory arms to dexterous hands, autonomous cars to reasoning vehicles) converge on the humanoid, each step adding autonomy, force sensing or multi-modal VLA reasoning. The slide calls out Physical AI as a $6B TAM by 2030.
Three horizontal rows of circular photo pairs joined by translucent bands with italic capability labels, funneling into a large orange arrowhead holding the $6B TAM callout, with a humanoid robot render on the right.
Maps onsemi products to humanoid subsystems: 30+ limb actuators (GaN FETs, GaN drivers, inductive sensors, 10BASE-T1S), 15+ hand actuators, vision, sensors, power tree and connectivity. Headline claim: up to $900 of onsemi content per humanoid.
Central humanoid figure flanked by two columns of labeled body-part boxes with connector lines, outer side panels listing product bullets (orange for recently added), and a bottom banner with the $900 claim.
Automotive targets 9% CAGR driven by EPP disruption, intelligent sensing and SDV/zonal; Industrial targets 10% CAGR driven by leveraging auto, Physical AI and AI Halo. Both are framed as delivering margin expansion from today to 2030.
Two side-by-side orange gradient triangles (pyramids) with CAGR at the apex and value-driver pairs inside, vertical Today-to-2030 arrow on the left, imagery at the base and a bottom banner.
Section title slide introducing Thad Trent, Executive Vice President and CFO, for the financial portion of the Investor Day.
Dark slate left panel with logo and orange angular frame; right side has a glowing growth-chart illustration; title and speaker block on a dark banner across the lower area.
Framing slide for the CFO section: high-value secular markets (AI Data Center, Automotive, Industrial) combined with differentiated technology that expands margins.
Full-bleed dark montage of tech imagery around a glowing onsemi chip, orange headline ribbon across the upper third, and two bordered boxes at the bottom.
Non-GAAP average gross margin rose from 36% (2015-2020) to 43% (2021-2026) and average operating margin from 13% to 26%. Drivers: differentiated products, Fab Right, exits of about $900M annualized, and revenue per employee up about 2X.
Left bar chart comparing two periods with horizontal average lines and shaded high-low bands; right column of three stacked blue callout cards with orange accent bars.
Same transformation chart with free cash flow margin: average FCF margin rose from 8% to 18% while gross margin averages moved from 36% to 43%. A fourth card cites transforming from a manufacturing company to a product company and brownfield capacity expansion.
Left period-comparison bar chart with green gross margin and orange FCF average lines; right column of four stacked callout cards, the last highlighted with an orange bar.
Total 2021-2026 investment of $8.7B (R&D $3.6B, M&A $0.8B, CapEx $4.3B) flows through programs such as Treo, EPP, SiC JFET, Vcore, vertical GaN and EFK expansion. It delivers $81B of TAM expansion: Auto +$20B, Industrial +$16B, AI Data Center +$45B.
Sankey-style flow diagram: three investment-type boxes on the left, a column of program bars in the middle, and colored market boxes with TAM figures on the right, plus a bottom orange summary banner.
onsemi serves 9,000+ customers globally across Automotive, Industrial and AI Data Center. The top 20 customers represent about 35% of revenue with no 10% customer, supported by deep engagements and broad distribution.
Three framed columns of customer logo walls (blue Automotive, green Industrial, red AI Data Center) with a bottom orange banner of three summary statements.
2026E to 2030 non-GAAP CAGR targets: Auto 9%, Industrial 10%, AI Data Center 50%+, Other 1%, for total revenue growth of 12-14%. Auto content is about $2,000 per vehicle, AI Data Center rises from about $15K to about $115K per rack with revenue above 5x to over $2.5B, and Physical AI is a $6B TAM.
Left stacked-area chart from 2026E to 2030 Target with segment CAGR labels and a dashed growth arrow; right four color-coded rows with photo strips and driver text.
The 2019 footprint of many fabs, including Fab-Liter sites, is consolidated into the current Fab Right network (East Fishkill, Aizu, Gresham, Bucheon, Czech Republic, Seremban, Syracuse, External). Five subscale fabs were exited while 300mm EFK capacity expanded; the footprint is about 17% lower cost at full utilization and needs about 5% of revenue CapEx to scale.
Left panel of scattered jigsaw pieces (2019), center column of orange benefit text with icons and arrows, right panel of interlocked jigsaw pieces (current), and a bottom banner.
Non-GAAP gross margin bridges from 40.3% in 2026E to a 53% 2030 target: utilization +650 bps, Fab Right +225 bps (50 bps announced), new products/mix +400 bps. Supporting cards explain fixed-cost absorption, two announced site divestitures and ramping Treo, EPP, vGaN and AI Data Center revenue.
Left waterfall chart with orange start/end bars and blue step bars connected by dotted lines; right column of three blue cards with bullets.
2026E-2030 non-GAAP CAGRs: revenue +12-14%, gross profit dollars +22%, operating income dollars +30%. Gross profit grows 1.6x faster than revenue and operating income more than 2x faster.
Horizontal bar chart with three labeled bars on a 0-30% axis inside a rounded panel, large value labels at bar ends, and a bottom orange takeaway banner.
Free cash flow is $1.6B (25% margin) in 2026E and targeted at about $3.5B (30-35%) in 2030, more than 2x. From 2023-2026E the company repurchased $4.2B of shares, 92% of FCF, for a 12% reduction in shares.
Column chart from 2020 to 2026E with an Investment Era bracket around 2023-2024, a separate tall orange 2030 Target bar linked by a dashed >2X arrow, and a bottom banner.
Four-step capital allocation framework: Reinvest in highest-return growth, Strategic M&A to expand the portfolio selectively, Balance Sheet resilience, and Return Cash by repurchasing shares consistently. Plans to return 100% of FCF via buybacks with $5.3B remaining under the existing authorization.
Four chevron-shaped panels in a left-to-right flow, each with an icon, colored heading, bold one-line principle and a short description.
Non-GAAP targets table, 2025A / 2026E / 2030: revenue $6.0B / $6.5B / +12-14% CAGR; gross margin 38.4% / 40.3% / 53%; OpEx 19.8% / 18.5% / 15%; operating margin 18.6% / 21.9% / 38%; CapEx 5.7% / 2.7% / ~5%; FCF 23.7% / 24.8% / 30-35%. Tax rate stays 15% through 2030.
Six-row financial table with metric names, 2025A, 2026E and highlighted 2030 TARGET columns plus a descriptive comment column, footnote at bottom.
Synaptics standalone post-synergies: revenue growth above 15%, gross margin above 55%, operating margin above 30%. The deal broadens the customer base, increases TAM by $30B and is accretive to EPS within about 18 months with $200M of synergies.
Three-row table with a single numeric column headed Synaptics Standalone Post-Synergies and commentary at right, with an empty gap where the OpEx/CapEx rows sit in the companion slide.
Repeats the non-GAAP financial model: revenue $6.0B to $6.5B then +12-14% CAGR, gross margin 38.4% to 40.3% to 53%, operating margin 18.6% to 21.9% to 38%, CapEx-light about 5%, FCF 30-35%, and a 15% tax rate through 2030.
Six-row table with 2025A, 2026E and 2030 TARGET columns and rationale text in the right column; footnote below.
Extends the historical averages (gross margin 36% to 43%, operating margin 13% to 26%, FCF margin 8% to 18%) to 2030 targets of 53% gross margin, 38% operating margin and 30-35% FCF. Target operating margin is greater than legacy gross margins.
Left two-period bar chart with average lines, a dotted vertical 2030 Target column with three marker points linked by dashed lines, and right stack of blue cards plus an orange highlight card.
Closing summary in three columns: secular markets (AI data center, automotive, industrial), differentiated capabilities (unmatched breadth, exclusive Treo and EPP platforms, $8.7B invested for $81B TAM), and compounding financials (+12-14% revenue CAGR, 53% GM, 38% OM, 30-35% FCF to about $3.5B).
Hero photo strip of car, data center and robot arm on top with headline, then three columns under an orange divider with colored tags, and an orange equation banner at the bottom.
Closing slide with the onsemi logo, tagline, social handles (@onsemi on LinkedIn, X, Facebook) and onsemi.com.
Centered large logo and tagline on a dark slate hex-pattern background with an orange diagonal stripe at left; social icons and URL below.
Section divider introducing the appendix of GAAP to non-GAAP reconciliations.
Angular slate and orange geometric background with logo top-left and the APPENDIX title on a dark banner in the lower half.
Two tables reconcile GAAP to non-GAAP gross margin for FY2015-2020 and FY2021-2025. For example, FY2025 GAAP 33.1% plus 5.2% restructuring-related inventory charges and 0.1% amortization gives 38.4% non-GAAP.
Two stacked bordered tables with blue header rows, fiscal-year columns and adjustment line items, rounding footnote at bottom left.
Reconciles GAAP to non-GAAP operating margin for FY2015-2020 and FY2021-2025, e.g. FY2025 GAAP 1.4% to non-GAAP 18.6% (restructuring 11.1%, inventory charges 5.2%) and FY2022 28.3% to 34.5%.
Two stacked bordered tables with lettered adjustment rows from amortization through restructuring and a non-GAAP total row.
Reconciles GAAP to non-GAAP operating expenses and operating income in $ millions. FY2020 non-GAAP OpEx was $1,179.3M (22.4% of revenue) and non-GAAP operating income $536.5M; FY2018 operating income peaked at $982.4M.
Two stacked dense tables with FY2015-FY2020 columns, dollar figures, adjustment rows and totals, units note below title.
Reconciles GAAP to non-GAAP OpEx and operating income for FY2021-2025. FY2025 non-GAAP OpEx was $1,185.4M (19.8%) and non-GAAP operating income $1,119.5M versus $2,873.1M in FY2022.
Two stacked tables with FY2021-FY2025 columns, adjustment rows including restructuring of $666.9M in FY2025, and total rows.
Free cash flow equals net cash from operations minus capital purchases. FY2025 FCF was $1,418.6M (23.7% margin) from $1,759.8M operating cash flow and $341.2M capex; FY2023 FCF was $401.9M (4.9%).
Two stacked tables (FY2015-2020 and FY2021-2025) with four rows each: operating cash flow, capex, free cash flow and FCF margin.
Source notes for the CEO presentation by Hassane El-Khoury: $5.3B remaining under the existing buyback authorization as reported through Q2 2026, and 2026 estimates based on consensus.
Text-only slide with blue Notes and Sources label, large white title with speaker, and a short bullet list on a dark gradient.
Sources for Achyut Shah's AI data center section: McKinsey (July 2026) for GPU rack power and 800-volt DC, Bank of America Watts to Token (May 2026) for cumulative data center power, and UBS, BofA, Citi, Mizuho and onsemi estimates for AI DC TAM CAGRs.
Text-only slide with header label, title with speaker name and three bold-labeled source entries with bullets.
Sources for Sudhir Gopalswamy's section: Bloomberg Auto SAAR (Factset 26E, 0.39%) for roughly flat SAAR, and onsemi, Yole and Omdia projections for the $6B Physical AI TAM in 2030 covering AMRs, drones and humanoids.
Text-only slide with Notes and Sources label, three-line title with speaker credentials, two source blocks.
Sources for Thad Trent's section: market research firms (Maximize, Deloitte/Mordor, KBV, Yole), LMC Automotive and Omdia for 2022-2027 TAM CAGRs, onsemi BOM estimates, semiconductor TAM excluding memory, and the Q1 2023 10-Q for the >$17B figure.
Text-only slide with header label and speaker title, followed by five bold-labeled source groups with bullet lists.
Legal disclaimer stating the communication is not an offer or solicitation of securities, and explaining that onsemi filed a Form S-4 with the SEC on August 21, 2026 including a proxy statement of Synaptics, urging investors to read it and noting where to obtain documents.
Text-heavy legal slide with italic bold section headings and dense justified paragraphs with hyperlinks on a dark gradient.
Describes Synaptics and onsemi directors and officers as potential participants in proxy solicitation, and points to proxy statements (Synaptics filed September 16, 2025; onsemi filed April 2, 2026), Form 4 filings and the Form S-4 for details.
Single dense legal text block under an italic heading with embedded SEC EDGAR hyperlinks on a dark gradient.
このスライドと基礎となるプレゼンテーションコンテンツに関する一般的な質問。
It is the full slide deck onsemi presented at its Investor Day on September 16, 2026. Across 100 slides, CEO Hassane El-Khoury, Group Presidents Achyut Shah and Sudhir Gopalswamy, and CFO Thad Trent cover the company's power-density strategy, its AI data center, automotive and industrial growth plans, and its 2030 financial targets.
The CFO section targets a 12–14% non-GAAP revenue CAGR from 2026E to 2030, a 53% gross margin (from 40.3% in 2026E), 15% operating expenses, a 38% operating margin, about 5% CapEx and a 30–35% free cash flow margin (roughly $3.5B). It also commits to returning 100% of free cash flow through share repurchases.
The deck puts AI data center TAM at $47B and argues that 800V DC architectures raise onsemi content from about $15K to about $115K per rack by 2030. It targets AI data center revenue of more than $500M in 2026 growing to more than $2.5B in 2030, a 50%+ CAGR.
They are the three platform pillars the deck uses to frame onsemi's moat. Treo is a 65nm BCD analog and mixed-signal platform covering 1–90V. EPP (Embedded Power Platform) uses the silicon wafer itself as the package, for a claimed 3–5x power density. vGaN is vertical GaN-on-GaN built in Syracuse, NY, sampling at 700V and 1200V.
Yes. Synaptics is framed as completing the 'four pillars of physical AI' (power, sense, control and connected compute). A dedicated slide says it adds $30B of TAM, carries gross margins above 55%, and is accretive to EPS within about 18 months with $200M of synergies. The cautionary-note and legal slides refer to the related Form S-4.
Yes, as a structural and design reference. The flow (agenda by presenter → CEO thesis → segment deep-dives → CFO model → appendix) and slide types like margin bridges, TAM waterfalls, content-per-unit diagrams and target tables transfer well to any company's investor day. Replace onsemi's data and branding with your own.
This gallery entry provides the original PDF; the source file is over 19 MB, so no PPTX conversion is attached. You can use 2Slides to rebuild any of these layouts as editable slides from your own content.
onsemi posts the full presentation, the per-speaker decks and the webcast replay on its investor relations event page for Investor Day 2026 (investor.onsemi.com).
Official source of the full presentation and the per-speaker decks (CEO, PSG, AMG/ISG, CFO).

Create Your Own Slides
Turn your ideas into professional presentations in seconds with 2slides AI.
プロフェッショナルなデザインを参照し、スタイルを選択し、完璧なテキストレンダリングでスライドを生成。Nano Banana搭載—今すぐプレゼンテーションの作成を始めましょう。
© 2026 2slides。全著作権所有。



