
Hluti af safninu Dæmi um fjárfestakynningar
Rolls-Royce Full Year Results 2024 - Corporate Financial Performance and Strategic Transformation
Flýtileiðsögn
Merki
Deila glærunum
Rolls-Royce Full Year Results 2024 - Corporate Financial Performance and Strategic Transformation
Ítarleg sýn á hverja glærusíðu, þar á meðal útlit, lykilefni og sjónræna þætti.
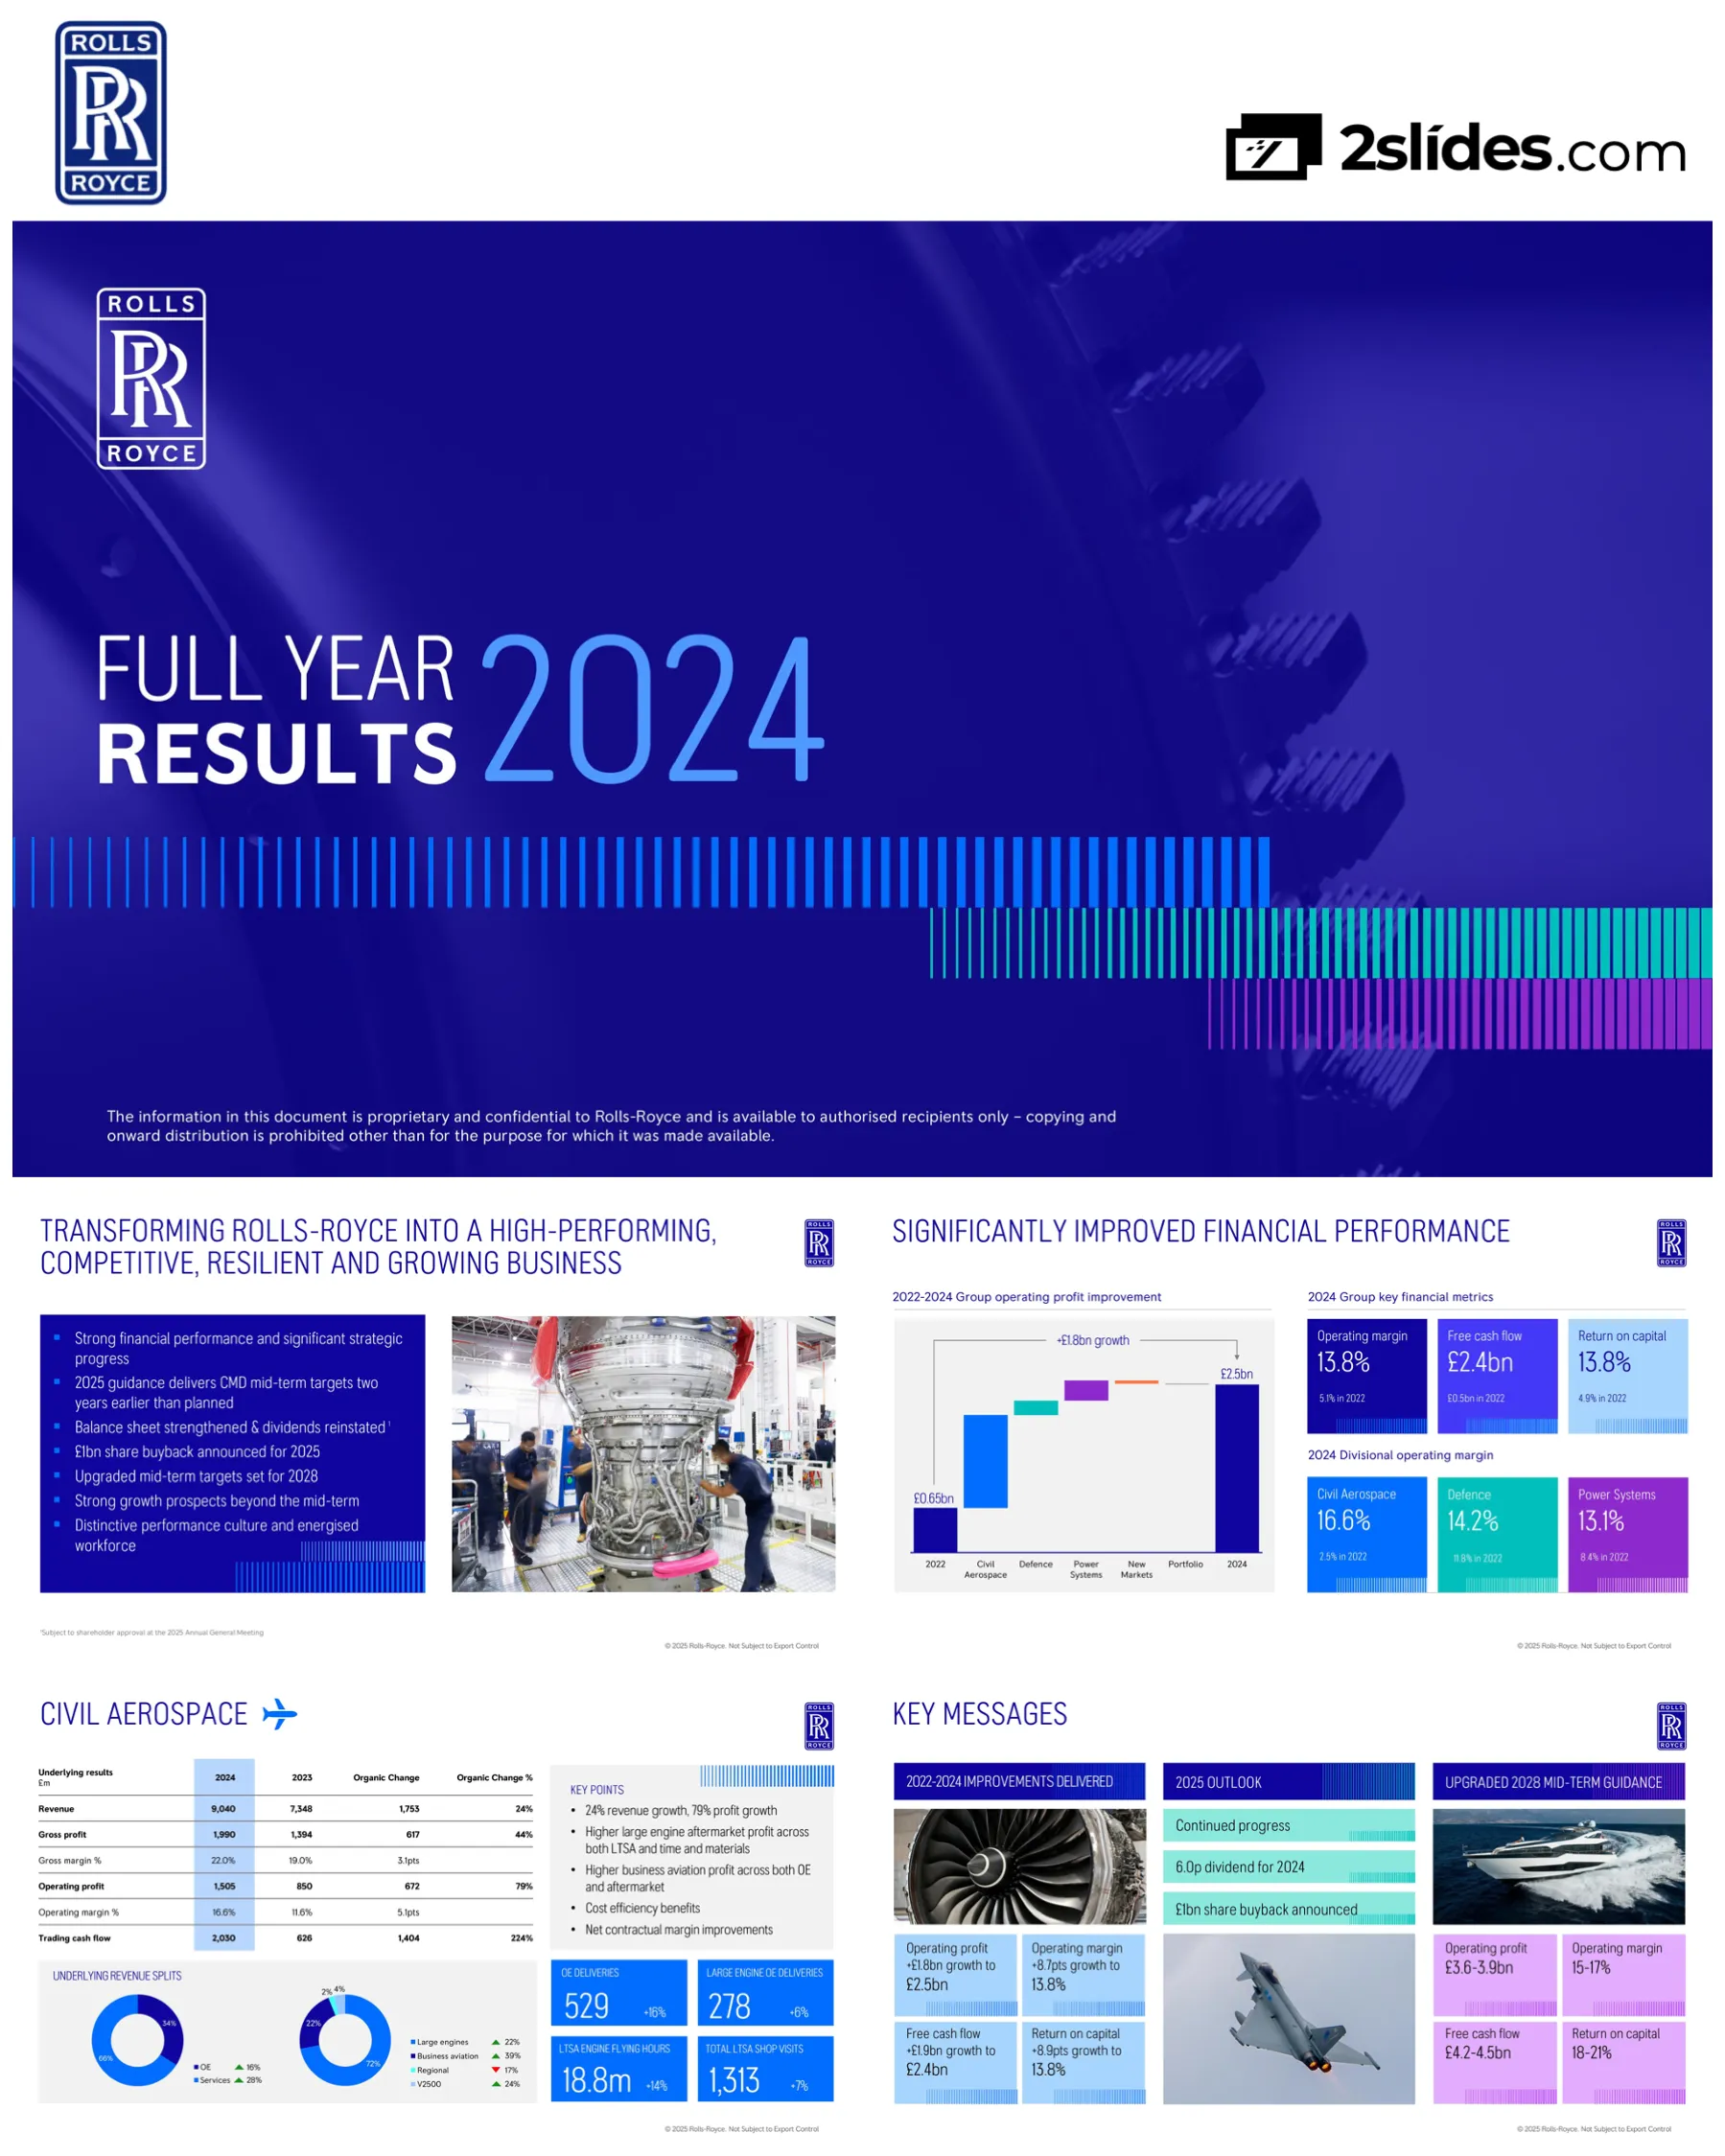
Title slide featuring Rolls-Royce branding with distinctive blue gradient background and colorful bar pattern design elements. Includes proprietary notice and copyright information.
Full-bleed cover design with large typography centered, Rolls-Royce logo in top left, decorative horizontal bars in blue, teal, and magenta gradients at bottom
Standard legal disclaimer explaining forward-looking statements, risk factors, and noting that information reflects knowledge as of announcement date. References underlying basis definitions in note 2 of financial statements.
Split layout with industrial engine photograph on left, legal text on right with Rolls-Royce logo in top right corner
Section divider introducing Tufan Erginbilgic, Chief Executive Officer. Features large '01' numeral with engineering blueprint imagery in background.
Full-bleed background with technical drawings, large outlined '01' on left, CEO name and title in white text, gradient bar pattern at bottom
Executive summary slide highlighting key achievements: strong financial performance, 2025 guidance delivering CMD targets two years early, balance sheet strengthened with dividend reinstatement, £1bn share buyback for 2025, upgraded mid-term targets for 2028, strong growth prospects beyond mid-term, and distinctive performance culture.
Split design with bullet-point text on left side in blue panel, photograph of engineers working on large engine component on right side
Displays 2022-2024 operating profit growth from £0.65bn to £2.5bn (£1.8bn improvement) with waterfall chart. Shows 2024 key metrics: 13.8% operating margin (from 5.1% in 2022), £2.4bn free cash flow (from £0.5bn), 13.8% return on capital (from 4.9%). Includes divisional margins: Civil Aerospace 16.6%, Defence 14.2%, Power Systems 13.1%.
Two-panel layout with waterfall chart on left showing profit bridge by division, three metric cards on top right, three divisional margin cards on bottom right
Three key charts showing: (1) Renegotiated cumulative contract cash improvement curve from -30% in 2022 to 100% by 2035, (2) Contract and LTSA margin improvement showing +17pts and +20pts gains to 2035, (3) Power Generation margin progression toward double-digit by 2024 through overhead reduction, product cost, price, and mix improvements.
Three equal-width panels displaying growth curves and waterfall chart, each with descriptive headers
Shows progress on CMD targets delivered two years early across three metrics: Indirect operating costs savings (>£350m in 2024, targeting >£500m in 2025), Third-party procurement savings (>£550m in 2024, targeting >£1bn in 2025), TCC/GM ratio improvement (0.47x in 2024 from 0.80x in 2022, targeting best-in-class levels by 2025).
Three equal panels with bar charts showing year-over-year progression from 2023-2025 for each metric
Four-pillar strategic framework showing progress across: (1) Portfolio choices & partnerships (SMR partnership with ČEZ, UltraFan testing, MRO capacity, Pearl 700 certification, Power Systems engine), (2) Strategic initiatives (contract renegotiations, time-on-wing improvements, market share growth), (3) Efficiency & simplification (TCC/GM 0.47x, >£350m benefits, >£550m procurement savings), (4) Lower carbon & digitally enabled (SMR, BESS growth, data centre generators, digital technologies).
Four equal vertical columns with colored headers (blue, teal, light blue, purple) and bullet-point achievements under each pillar
2025 guidance showing operating profit £2.7-2.9bn and free cash flow £2.7-2.9bn, meeting CMD mid-term targets two years ahead of plan. Bar charts show progressive growth from 2022 baseline. Civil Aerospace drivers: Large engine EFH 110-115% of 2019, Total OE deliveries 540-570, Total shop visits 1,400-1,500.
Two bar charts side-by-side showing operating profit and FCF progression, with table below showing Civil Aerospace operational drivers
2028 mid-term targets upgraded: Operating profit £3.6-3.9bn (up from £2.5-2.8bn), Operating margin 15-17%, Free cash flow £4.2-4.5bn (up from £2.8-3.1bn), Return on capital 18-21%. Divisional margins: Civil Aerospace 18-20%, Defence 14-16%, Power Systems 14-16%.
Four bar charts showing progression from 2022-mid-term for key metrics, with table below showing divisional margin targets
2024-2028 Group operating profit improvement of £1.1-1.4bn growth from £2.5bn to £3.6-3.9bn, shown through waterfall chart. Strategic initiatives breakdown by division: Civil Aerospace growth from widebody and business aviation, Defence growth from Transport and Submarines & Combat, Power Systems growth across Power Gen, Government, Marine & Industrial, and BESS.
Large waterfall chart on left showing profit bridge by division, three smaller divisional charts on right showing segment contributions
Section divider introducing Helen McCabe, Chief Financial Officer. Features large '02' numeral with business professional imagery.
Full-bleed background with professional photograph, large outlined '02' on left, CFO name and title in white text, gradient bar pattern at bottom
Comprehensive financial results: Revenue £17,848m (+17% organic), Gross profit £4,091m (+29%, margin 22.9%), Operating profit £2,464m (+57%, margin 13.8%), Profit after tax £2,011m (+78%). Free cash flow £2,425m (+£1,140m), Net cash £475m (from £1,952m debt), Return on capital 13.8% (+2.5pts). Key message highlights strong divisional delivery and double-digit returns.
Two tables showing income statement and cash/balance sheet metrics on left, four key message cards on right with blue, teal, and purple color coding
Revenue £9,040m (+24%), Operating profit £1,505m (+79%, margin 16.6%), Trading cash flow £2,030m (+224%). Revenue split: 66% Services, 34% OE. Engine split: 39% Large engines (+22%), 22% Business aviation (+28%), 22% V2500 (+24%), 17% Regional (-17%). Key deliveries: 529 total OE (+16%), 278 large engine OE (+6%), 18.8m LTSA EFH (+14%), 1,313 LTSA shop visits (+7%).
Financial table on left, two donut charts showing revenue splits in center, four metric cards on right showing operational KPIs
Revenue £4,522m (+13%), Operating profit £644m (+16%, margin 14.2%), Trading cash flow £591m (+16%). Revenue split: 57% Services, 43% OE. Segment split: 30% Combat (+12%), 31% Transport (+1%), 28% Submarines (+53%), 7% Naval (+1%), 4% Helicopters (-7%). Order intake £13.3bn (book-to-bill 2.9x), Order backlog £17.4bn (+89%).
Financial table on left, two donut charts showing revenue splits in center, two metric cards on right showing order book data
Revenue £4,271m (+11%), Operating profit £560m (+40%, margin 13.1%), Trading cash flow £452m (-2%). Revenue split: 69% OE, 31% Services. Segment split: 49% Power Generation (+25%), 26% Governmental (+17%), 10% Marine (-4%), 14% Industrial (-20%), 1% BESS (+52%). Order intake £5.1bn (book-to-bill 1.2x), Order backlog £4.8bn (+17%).
Financial table on left, two donut charts showing revenue splits in center, two metric cards on right showing order book metrics
Free cash flow bridge from operating profit to FCF: Operating profit £2,464m, Net investments -£282m, Civil LTSA balance movement £691m, Working capital £280m, Provisions -£167m, Excess derivatives -£146m, Net interest -£29m, Tax -£381m, Other -£5m, resulting in FCF £2,425m. Key drivers: strong profit growth, higher net investments, lower LTSA growth, working capital release, reduced overhedge/interest costs, higher tax costs.
Financial bridge table on left showing cash flow components, key drivers narrative on right with bullet points
Three key resilience metrics showing dramatic improvement: (1) TCC/GM ratio improved from 0.88x (2019) to 0.47x (2024) achieving best-in-class, (2) Net debt reduced from £5.2bn (2020 peak) to net cash £0.5bn (2024), (3) EFH resilience improved approximately 2x, meaning the business can withstand twice the EFH decline before FCF breaks even.
Three bar charts side-by-side showing TCC/GM progression, debt/cash position over time, and EFH resilience improvement
Mid-term FCF target £4.2-4.5bn representing £1.8-2.1bn growth from £2.4bn (2024). Growth drivers: Operating profit growth £1.1-1.4bn, Civil net LTSA balance growth, focused strategic investments, disciplined working capital management, absence of over-hedge costs, offset by increased cash tax costs.
Large bar chart on left showing FCF progression from 2022 through mid-term with growth bridge annotation, bulleted drivers list on right
Three-pillar capital allocation framework: (1) Strong Balance Sheet - lower gross debt with 2025 $1bn bond repayment, strong IG credit rating, robust liquidity; (2) Regular and Growing Dividends - 2024 FY dividend reinstated at 30% payout, target 30-40% payout ratio, dividends grow with earnings; (3) Further Investments & Shareholder Distributions - £1bn share buyback in 2025, disciplined strategic investments, option for additional distributions.
Three horizontal bars with gradient backgrounds (blue, teal, purple) showing the three pillars, with detailed bullet points for each
Section divider for CEO's closing remarks, featuring large '03' numeral with technology/engineering imagery.
Full-bleed background with technical imagery, large outlined '03' on left, CEO name and title in white text, gradient bar pattern at bottom
Consolidated summary of achievements and guidance across three sections: (1) 2022-2024 Improvements - operating profit +£1.8bn to £2.5bn, margin +8.7pts to 13.8%, FCF +£1.9bn to £2.4bn, ROCE +8.9pts to 13.8%; (2) 2025 Outlook - continued progress, 6.0p dividend for 2024, £1bn buyback announced; (3) Upgraded 2028 Mid-term - operating profit £3.6-3.9bn, margin 15-17%, FCF £4.2-4.5bn, ROCE 18-21%.
Three sections with accompanying imagery (engine manufacturing, fighter jet, yacht) and metric summaries in colored boxes below each section
Illustrative long-term growth framework showing expansion beyond mid-term across five areas: Civil Aerospace (market share growth, contract benefits, time-on-wing improvements), Defence (AUKUS, GCAP, B-52, MQ-25, FLRAA wins, sustained demand, rising budgets), Power Systems (differentiated products, lower carbon solutions, next-gen engine), SMR (leveraging nuclear capabilities), New Business (UltraFan for next-gen platforms, nuclear micro-reactors).
Stylized growth curve graphic on left showing mid-term to long-term expansion, detailed bullet-point breakdown on right with color-coded sections
SMR value proposition across three dimensions: (1) Differentiated Product - 470 MWe capacity, 80%+ factory-built, highly competitive LCoE, continuous net-zero power; (2) Unique Business Model - double-digit ROCE, immediate cash generation, selected in Czech Republic, down-selected in UK and Sweden, 18 months ahead on regulatory approval; (3) Risks Controlled - lower risk than large nuclear, best-in-class partners, contractual risk mitigation. Illustrative single-unit cash profile shows cash generation throughout 4-year build phase.
Three colored sections on left (blue, teal, purple) with value propositions, illustrative profit/cash curve chart on right showing cumulative performance
Three-part transformation summary showing how strategic initiatives deliver on the Rolls-Royce proposition: (1) High Performing, Competitive and Resilient Business, (2) Growing Sustainable Cash Flows, (3) Strong Balance Sheet and Growing Shareholder Returns. Bullet points detail achievements including strong 2024 results, CMD targets delivered early, upgraded 2028 guidance, balance sheet strengthening, dividend reinstatement, £1bn buyback, and distinctive performance culture.
Left panel with transformation achievements in gray box, right side showing three numbered strategic pillars in stacked gradient bars (blue, teal, purple)
Section divider slide for questions and answers session, featuring large 'Q&A' typography with aircraft imagery in background.
Full-bleed background with multiple aircraft in flight, large 'Q&A' text on left, gradient bar pattern at bottom
Final slide featuring centered Rolls-Royce logo on solid blue background with proprietary notice and gradient bar pattern.
Centered Rolls-Royce monogram logo on royal blue background, confidentiality notice centered below, gradient bars at bottom
Algengar spurningar um þessa glæru og undirliggjandi kynningarefni.
Rolls-Royce delivered a remarkable transformation from 2022 to 2024: operating profit grew from £0.65bn to £2.5bn (nearly 4x increase), operating margin expanded from 5.1% to 13.8% (+8.7 percentage points), free cash flow increased from £0.5bn to £2.4bn (nearly 5x), and return on capital improved from 4.9% to 13.8%. The company also transformed its balance sheet from £2bn net debt to a £0.5bn net cash position. These improvements were driven by strategic initiatives across contract renegotiations, operational efficiency, and disciplined capital management.
Rolls-Royce is delivering its CMD mid-term targets two years ahead of the original 2027 plan. The 2025 guidance of £2.7-2.9bn in both operating profit and free cash flow meets the original CMD mid-term targets of £2.5-2.8bn operating profit and £2.8-3.1bn free cash flow. Due to this accelerated performance, the company has upgraded its 2028 mid-term targets to £3.6-3.9bn operating profit (15-17% margin), £4.2-4.5bn free cash flow, and 18-21% return on capital, representing substantial increases from the original CMD targets.
Rolls-Royce has established a three-pillar capital framework: (1) Strong Balance Sheet - maintaining investment-grade credit rating, reducing gross debt including repaying the $1bn 2025 bond from cash, and ensuring robust liquidity; (2) Regular and Growing Dividends - reinstating dividends for 2024 at 6.0p per share (30% payout ratio), with a target payout range of 30-40% of underlying profit after tax that will grow with earnings; (3) Strategic Investments and Shareholder Distributions - completing a £1bn share buyback in 2025, making disciplined value-creative investments aligned to strategy, with options for additional shareholder distributions. This balanced approach prioritizes sustainable cash flow generation while returning capital to shareholders.
All three divisions delivered strong performance in 2024: Civil Aerospace achieved 24% revenue growth and 79% operating profit growth to £1.5bn (16.6% margin), driven by higher large engine aftermarket profit and business aviation growth across OE and services. Defence delivered 13% revenue growth and 16% profit growth to £644m (14.2% margin), with strong order intake of £13.3bn (2.9x book-to-bill) led by Submarines growth. Power Systems achieved 11% revenue growth and 40% profit growth to £560m (13.1% margin), driven by Power Generation for data centres and Governmental segments, with BESS improving profitability. Each division has clear mid-term margin targets: Civil Aerospace 18-20%, Defence 14-16%, and Power Systems 14-16% by 2028.
Rolls-Royce has delivered significant efficiency gains, achieving CMD targets two years early: (1) Indirect operating costs savings exceeded £350m in 2024 (targeting >£500m in 2025), (2) Third-party procurement savings exceeded £550m in 2024 (targeting >£1bn cumulative by 2025), (3) TCC/GM ratio improved dramatically from 0.88x in 2019 to 0.47x in 2024, reaching best-in-class levels. These initiatives included zero-based budgeting rollout, Group Business Services efficiencies, supply chain optimization, and overhead reductions. The cumulative contract cash improvement from renegotiations is progressing from -30% in 2022 toward 100% by 2035, with both contract and LTSA margins improving across all in-production engines.
Rolls-Royce SMR represents a significant long-term value creation opportunity with three key differentiators: (1) Product Excellence - largest SMR in the market at 470 MWe with highly competitive levelized cost of electricity, more than 80% factory-built modular design providing continuous, low-cost, net-zero power; (2) Unique Business Model - generates strong double-digit returns on capital with immediate cash generation from the first order, already selected in Czech Republic and down-selected in UK and Sweden, with regulatory approval approximately 18 months ahead of competition; (3) Controlled Risks - lower technological and execution risk than large nuclear, best-in-class strategic partners including ČEZ, and contractual risk mitigation. The business model shows profit and cash generation throughout the 4-year build phase, making it cash-generative from the first order.
Rolls-Royce has substantial long-term growth momentum across five strategic areas: (1) Civil Aerospace - growing widebody and business aviation market share, full benefits from contract renegotiations, higher margin contracts scaling up, and time-on-wing improvements ramping up; (2) Defence - long-term growth underpinned by major contract wins including AUKUS, GCAP, B-52, MQ-25, and FLRAA, sustained demand for mature programmes, and rising global defence budgets; (3) Power Systems - differentiated products in growing markets including lower carbon solutions and BESS, with next-generation engine launching in 2028; (4) SMR - leveraging unique nuclear capabilities in a growing market; (5) New Business - UltraFan uniquely positioned for next-generation narrowbody and widebody platforms, and nuclear micro-reactors for defence, space, and commercial applications. These opportunities are expected to drive material growth beyond the mid-term guidance.
Rolls-Royce has dramatically improved its financial resilience across three key dimensions: (1) Capital Efficiency - TCC/GM ratio improved from 0.88x in 2019 to 0.47x in 2024, achieving best-in-class performance and reducing the capital intensity of the business; (2) Balance Sheet Strength - transformed from £5.2bn net debt at the 2020 peak to £0.5bn net cash in 2024, with plans to reduce gross debt further by repaying the $1bn 2025 bond from cash, while maintaining a strong investment-grade credit rating and robust liquidity; (3) Earnings Volatility Protection - improved EFH (Engine Flying Hours) resilience by approximately 2x, meaning the business can now withstand twice the decline in large engine EFH before free cash flow breaks even. This resilience enables the company to sustain operations, invest in growth, and return capital to shareholders even in challenging market conditions.

Create Your Own Slides
Turn your ideas into professional presentations in seconds with 2slides AI.
Sæktu innblástur í faglega hönnun, veldu þinn stíl og búðu til glærur með fullkominni textabirtingu. Knúið af Nano Banana—byrjaðu að búa til kynninguna þína núna.
Þinn AI-þjónn fyrir glærur. Sparaðu tíma, skín hraðar með snjallri kynningargerð.




© 2026 2slides. Allur réttur áskilinn.