
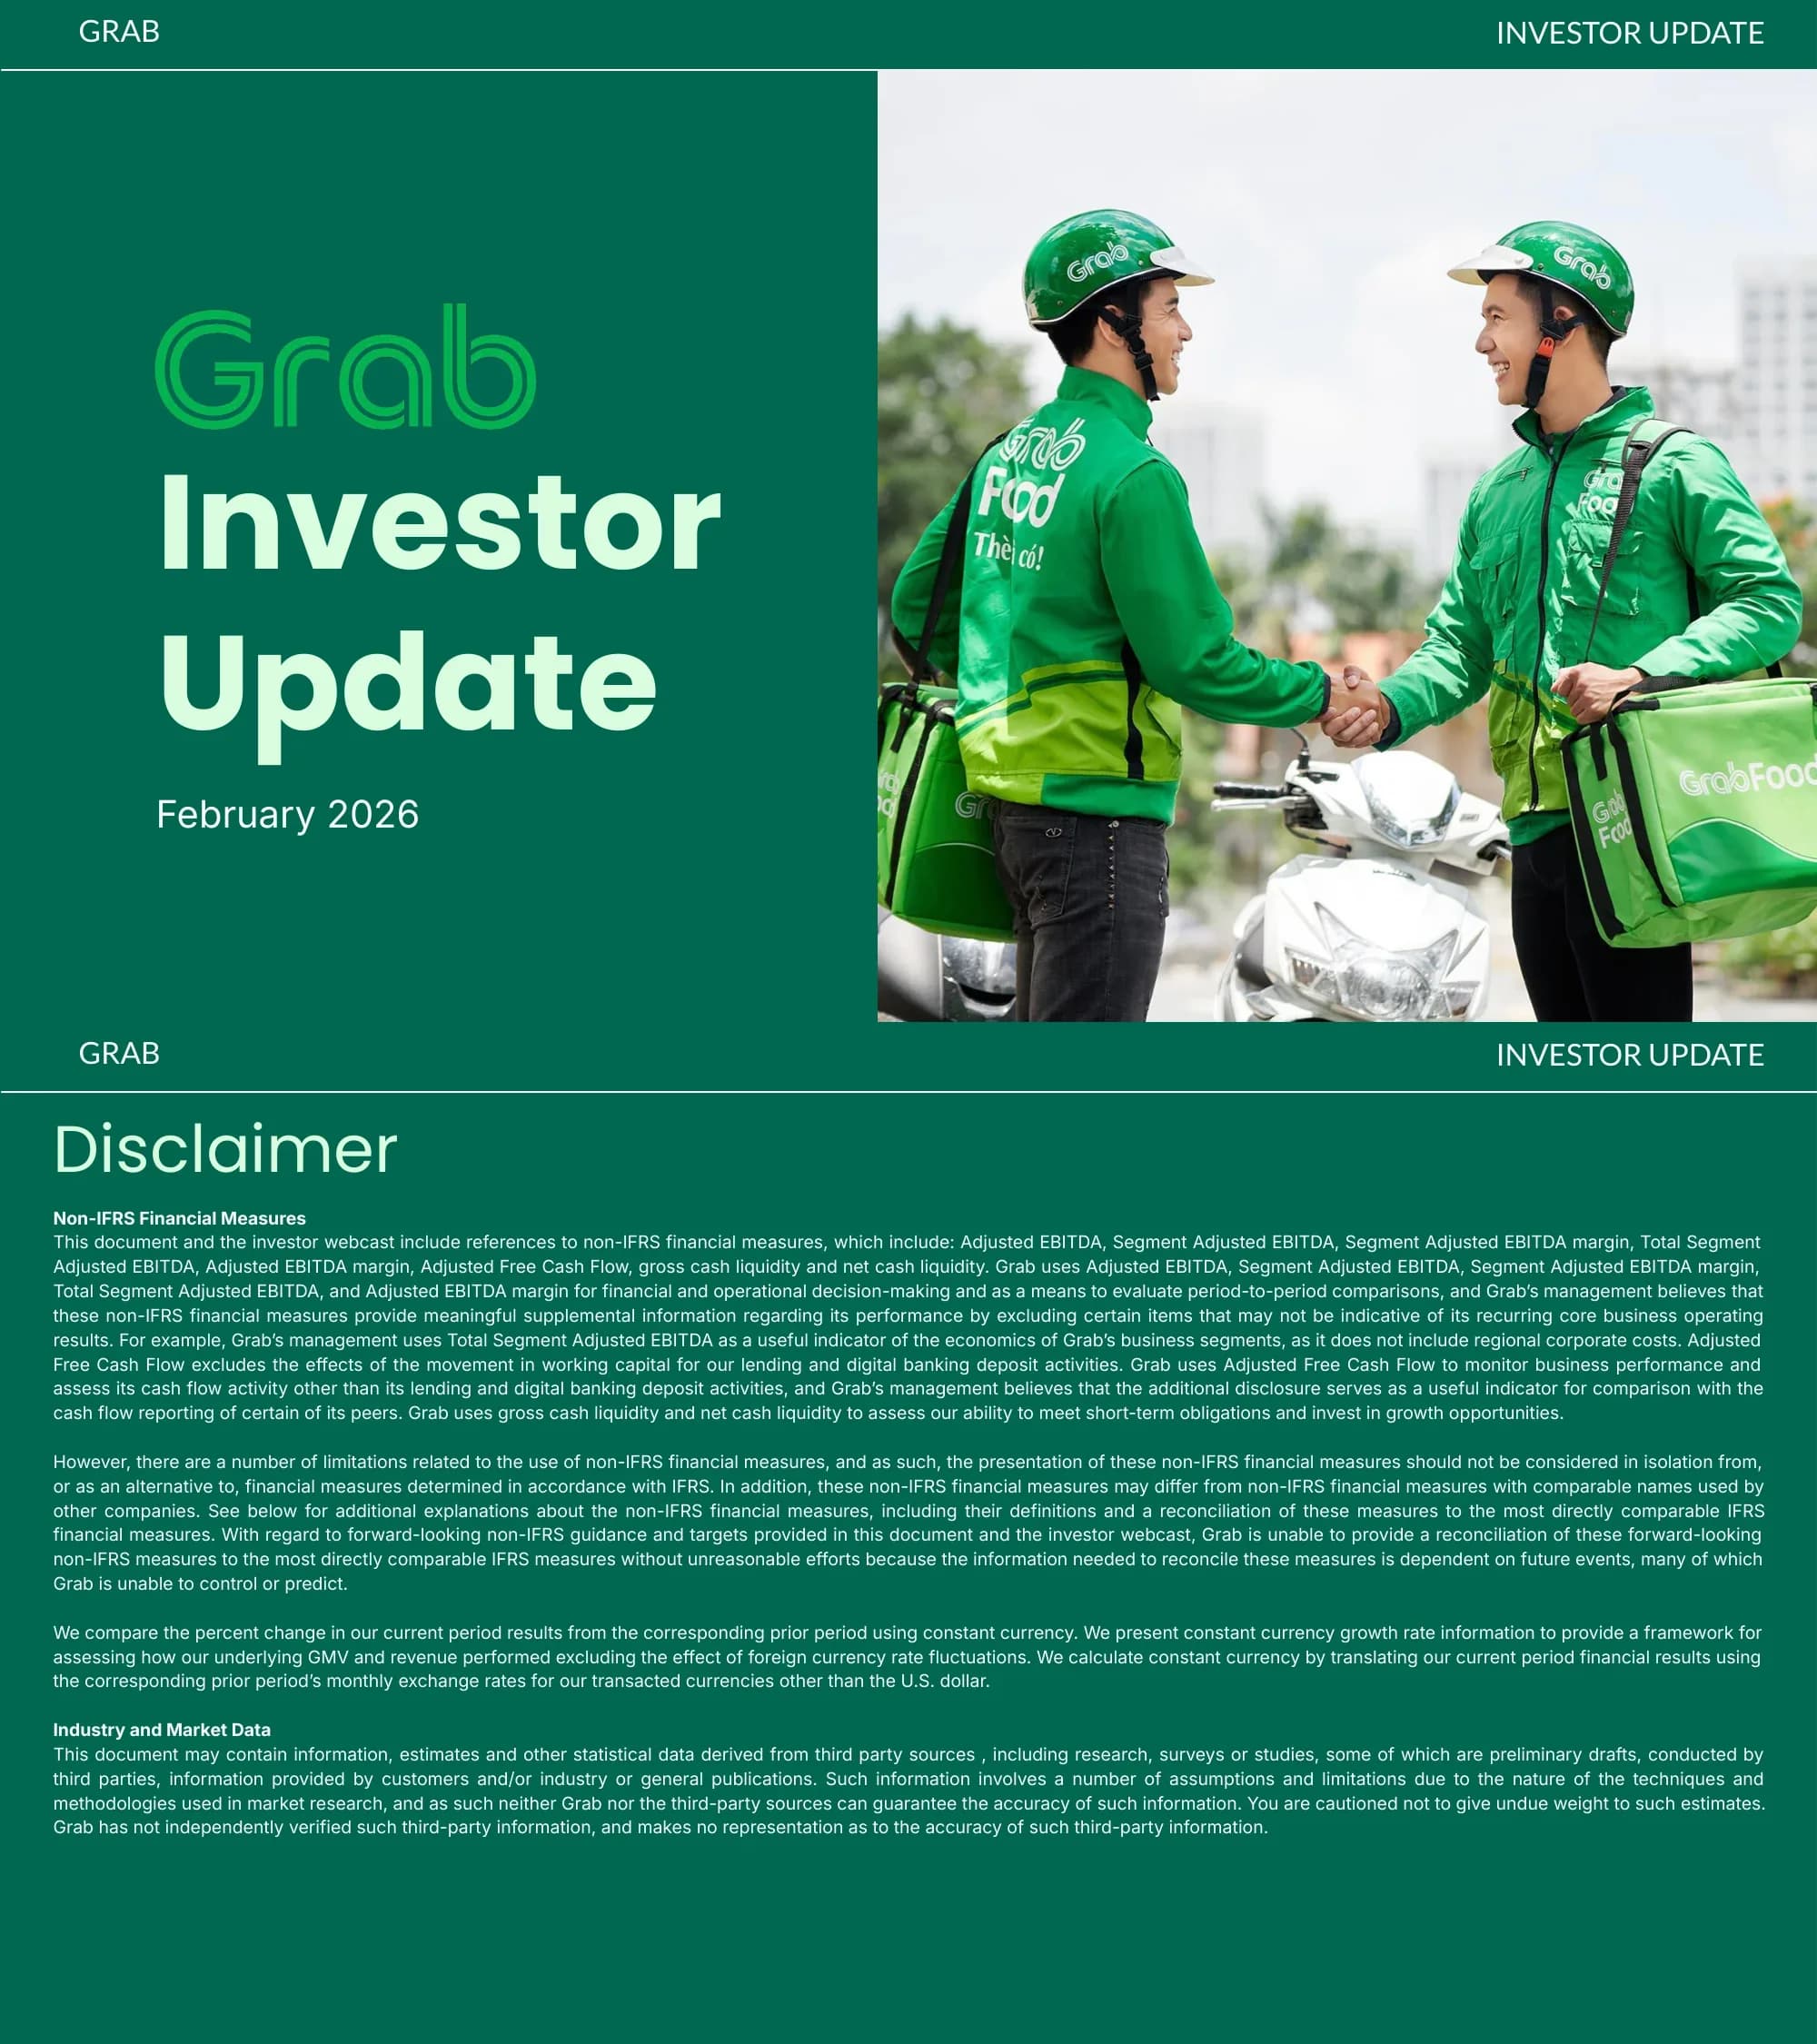
Grab 3-Year Investor Update — Profitable Growth at Scale (February 2026)
Flýtileiðsögn
Merki
Deila glærunum
Grab 3-Year Investor Update — Profitable Growth at Scale (February 2026)
Ítarleg sýn á hverja glærusíðu, þar á meðal útlit, lykilefni og sjónræna þætti.
Title slide introducing the Grab Investor Update for February 2026, anchored by lifestyle photography of two GrabFood riders shaking hands.
Two-column split: bold wordmark and oversized title on a dark-green left panel, full-bleed photograph on the right.
Legal disclaimer covering non-IFRS measures (Adjusted EBITDA, Segment EBITDA, Free Cash Flow), industry market data sourcing, and constant-currency methodology.
Single-column dense legal text on dark-green background with lime accent headers.
Forward-looking-statements safe-harbor language and notes on unaudited financial data for the periods ended December 31, 2025 and 2024.
Continuation legal layout matching slide 2 with labeled subsections.
Four-section agenda mapping each segment to a presenter: Ken Lek (IR), Anthony Tan (CEO), Alex Hungate (President & COO), and Peter Oey (CFO).
Oversized 'Agenda' headline on left; four labeled rows separated by dashed lines pairing topic to speaker on the right.
Section divider introducing Anthony Tan, Co-Founder and CEO, for the opening remarks portion.
Speaker section divider with stacked title on left, circular portrait and name plate on right.
Timeline highlights from Q4 2021 IPO through Q4 2025 — covering >10B rides, digibank approvals, $500M repurchase programs, autonomous shuttle pilot, $1B loan portfolio, and first full-year profit of $200M.
Curved upward growth-arc timeline with annotated callouts pinned to each quarter.
Comparison of user funnel between 2023 (97M ATU / 35M MTU / 6.3M DTU) and FY2025 (129M ATU / 47M MTU / 7.8M DTU) — with +33% MTU growth, 37% MTU/ATU and 17% DTU/MTU ratios.
Side-by-side concentric circle diagrams with KPI ratios anchored to the right.
Rainbow-arc visualization of Grab's product portfolio expansion from 2021 (Food Delivery, GrabTaxi, Payments) to 2026+ (Drone Delivery, Autonomous Vehicles, Food Lockers, GrabMore).
Concentric arc / rainbow layout with product icons grouped by maturity ring.
Three-panel proof of ecosystem strength: 1 in 15 SEA people transact monthly, On-Demand GMV grew $14.1B → $22.1B (2022–2025), and annual cohorts spend more each year (1.0x → 1.7x).
Three vertical panels divided by dashed lines — pictogram, bar chart, and cohort grid.
Quarterly Adjusted EBITDA progression from Q1 2022 (-$286M) to Q4 2025 (+$148M) overlaid with EBITDA margin trend reaching 16% of group revenue.
Vertical bar chart with overlaid line for margin %, full-width on dark canvas.
Three pillars introduced: (1) Improving affordability and reliability of core offerings, (2) Product-led ecosystem-focused execution to enhance LTV, (3) Unlocking efficiencies via proprietary AI on hyperlocal data.
Three image cards stacked horizontally with caption blocks beneath.
Three guidance metrics revealed: 20% Group Revenue CAGR (2025–2028), $1.50B 2028 Adjusted EBITDA, 80% 2028 Adjusted Free Cash Flow Conversion.
Stacked rows separated by dashed lines, label on left and KPI in oversized lime type on right.
Section divider transitioning to operational highlights presentation by Alex Hungate.
Speaker section divider mirroring slide 5 structure.
Same three-priority overview with the first card highlighted to set up the next deep-dive section.
Three-card overview with the active card visually emphasized.
Indexed chart showing driver earnings per online hour up 29% (2021–2025) while average trip fare fell 16% over the same period.
Headline copy left, dual-line chart right with index baseline.
Mobility MTU penetration by country (SG 35→43%, MY 12→20%, PH 2→6%, TH 3→6%, VN 5→9%, ID 3→4%) and Mobility GMV growth showing >2x in non-capital cities vs capital cities.
Two-panel split: country bar chart left, indexed line chart right.
Deliveries GMV YoY growth comparison: Grab outperformed SEA Food Delivery in 2025 (21% vs 14%) after both recovered from COVID-19 trough.
Headline left, two-line YoY chart right with COVID-19 annotation.
Three deliveries levers: +41% transactions with -8% delivery fee, +25% monthly active merchants (5-Star Eats, Michelin, Signatures), and reduced customer issues per 1,000 transactions throughout 2025.
Three-panel section with chart, badges, and trend line — separated by dashed dividers.
Three-priority overview with the second card (Product-led & Ecosystem-focused execution) emphasized.
Three-card overview with center card highlighted.
Three ecosystem dimensions: 2 in 3 MTUs use 2+ services, deliveries cohort frequency improving post-COVID (1.0x → 1.5x by 2025), and self-reinforcing loyalty flywheel via GrabCoins, GrabUnlimited and GrabVIP.
Three vertical columns with donut chart, retention grid, and circular flywheel diagram.
Travel ecosystem: 20+ global travel partners and 10x increase in Traveller MTUs from 2023 to 2025.
Statistics on left, app screenshot mockups (Transport, Travel eSIM) center-right, lifestyle photography bottom-right.
GrabMart KPIs: 1.6x higher AOV vs Food Delivery, 10% Mart GMV penetration, 13% of Food MTUs cross-sold to Mart, 1.7x higher YoY GMV growth vs Food Deliveries.
Stat tiles on left, two GrabMart phone mockups on right.
Eight merchant offerings showcased — Food Delivery, Grab Signatures, Merchant Lending, Advertising, In-store Payments, AI Assistant, Lifecycle Management — wrapped around merchant lifestyle photography.
Centered horizontal flow with eight numbered service tiles in a wave layout.
Four-stage financial services journey across Payments, Lending, Insurance, and Digital Banking — illustrated with phone mockups including GrabPay, Cash Loans, Insurance protection, and GxS Savings.
Four equal columns with arrow-connected phone mockups underneath bold service labels.
7.4M banking deposit customers in three years; 76% GxS Singapore, 93% GXBank Malaysia, 60% Superbank deposit customers come from Grab/OVO; gross loan portfolio scaling $0.1B (2021) → >$2.0B (2026F).
Three vertical panels: deposits chart, ecosystem leverage Venn-style stats, loan portfolio bar chart.
>$5B AUM, >1M paying subscribers, positive Adjusted EBITDA and cash flow today, and >$60M Adjusted EBITDA contribution target by 2028.
Two-quadrant stat grid on left with Stash brand on phone mockup right.
Three-priority overview emphasizing the third card on training proprietary AI models with hyperlocal data.
Three-card overview with right card highlighted.
Six AI use cases: Marketplace Management, Improving Accessibility, Safety and Risk, Search and Personalization, Automated Underwriting, and Sales Optimization.
Two-column message left, 3x2 product-screenshot grid right.
Three cost lines reduced 2022–2025: Cloud costs -166 bps per transaction, Net Cost of Funds -33 bps of GrabPay volumes, Staff costs -33 ppt of group revenue.
Three vertical bar-chart panels with labeled deltas.
Showcase of seven AV/robotics partners — Hesai, Momenta, May Mobility, Vay, A2Z Autonomous, WeRide, Infermove — alongside Grab app super-app screenshot.
Headline left, 3x3 partner logo wall center, app screenshot right.
Recap of all three strategic priorities — affordability, ecosystem-focused execution, AI efficiency — with the AI card highlighted.
Three-card recap layout.
Section divider introducing Peter Oey, Chief Financial Officer, for the financial roadmap section.
Speaker section divider matching prior speaker dividers.
Group Revenue +19% YoY (+17% constant currency), On-Demand GMV +21% YoY (+20% constant currency), Adjusted EBITDA $148M (+54% YoY), Adjusted Free Cash Flow $76M (+$7M YoY).
Lifestyle photo on left; four stacked metric rows on right separated by dashed dividers.
On-Demand GMV bar chart from $11.5B (2021) to $22.1B (2025) overlaid with YoY % growth, alongside three milestones: Q3 2023 first EBITDA-positive quarter, FY2024 positive full-year FCF, FY2025 first full-year profit.
Two-panel layout — chart on left, three vertical-dot-connected milestones on right.
Four-pillar roadmap: Growth (sustainable top-line via product-led strategy), Profitability (operating leverage), Free Cash Flow (CAPEX/working-capital prudence), Balance Sheet (capital allocation discipline).
Four arrow-connected card panels in a single horizontal flow.
FY2026 guidance: Group Revenue $4.04B–$4.10B (20–22% YoY) and Adjusted EBITDA $700M–$720M (40–44% YoY).
Two stacked rows separated by dashed divider — label on left, range in oversized lime on right.
Reiteration of the three North-Star metrics: 20% Group Revenue CAGR 2025–2028, $1.50B 2028 Adjusted EBITDA, 80% 2028 Adjusted FCF Conversion.
Mirror of slide 12 layout for emphasis.
Illustrative waterfall from 2025 base to 2028F via City and product expansion, User growth, Frequency growth, Affordability/Subscriptions, AOV expansion, High Value Rides Cross-Sell, Financial services (Lending, Payments), and Merchant solutions (Advertising, Dine-In).
Single waterfall chart with growth-arrow overlay.
Three drivers: On-Demand scale (volume growth, margin expansion, lower cost to serve), Fintech accretion (scaling lending, lower credit cost %), Corporate cost discipline (operating leverage, AI efficiencies, cloud optimization) — combining for 3x EBITDA by 2028F.
Three-card formula on left (A + B + C =), 2025 vs 2028F mini bar chart on right.
FCF conversion progression: 52% in 2024 ($313M EBITDA → $162M FCF), 58% in 2025 ($500M → $290M), 80% in 2028F ($1,500M → $1,200M) — driven by operating leverage, CAPEX management, and tax management.
Three time-step paired bars on left, explanatory callout box on right.
Four capital-allocation principles: disciplined organic investing, selective M&A, strong balance sheet, enhanced shareholder returns — accompanied by announcement of new $500M share repurchase program (bringing total repurchases to $1B).
Four equal text cards on top, repurchase announcement banner across the bottom.
Section divider transitioning into closing remarks.
Centered headline-only divider with wave background.
Question-and-answer divider.
Centered headline-only divider matching slide 42 styling.
Definitions of GMV, On-Demand GMV, Monthly Transacting Users, Partner Incentives, Consumer Incentives, Gross Loan Portfolio.
Single-column dense definitions list.
Definitions of Adjusted EBITDA, Segment Adjusted EBITDA, Adjusted Free Cash Flow, Cash Liquidity, and Net Cash Liquidity.
Single-column dense definitions list matching slide 44 layout.
Algengar spurningar um þessa glæru og undirliggjandi kynningarefni.
It's a 45-slide investor update template modeled on Grab's February 2026 deck — designed for quarterly earnings supplements, investor days, board reviews, and 3-year strategic-roadmap presentations. It works for any growth-stage or public-company storytelling, especially platform/super-app and fintech businesses.
Yes. The PowerPoint version uses native PPT shapes, charts, and text — every number, label, and bar can be edited directly without external design tools. Photographs and brand-specific lockups can be swapped for your own assets.
The full 45-slide flow is sized for a 30–45 minute investor webcast: ~5 min Welcome + Opening, 15 min Operational Highlights, 15 min Financial Roadmap, plus Closing Remarks and Q&A. You can shorten it by removing the section dividers (slides 5, 13, 19, 27, 32, 42) for a tighter 25-minute version.
Yes — Slides 2–3 (Disclaimer, Forward-Looking Statements) and Slides 44–45 (Appendix definitions of Operating Metrics and Non-IFRS Financial Measures) are pre-built with placeholder language that your legal/IR team can replace with company-specific copy.
Yes. While the example uses Grab's super-app context, the layouts (timeline, KPI funnel, ecosystem map, waterfall, cohort grid, capital allocation framework) are universal investor-presentation patterns. Replace the icons, partner logos, and product names to fit any vertical — SaaS, retail, healthcare, energy, etc.
A dark forest-green (#0E5A4A-ish) background with lime-green (#C0FF3A-ish) accent and white/mint typography. The headline weight is heavy sans-serif. You can rebrand to your own palette by swapping the theme colors in the master slide.
Placeholder portraits and lifestyle photography are embedded so you can preview the look. For client-facing presentations, replace these with your own licensed imagery — the circular masks and crops are pre-set so any photo will fit.
Yes — both formats are provided. Use the PDF for fast preview and review cycles, and edit the PPTX as your working master. The PPTX retains all chart objects, layout grids, and text styles for full editing flexibility.

Create Your Own Slides
Turn your ideas into professional presentations in seconds with 2slides AI.
Sæktu innblástur í faglega hönnun, veldu þinn stíl og búðu til glærur með fullkominni textabirtingu. Knúið af Nano Banana—byrjaðu að búa til kynninguna þína núna.
Your AI Agent for slides. Save time, shine faster with intelligent presentation creation.




© 2026 2slides. All rights reserved.