
Bagian dari Contoh presentasi investor
Raymond James Financial (NYSE: RJF) fourth quarter and fiscal 2026 earnings presentation, dated October 28, 2026 and filed with the SEC as an exhibit to Form 8-K. Raymond James' fiscal year ends September 30, so fiscal Q4 2026 (4Q26) covers July through September 2026. The 24-slide deck reports record quarterly net revenues of $4,269 million (up 15% year over year), diluted EPS of $3.40 and adjusted diluted EPS of $3.59, full-year FY 2026 net revenues of $15,791 million, $1.94T of client assets under administration, segment results for the Private Client Group, Capital Markets, Asset Management and Bank, the domestic cash sweep and Enhanced Savings Program balances, net interest income and RJBDP fees, expenses, capital ratios, capital return, and a full set of non-GAAP reconciliations.
Menggunakan sampul presentasi ini sebagai referensi gaya untuk slide yang dibuat dari konten Anda sendiri. Atau pilih halaman mana pun di bawah untuk memakai tata letaknya sebagai referensi.
Navigasi Cepat
Tag
Bagikan slide
Raymond James Financial (NYSE: RJF) fourth quarter and fiscal 2026 earnings presentation, dated October 28, 2026 and filed with the SEC as an exhibit to Form 8-K. Raymond James' fiscal year ends September 30, so fiscal Q4 2026 (4Q26) covers July through September 2026. The 24-slide deck reports record quarterly net revenues of $4,269 million (up 15% year over year), diluted EPS of $3.40 and adjusted diluted EPS of $3.59, full-year FY 2026 net revenues of $15,791 million, $1.94T of client assets under administration, segment results for the Private Client Group, Capital Markets, Asset Management and Bank, the domestic cash sweep and Enhanced Savings Program balances, net interest income and RJBDP fees, expenses, capital ratios, capital return, and a full set of non-GAAP reconciliations.
Tampilan detail setiap halaman slide, termasuk tata letak, konten utama dan elemen visual.
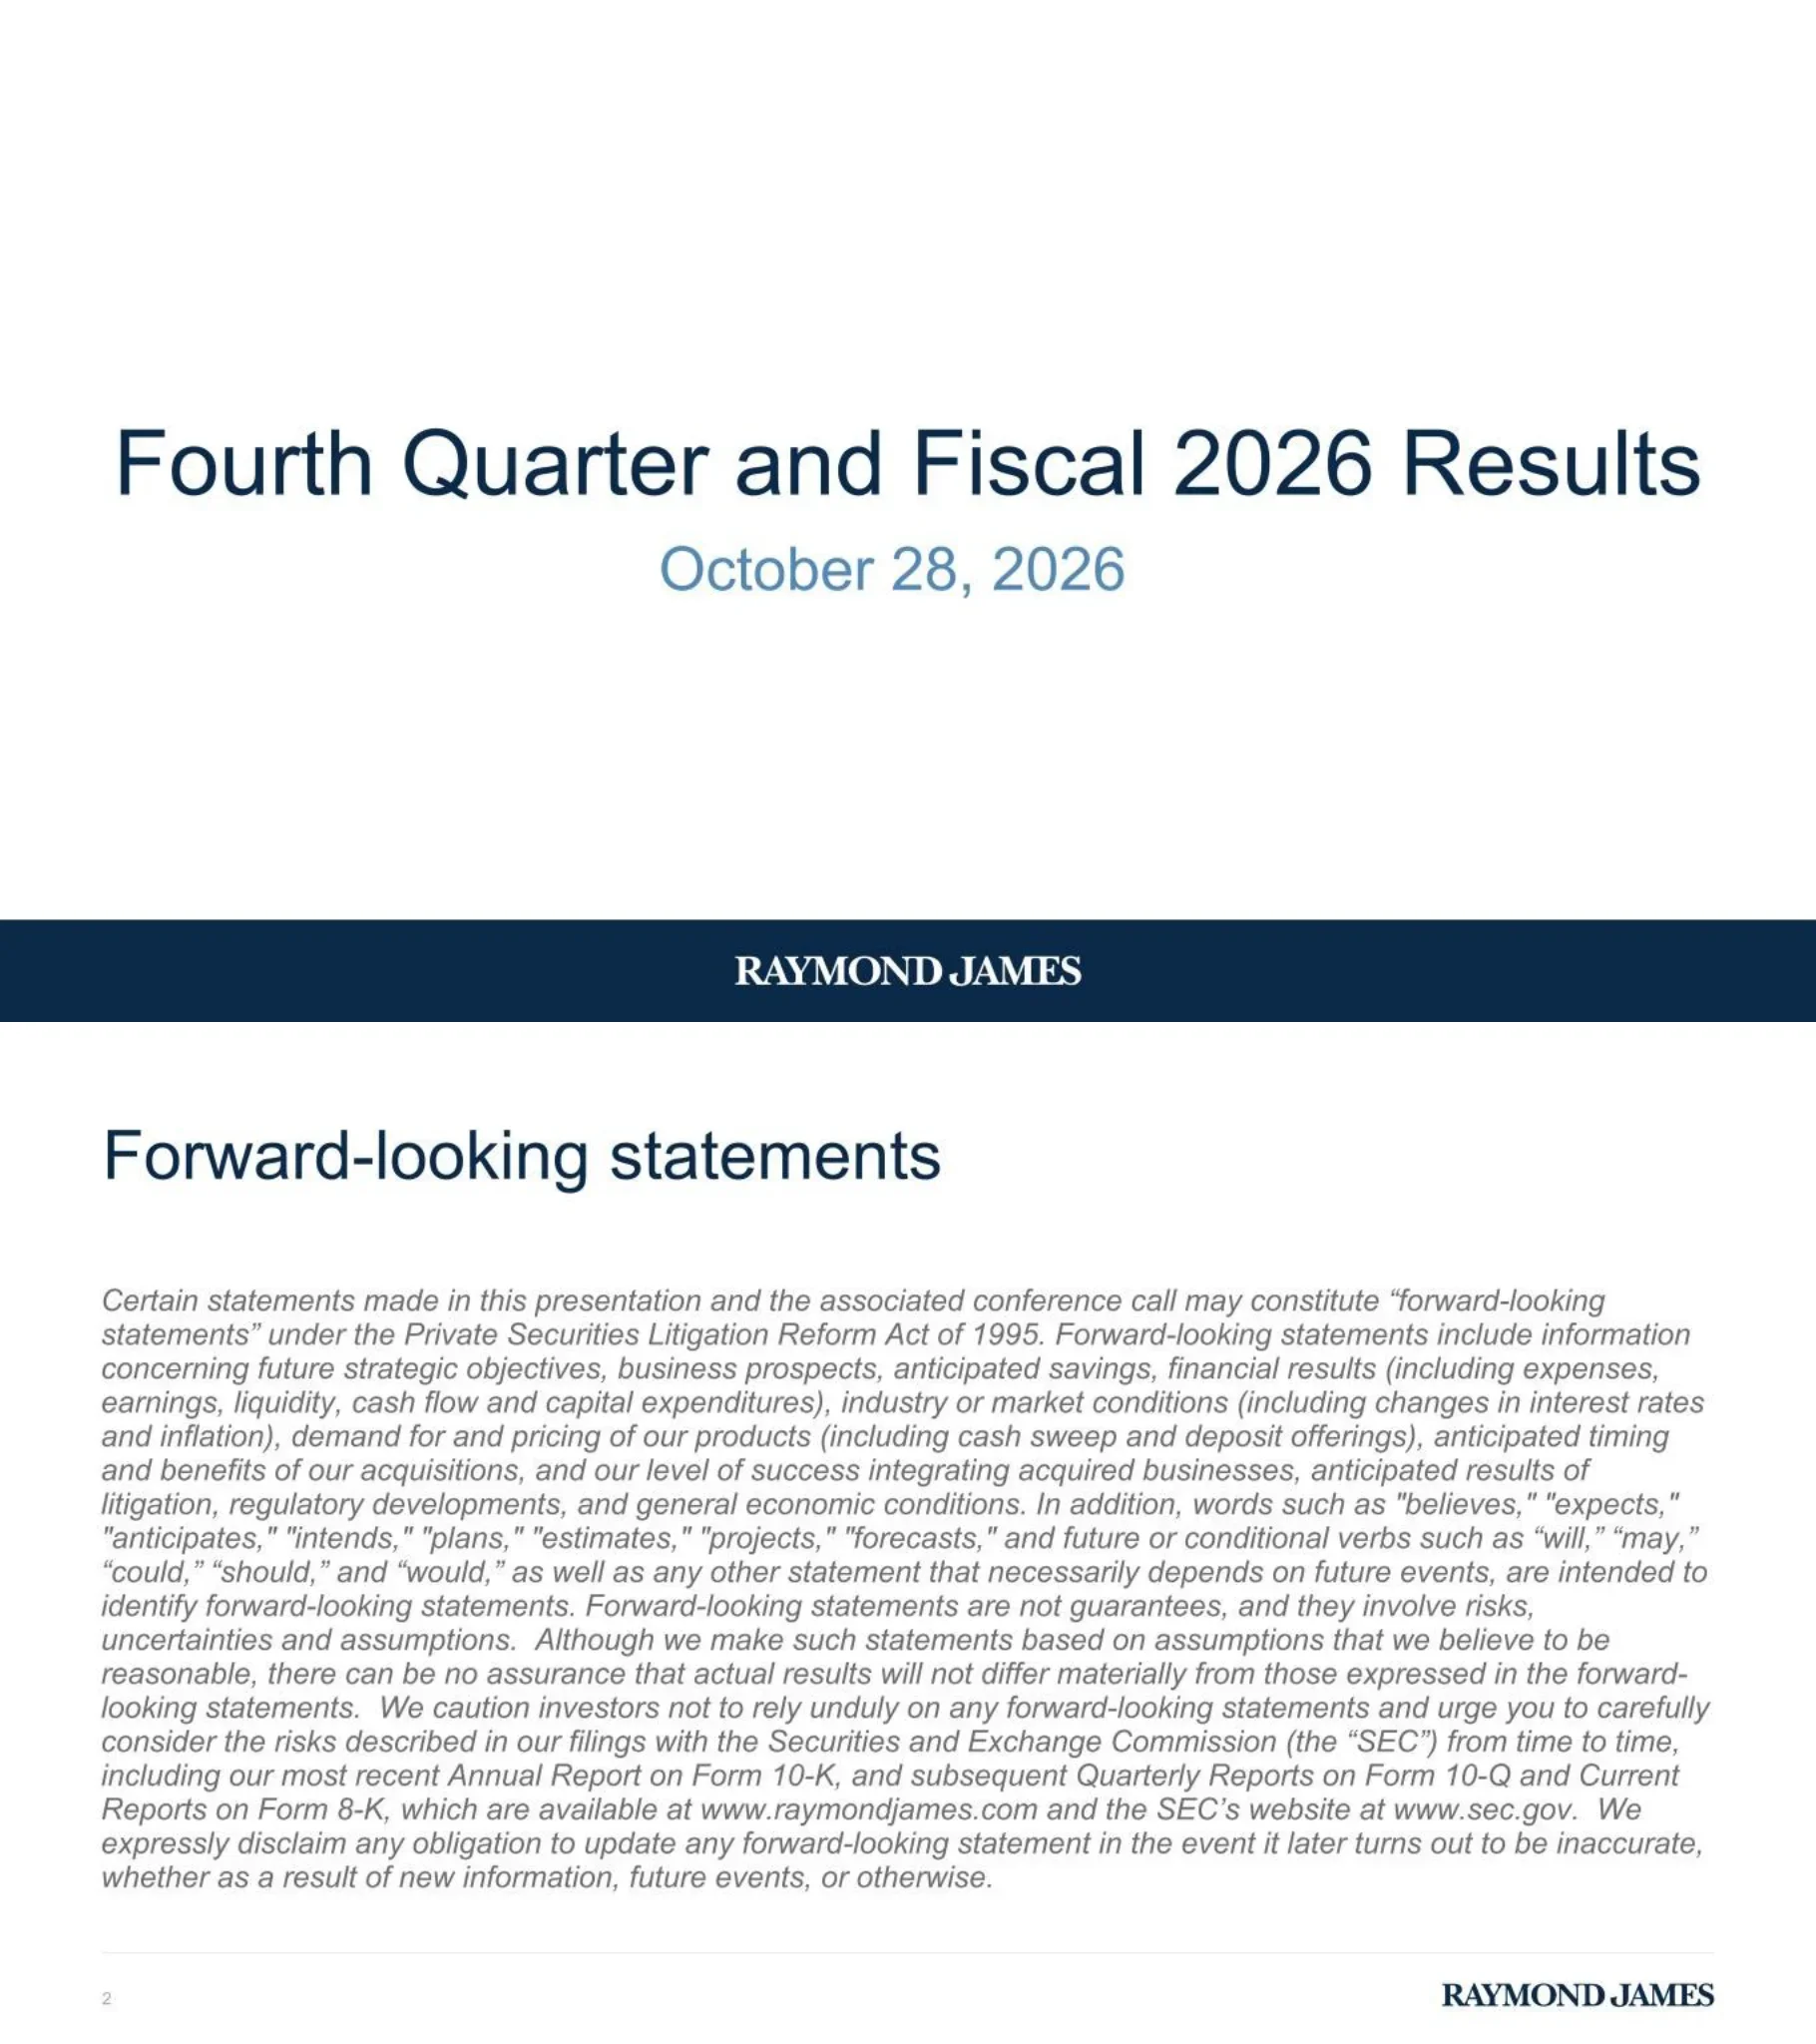
Cover slide titled 'Fourth Quarter and Fiscal 2026 Results', dated October 28, 2026, with the Raymond James wordmark in a navy footer band.
Centered large navy title with a lighter steel-blue date line beneath it on a white background; full-width dark navy band across the bottom carrying the white serif RAYMOND JAMES logo.
Safe-harbor disclaimer under the Private Securities Litigation Reform Act of 1995, covering statements about strategic objectives, financial results, interest rates and inflation, pricing of cash sweep and deposit offerings, acquisitions, litigation and regulation; it directs investors to the company's Form 10-K, 10-Q and 8-K filings at raymondjames.com and sec.gov.
Navy left-aligned title above a single full-width block of grey italic body text; slide number bottom-left and logo bottom-right above a thin rule.
Section divider introducing the strategic overview presented by Paul Shoukry, Chief Executive Officer, Raymond James Financial.
Large navy section title left-aligned in the upper middle, presenter name and title in bold steel blue below; navy horizontal band near the bottom with the logo underneath.
Three-panel summary of the quarter. Earnings: $4.3B net revenues; 20.2% pre-tax margin and 21.3% adjusted pre-tax margin; $3.40 diluted EPS and $3.59 adjusted diluted EPS; 20.6% return on common equity and 26.6% adjusted ROTCE. Key performance metrics: $1.94T client assets under administration; $1.16T PCG assets in fee-based accounts; $22.8B domestic PCG net new assets at a 5.3% growth rate; $58.0B clients' domestic cash sweep and ESP balances; $57.5B bank loans, net. Capital and liquidity: $50M common share repurchases; $104M common stock dividends; 12.1% Tier 1 leverage ratio (estimated); $2.9B RJF corporate cash. Footnotes define non-GAAP measures and the net-new-asset growth calculation (as of and for the three months ended September 30, 2026).
Three equal-width vertical cards in a gradient of blues: dark navy 'Earnings' card with paired GAAP vs adjusted figures separated by vertical rules, mid-blue 'Key Performance Metrics' card and light teal-blue 'Capital & Liquidity' card, each with stacked big-number-plus-label entries; small footnote text along the bottom.
Section divider introducing the financial review presented by Butch Oorlog, Chief Financial Officer, Raymond James Financial.
Same section-divider layout as page 3: large navy title, steel-blue presenter line, navy band near the bottom.
Summary results ($ in millions except per-share): 4Q26 net revenues $4,269 (up 15% vs 4Q25, up 9% vs 3Q26) and FY 2026 $15,791 (up 12%); pre-tax income $862 (18%, 15%) and FY $3,075 (13%); adjusted pre-tax income $909 and FY $3,201; net income available to common shareholders $666 (10%, 12%) and FY $2,365 (11%); adjusted net income $703 and FY $2,464; diluted EPS $3.40 (15%, 13%) and FY $11.91 (16%); adjusted diluted EPS $3.59 and FY $12.41 (16%). Other highlights: pre-tax margin 20.2% (4Q25 19.6%, 3Q26 19.1%; FY 2026 19.5% vs FY 2025 19.3%); adjusted pre-tax margin 21.3%; annualized ROE 20.6%; adjusted ROE 21.7%; adjusted ROTCE 26.6% (FY 2026 23.0% vs 21.3%). Circled values mark record results.
Wide financial table with navy header bars for 4Q26, vs. 4Q25, vs. 3Q26, FY 2026 and vs. FY 2025; current-period columns shaded light grey; record values outlined with blue ovals and a 'Record result' legend oval at bottom right; second header row for the 'Other selected financial highlights' block.
Net revenues by segment ($ millions, 4Q26 / FY 2026): Private Client Group $3,056 (up 15% YoY, 8% QoQ) / $11,475 (13%); Capital Markets $549 (7%, 15%) / $1,870 (6%); Asset Management $409 (30%, 13%) / $1,424 (20%); Bank $483 (5%, (1)%) / $1,944 (9%); consolidated $4,269 / $15,791. Pre-tax income: PCG $458 (10%, 8%) / $1,736 (1%); Capital Markets $106 (18%, 121%) / $214 (47%); Asset Management $170 (29%, 19%) / $593 (18%); Bank $180 (35%, (13)%) / $725 (48%); consolidated $862 / $3,075. A note says FY 2025 Capital Markets results included a $58M reserve increase tied to the settlement of a legal matter.
Same table system as page 6 with two blocks (Net revenues, Pre-tax income) under underlined navy subheadings; record values circled; 'Record Result' oval legend.
4Q26 revenue lines ($ millions): asset management and related administrative fees $2,307 (up 23% YoY, 11% QoQ); brokerage revenues $614 (1%, (2)%); account and service fees $333 (12%, 5%); investment banking $370 (17%, 27%); interest income $1,034 (2%, 4%); other $81 (1%, 42%); total revenues $4,739 (13%, 9%); interest expense $(470) (2%, 8%); net revenues $4,269 (15%, 9%).
Single centered table with navy header (4Q26, vs. 4Q25, vs. 3Q26), grey-shaded value column, subtotal rules above total revenues and net revenues; generous white space below.
Clients' domestic cash sweep and Enhanced Savings Program balances ($B) over five quarters: 4Q25 $56.4B, 1Q26 $58.1B, 2Q26 $57.8B, 3Q26 $58.8B, 4Q26 $58.0B. 4Q26 mix: RJBDP Bank Segment 24.7, RJBDP Third-Party Banks 16.4, Client Interest Program 1.8, ESP 15.0. Balances as a percentage of domestic PCG AUA moved from 3.7% (4Q25 to 2Q26) to 3.4% (3Q26 and 4Q26). Year-over-year change 3%; sequential change (1)%. Footnotes explain the Raymond James Bank Deposit Program (RJBDP) and ESP.
Five stacked columns in four shades from navy to light grey with segment values labeled inside, totals above each column, and a black line series plotting the percentage of AUA across the top; dual vertical axis titles; legend and YoY/sequential change callout at the bottom.
Combined firmwide net interest income and RJBDP fees from third-party banks ($ millions): 4Q25 653 (551 + 102), 1Q26 667 (566 + 101), 2Q26 650 (557 + 93), 3Q26 658 (560 + 98), 4Q26 674 (564 + 110); year-over-year change 3%, sequential change 2%. Net interest margin, firmwide vs Bank segment: 4Q25 2.78% / 2.71%, 1Q26 2.75% / 2.81%, 2Q26 2.74% / 2.81%, 3Q26 2.67% / 2.71%, 4Q26 2.60% / 2.60%. Average yield on RJBDP third-party bank balances: 2.91%, 2.76%, 2.70%, 2.75%, 2.81%.
Top half: compact stacked column chart with legend and change callout. Bottom half split by a vertical rule into a paired-bar NIM chart (left) and a solid navy area chart of RJBDP yield (right).
4Q26 expenses ($ millions): compensation, commissions and benefits $2,774 (up 16% YoY, 8% QoQ); communications and information processing $208; occupancy and equipment $87; business development $95; investment sub-advisory fees $70; professional fees $56; bank loan benefit for credit losses $(8); other $125; total non-compensation expenses $633 (5%, 6%); total non-interest expenses $3,407 (14%, 7%). Total compensation ratio by quarter: 64.2%, 65.6%, 65.8%, 65.7%, 65.0% (adjusted 64.0%, 65.4%, 65.7%, 65.5%, 64.6%). Non-compensation expenses: 602, 557, 583, 599, 633 (pre-provision adjusted 567, 547, 558, 601, 609).
Left two-thirds: expense table with navy header and grey value column. Right third: two stacked paired-bar charts (compensation ratio and non-compensation expenses) separated by a thin rule.
Five-quarter trend of pre-tax margin (19.6%, 19.5%, 19.0%, 19.1%, 20.2%) and adjusted pre-tax margin (20.7%, 20.0%, 19.7%, 19.9%, 21.3%) from 4Q25 to 4Q26.
Minimal line chart: solid navy line for GAAP pre-tax margin and dashed steel-blue line for adjusted margin, data labels above/below each point, quarter labels along the bottom, legend centered below.
4Q26 balance-sheet items ($ billions except per share): total assets $94.4 (up 7% YoY, flat QoQ); RJF corporate cash $2.9 ((22)%, 16%); bank loans, net $57.5 (11%, 2%); total common equity attributable to RJF $13.1 (6%, 3%); book value per share $68.38 (9%, 3%); tangible book value per share $55.96 (3%, 4%); diluted weighted-average shares 195.6 million ((4)%, (1)%). Ratios (4Q26 vs 4Q25 vs 3Q26): Tier 1 leverage 12.1% / 13.1% / 11.7%; Tier 1 capital 23.2% / 23.0% / 21.5%; CET1 23.2% / 22.9% / 21.5%; total capital 24.2% / 24.1% / 22.5%; effective tax rate 22.7% / 17.4% / 20.7%. Capital ratios are estimated.
Two-part table: top block with change columns, bottom ratio block with its own navy sub-header showing prior-period levels; grey-shaded current column.
$1.7B of share repurchases and dividends paid over FY 2026, and $1.05B remaining under the current common stock repurchase authorization (of a $2.0 billion authorization approved December 3, 2025). Quarterly repurchases plus dividends ($ millions): 4Q25 451 (350 + 101), 1Q26 511 (400 + 111), 2Q26 507 (400 + 107), 3Q26 506 (400 + 106), 4Q26 154 (50 + 104). Shares repurchased (millions): 2.1, 2.5, 2.6, 2.6, 0.3 at average prices of $166, $162, $155, $152, $166.
Split layout: left panel with title and two large steel-blue callout figures, separated by a thick vertical navy bar from a right panel containing a stacked column chart and a two-row data table beneath it.
Section divider for the appendix of non-GAAP reconciliations.
Large navy 'Appendix' title on white with the navy band and logo at the bottom.
Explanatory paragraph on why Raymond James uses non-GAAP measures (excluding items not indicative of core results, comparability of periods, usefulness of return on tangible common equity and tangible book value per share), noting that tax effects reflect the statutory rate for each item and that the measures may not be comparable to other companies'.
Long navy title with a justified grey paragraph at the top and the rest of the slide empty; 'continued on next slide' and a footnote reference to slide 24 at the bottom.
Quarterly (Sept 30, 2025 to Sept 30, 2026) and twelve-month reconciliation ($ millions). Net income available to common shareholders 603, 562, 542, 595, 666 (FY 2025 2,130; FY 2026 2,365). Acquisition-related adjustments (retention, other compensation, communications, professional fees, intangible amortization, other) total pre-tax 39, 20, 27, 32, 47 (FY 97 / 126); tax effect (7), (5), (5), (7), (10). Adjusted net income 635, 577, 564, 620, 703 (FY 2,205 / 2,464). Pre-tax income 731, 728, 735, 750, 862 (FY 2,714 / 3,075); adjusted pre-tax income 770, 748, 762, 782, 909 (FY 2,811 / 3,201).
Dense black-on-white accounting table with five quarterly columns and two twelve-month columns divided by a vertical rule; bold subtotals with single and double underlines.
Pre-tax margin 19.6%, 19.5%, 19.0%, 19.1%, 20.2% for the five quarters ended September 30, 2025 through September 30, 2026; acquisition-related adjustments add 1.1, 0.5, 0.7, 0.8 and 1.1 percentage points, giving adjusted pre-tax margin of 20.7%, 20.0%, 19.7%, 19.9% and 21.3%.
Accounting table of percentage impacts by expense line, five quarterly columns, bold totals.
Compensation, commissions and benefits 2,394, 2,450, 2,541, 2,579, 2,774 less acquisition-related compensation 10, 7, 7, 8, 15 gives adjusted compensation of 2,384, 2,443, 2,534, 2,571, 2,759 ($ millions). Total compensation ratio 64.2%, 65.6%, 65.8%, 65.7%, 65.0%; adjusted 64.0%, 65.4%, 65.7%, 65.5%, 64.6%. Non-compensation expenses 602, 557, 583, 599, 633 less bank loan provision/(benefit) 6, (3), 5, (26), (8) and acquisition expenses 29, 13, 20, 24, 32 gives pre-provision adjusted non-compensation expenses of 567, 547, 558, 601, 609.
Three stacked reconciliation blocks in one accounting table, five quarterly columns.
Diluted EPS $2.95 (4Q25), $3.01 (3Q26), $3.40 (4Q26); twelve months $10.30 (FY 2025) and $11.91 (FY 2026). Total non-GAAP adjustments net of tax add $0.16, $0.13, $0.19 and $0.36, $0.50 respectively, giving adjusted diluted EPS of $3.11, $3.14, $3.59, $10.66 and $12.41.
Per-share reconciliation table with three quarterly and two twelve-month columns separated by a vertical rule.
Total common equity attributable to Raymond James Financial $12,424 (Sept 30, 2025), $12,699 (June 30, 2026), $13,128 (Sept 30, 2026) ($ millions); less goodwill and intangibles 1,847 / 2,608 / 2,618 net of deferred tax liabilities (144) / (232) / (235), giving tangible common equity $10,721 / $10,323 / $10,745. Common shares outstanding 198.1 / 192.1 / 192.0 million. Book value per share $62.72 / $66.11 / $68.38; tangible book value per share $54.12 / $53.74 / $55.96.
Compact three-column point-in-time table in the upper half; the rest of the slide is white space.
Average common equity $12,302 (4Q25), $12,633 (3Q26), $12,914 (4Q26); twelve months $12,035 (FY 2025) and $12,662 (FY 2026) ($ millions). Net-of-tax acquisition adjustments of 16, 13, 19, 32 and 43 give adjusted average common equity of $12,318, $12,646, $12,933, $12,067 and $12,705.
Accounting table with quarterly and twelve-month column groups, line items mirroring the acquisition-expense categories.
Average tangible common equity $10,592, $10,527, $10,534 (quarters ended Sept 30, 2025, June 30, 2026, Sept 30, 2026) and $10,315 / $10,664 (twelve months); adjusted average tangible common equity $10,608, $10,540, $10,553, $10,347, $10,707. Return on common equity 19.6%, 18.8%, 20.6% (FY 17.7% / 18.7%); adjusted ROE 20.6%, 19.6%, 21.7% (FY 18.3% / 19.4%); ROTCE 22.8%, 22.6%, 25.3% (FY 20.6% / 22.2%); adjusted ROTCE 23.9%, 23.5%, 26.6% (FY 21.3% / 23.0%).
The densest table in the deck, running nearly the full slide height, with return ratios summarized in the bottom rows.
Nine numbered footnotes defining acquisition-related retention awards, amortization of identifiable intangible assets, pre-tax margin, total compensation ratio, pre-provision non-compensation expenses, diluted EPS (including $1 million quarterly and $3 million annual allocations to participating securities), book value and tangible book value per share, average common equity methodology, and return on common equity / ROTCE definitions.
Small grey numbered list filling the top two-thirds of the slide with a hanging-number column on the left.
Pertanyaan umum tentang slide ini dan konten presentasi yang mendasarinya.
Raymond James Financial's fiscal year ends September 30, so fiscal Q4 2026 (4Q26) covers July 1 to September 30, 2026. The deck, dated October 28, 2026, reports both that quarter and the full fiscal year 2026 (October 2025 to September 2026).
It is Raymond James Financial's own earnings presentation, filed with the SEC as an exhibit to Form 8-K and available on EDGAR. The slides were rasterized as images in the SEC filing; this page transcribes every slide in English with figures exactly as they appear.
Net revenues were a record $4,269 million, up 15% year over year; pre-tax income was $862 million; diluted EPS was $3.40 and adjusted diluted EPS $3.59; pre-tax margin was 20.2% (21.3% adjusted); and adjusted ROTCE was 26.6%. Client assets under administration reached $1.94T.
FY 2026 net revenues were $15,791 million (up 12%), pre-tax income $3,075 million (up 13%), diluted EPS $11.91 and adjusted diluted EPS $12.41 (both up 16%). The company returned $1.7B through share repurchases and dividends over the year.
Private Client Group (4Q26 net revenues $3,056 million), Capital Markets ($549 million), Asset Management ($409 million) and Bank ($483 million), with net revenue and pre-tax income for the quarter and fiscal year, plus slides on client cash sweep balances, net interest income and RJBDP fees.
Yes. The page offers the original PDF and an editable PPTX conversion. Because the SEC exhibit stores each slide as an image, the PPTX is a machine conversion: some text is editable but may contain recognition errors, so rely on the PDF for exact figures. It is still useful for referencing layouts like the three-panel KPI highlight slide and the stacked cash-sweep chart.
It is a strong reference: a restrained navy and steel-blue palette, a three-card KPI summary, consistent results tables with circled record figures, five-quarter trend charts, and a complete non-GAAP reconciliation appendix, which is the structure most listed brokers, banks and wealth managers follow.
Original earnings presentation filed by Raymond James Financial as an exhibit to Form 8-K.

Create Your Own Slides
Turn your ideas into professional presentations in seconds with 2slides AI.
Referensikan desain profesional, pilih gaya Anda, dan hasilkan slide dengan rendering teks sempurna. Didukung oleh Nano Banana—mulai buat presentasi Anda sekarang.
Agen AI Anda untuk slide. Hemat waktu, bersinar lebih cepat dengan pembuatan presentasi yang cerdas.


© 2026 2slides. Hak cipta dilindungi.