
2Slides Logo
Preview

Palantir Q4 2025 Investor Presentation

39 slide

Palantir Technologies Q4 2025 Investor Presentation

113 suka
0 unduhan

Navigasi Cepat

Tag

Palantir
PLTR
Q4 2025
Investor presentation
Earnings report

Bagikan slide

Deskripsi

Topik Utama

Palantir Technologies Q4 2025 Investor Presentation

Manfaat Utama

  • Comprehensive Q4 and FY 2025 financial results with detailed revenue breakdowns
  • Strong visual data presentation with dark-themed charts and growth metrics
  • Complete business update covering partnerships, product launches, and strategic initiatives
  • Appendix with detailed reconciliation tables for non-GAAP metrics
  • Professional investor-grade design with clean typography and minimalist aesthetics

Target Audiens

  • Investors and financial analysts tracking Palantir (PLTR) performance
  • Corporate finance professionals preparing earnings presentations
  • Business strategists studying AI and enterprise software growth models
  • Presentation designers seeking inspiration for dark-themed financial decks
  • Technology industry analysts researching AI platform companies

Kasus Penggunaan

  • Reference template for quarterly earnings presentations
  • Financial data visualization design inspiration
  • AI industry competitive analysis and benchmarking
  • Investor relations presentation design reference
  • Enterprise software business model case study

Proposisi Nilai Unik

  • Showcases explosive growth: 70% Y/Y total revenue growth to $1.407B in Q4
  • Industry-leading Rule of 40 score of 127%, far exceeding peers
  • Real-world AI deployment case studies across defense, energy, and enterprise
  • Clean dark-on-light design system with consistent chart styling throughout
  • Complete financial transparency with GAAP to non-GAAP reconciliations

Halaman Slide (39)

Tampilan detail setiap halaman slide, termasuk tata letak, konten utama dan elemen visual.

Halaman 1
title slide

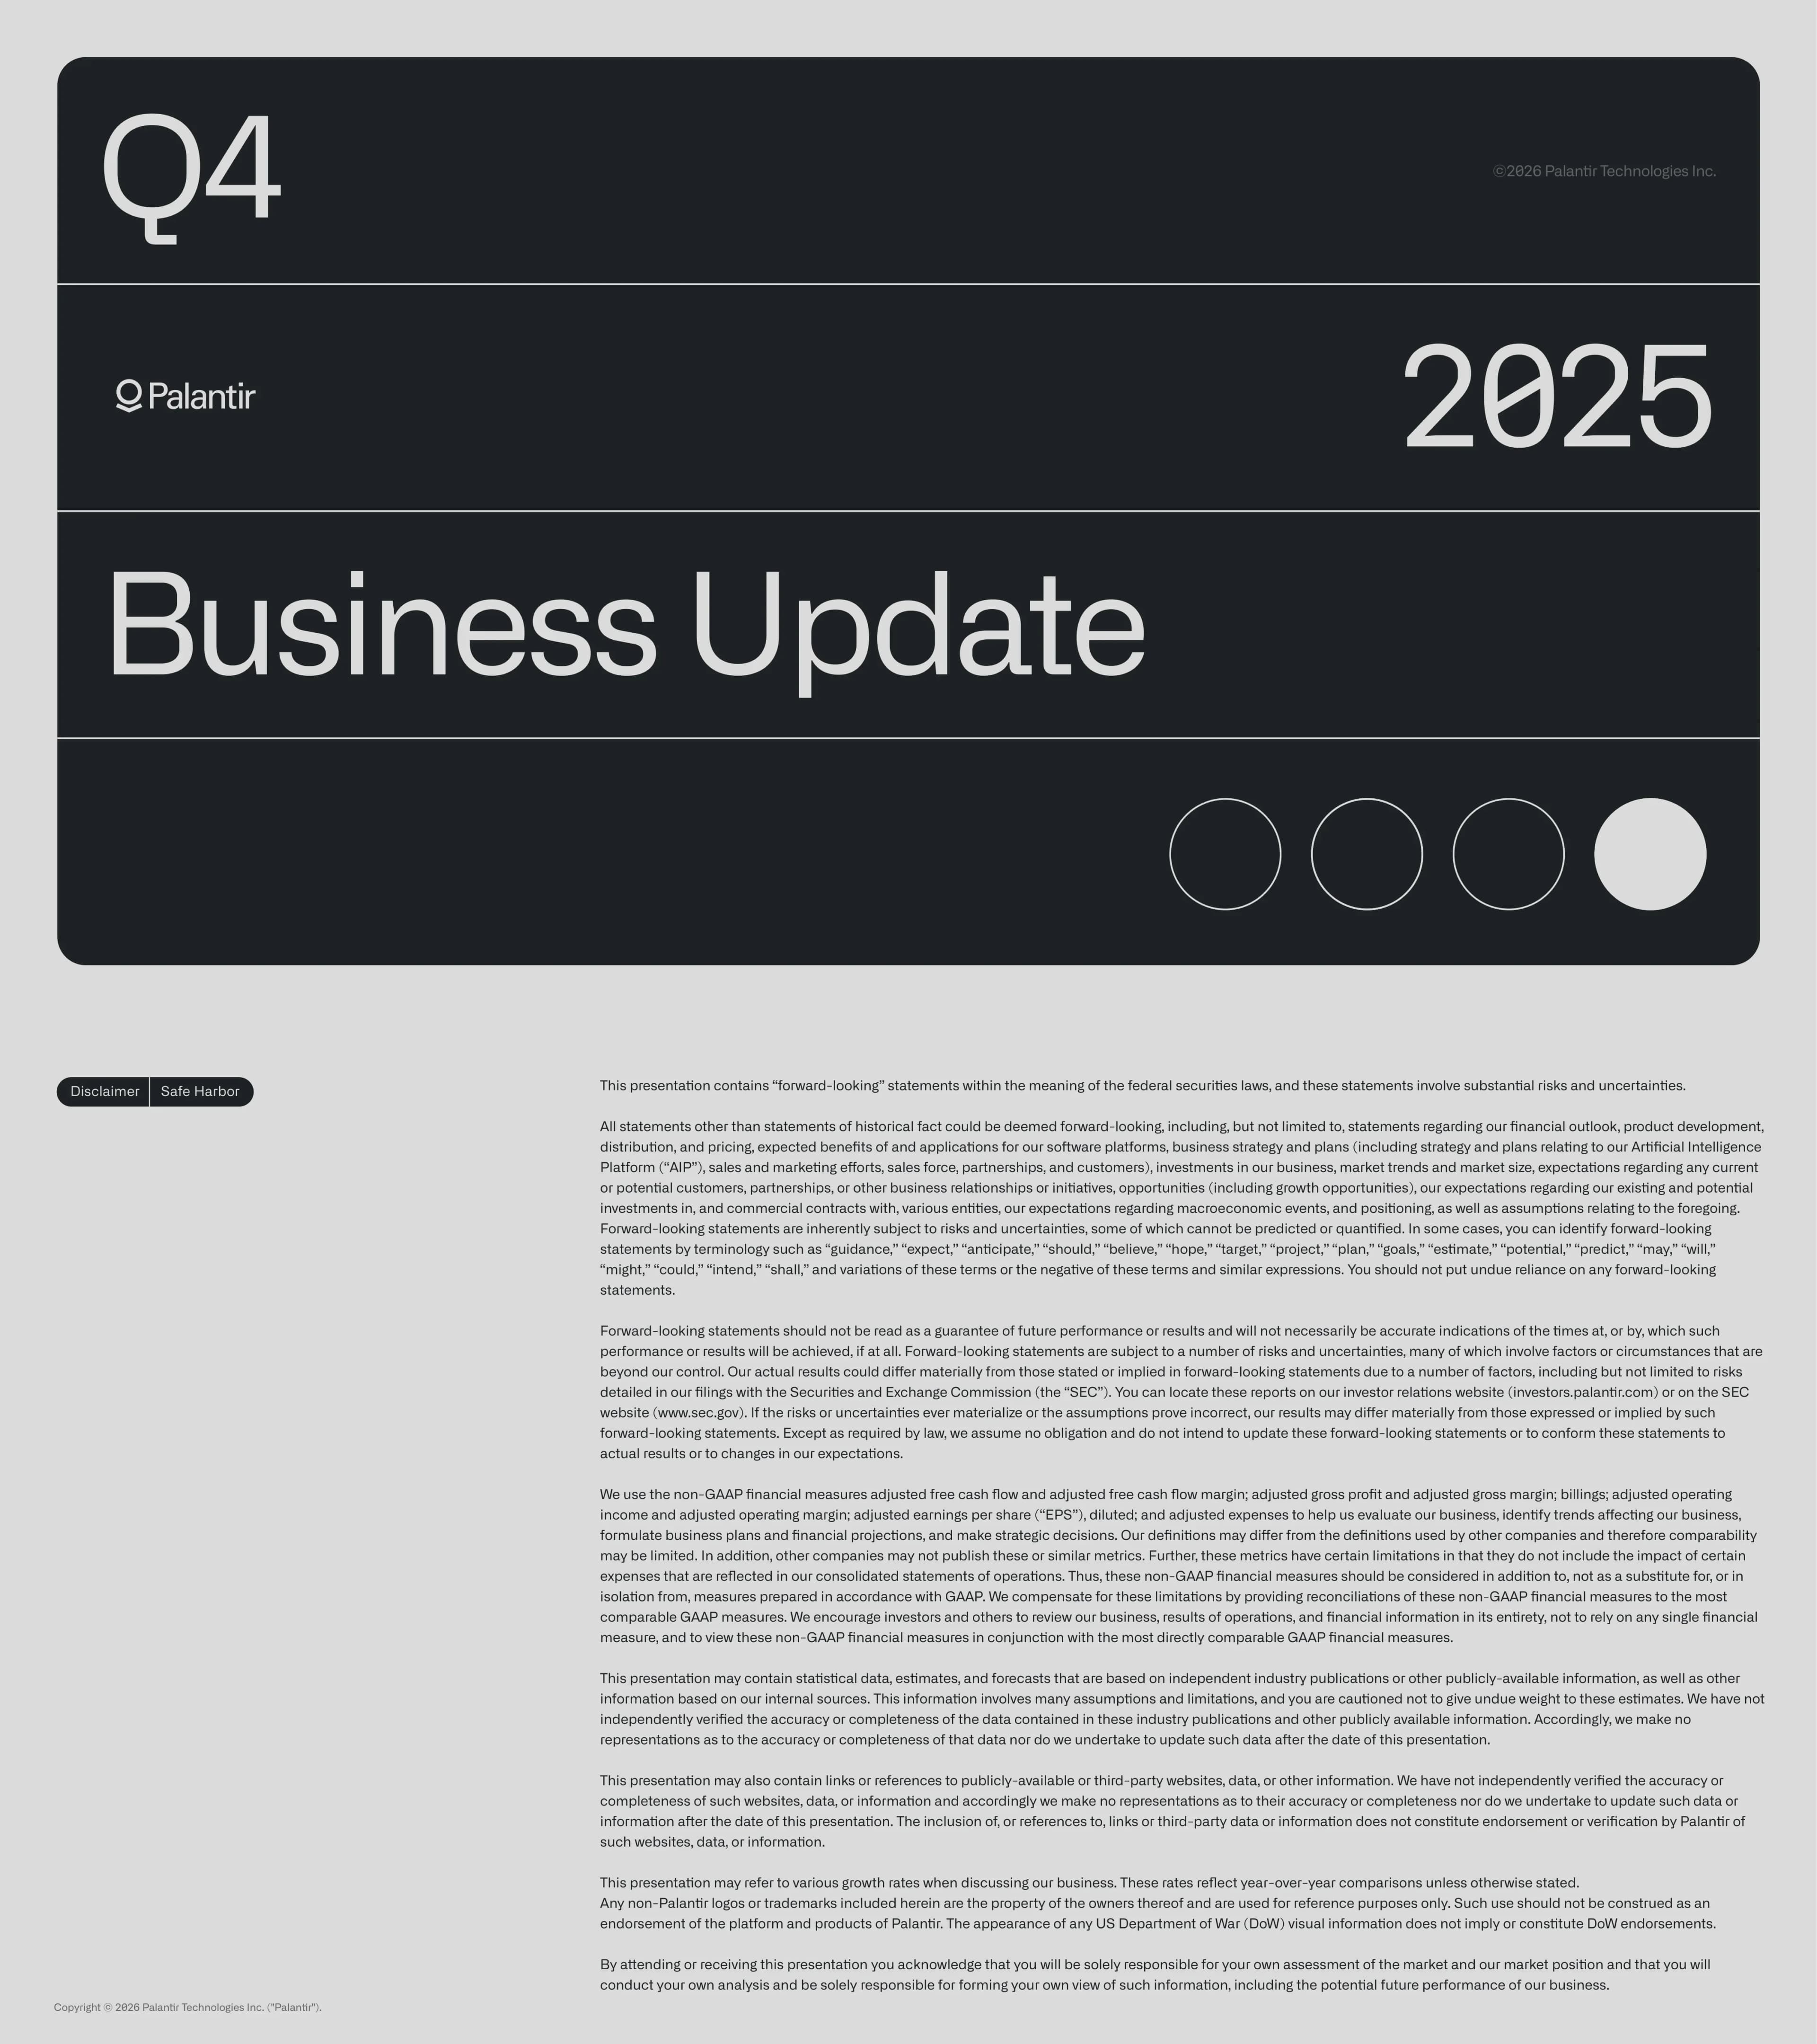
Cover - Palantir Q4 2025

Konten

Title slide with Palantir logo, Q4 designation, year 2025, and four section indicator dots

Struktur Tata Letak

Dark card centered on light gray background with horizontal sections for quarter, logo/year, and title

Elemen Visual Utama

  • Palantir logo
  • Q4 large typography
  • 2025 year
  • Section navigation dots
  • Dark rounded card
Halaman 2
disclaimer

Disclaimer and Safe Harbor

Konten

Forward-looking statements disclaimer, non-GAAP financial measures explanation, and legal safe harbor language

Struktur Tata Letak

Two-column layout with tags on left and dense legal text on right

Elemen Visual Utama

  • Disclaimer and Safe Harbor tags
  • Dense paragraph text
  • Copyright notice
Halaman 3
data visualization

Rule of 40 Enterprise Software

Konten

Scatter plot showing Palantir at 127% Rule of 40, far exceeding all enterprise software peers. X-axis: Adjusted Operating Margin, Y-axis: Y/Y Revenue Growth

Struktur Tata Letak

Split layout with title on left, full scatter chart on right with company ticker labels

Elemen Visual Utama

  • Scatter plot
  • PLTR highlighted in green at 127%
  • Rule of 120 frontier line
  • Competitor company dots
  • Dark chart background
Halaman 4
highlights summary

Q4 2025 Highlights

Konten

12 key metrics including US revenue +93% Y/Y, US commercial revenue +137% Y/Y, total revenue +70% Y/Y, Rule of 40 at 127%, 180 deals closed at $1M+, adjusted FCF $791M

Struktur Tata Letak

Single column with alternating gray/white striped rows for each bullet point

Elemen Visual Utama

  • Arrow bullet points
  • Underlined growth percentages
  • Alternating row backgrounds
  • Fine print footnotes
Halaman 5
highlights summary

FY 2025 Highlights

Konten

Full year metrics: US revenue +75% Y/Y to $3.32B, US commercial +109% Y/Y, revenue +56% Y/Y to $4.48B, Rule of 40 at 106%, adjusted FCF $2.27B, TCV $10.8B +128% Y/Y

Struktur Tata Letak

Single column with alternating dark striped rows on dark background

Elemen Visual Utama

  • Arrow bullet points
  • Underlined growth rates
  • Dark theme consistent styling
Halaman 6
case study

Rebuilding American Seapower - ShipOS

Konten

Palantir and U.S. Navy launched ShipOS deploying Foundry and AIP across maritime industrial base. Quote from Secretary of the Navy John Phelan. Stats: submarine schedule planning reduced from 160 hours to 10 minutes

Struktur Tata Letak

Split layout with text and quote on left, submarine photo with stat callouts on right

Elemen Visual Utama

  • Virginia-class submarine photo
  • Before/after stat cards
  • Secretary of Navy quote
  • Learn More link
Halaman 7
initiative spotlight

Turning Warfighters into AI Builders

Konten

American Tech Fellowship trains builders on AIP through 12-week program. Launching ATF for Veterans (ATF-V) for veterans, active-duty, and reservists

Struktur Tata Letak

Split layout with headline and description on left, military personnel photo on right

Elemen Visual Utama

  • Military personnel with laptop photo
  • Blue-toned industrial setting
  • Learn More link
Halaman 8
partnership announcement

Palantir and Accenture Partnership

Konten

Partnership to deploy forward-deployed engineers alongside 2,000+ Palantir-skilled Accenture professionals across healthcare, telecom, manufacturing, consumer goods, and financial services

Struktur Tata Letak

Split layout with text on left, abstract purple visual on right, dual logos at bottom

Elemen Visual Utama

  • Palantir and Accenture logos
  • Abstract purple blade pattern
  • Learn More link
Halaman 9
partnership announcement

Palantir and HD Hyundai Partnership

Konten

HD Hyundai scaling Foundry and AIP across shipbuilding, refineries, construction equipment, robotics, and electric systems in Korea

Struktur Tata Letak

Split layout with text on left, Hyundai shipyard crane photo on right, dual logos

Elemen Visual Utama

  • HD Hyundai shipyard photo
  • Orange crane
  • Dual company logos
  • Learn More link
Halaman 10
product launch

Chain Reaction - OS for American AI Infrastructure

Konten

New product launch delivering software to energy producers, grid operators, infrastructure builders, and data centers. Founding partners: CenterPoint Energy and NVIDIA

Struktur Tata Letak

Complex layout with headline and four-column description on left, Chain Reaction branding and partner logos on right

Elemen Visual Utama

  • Chain Reaction logo with gradient blue background
  • CenterPoint Energy and NVIDIA founding partner logos
  • Four-column category breakdown
Halaman 11
event highlight

DevCon 3 and DevCon 4 - AI FDE

Konten

At DevCon 3, announced AI FDE. At DevCon 4, Lear and Trinity Industries shared breakthroughs building agentic enterprises with AI FDE

Struktur Tata Letak

Split layout with text and workflow diagram on left, DevCon 4 stage photo on right

Elemen Visual Utama

  • DevCon 4 stage photo
  • Workflow diagram screenshot
  • Play button icon
  • Watch the Video link
Halaman 12
product announcement

New AIP Tools at DevCon 4

Konten

Four new AIP tools: Workflow Builder, Agents & Ontology-MCP, Ontology-Backed App Building, and Provider API Proxy

Struktur Tata Letak

Split layout with headline and four feature descriptions on left, DevCon 4 crowd photo on right

Elemen Visual Utama

  • DevCon 4 audience photo
  • Four feature descriptions with arrows
  • Watch the Videos link
Halaman 13
product feature

Supercharging Data Migration with AIP

Konten

AIP maintains unified context across entire data migration lifecycle. Generates migration plans in 60 seconds, begins Day 1 execution, completes in weeks instead of years

Struktur Tata Letak

Split layout with headline and impact bullets on left, architecture flow diagram on right

Elemen Visual Utama

  • Architecture flow diagram
  • AI FDE/AIP logo in center
  • Purple accent elements
  • Legacy to new system flow
Halaman 14
section divider

Financials Section Divider

Konten

Section divider for the Financials portion of the presentation

Struktur Tata Letak

Dark card with Q4 designation, Palantir logo, 2025 year, and Financials title

Elemen Visual Utama

  • Same design as cover slide
  • Financials section title
  • Navigation dots showing section 4
Halaman 15
metrics dashboard

US Commercial Acceleration in Q4 2025

Konten

Six metric cards: US Commercial Revenue +137% Y/Y and +28% Q/Q, Customer Count +49% Y/Y and +8% Q/Q, RDV +145% Y/Y and +21% Q/Q, Deals 1.7x Y/Y, TCV $1.34B +67% Y/Y

Struktur Tata Letak

Full-width headline with 2x3 grid of metric cards below

Elemen Visual Utama

  • Six rounded metric cards
  • Large percentage typography
  • Gray card backgrounds
  • Descriptive subtitles
Halaman 16
financial chart

GAAP Net Income

Konten

Q4 2025 GAAP EPS of $0.24. Net income line chart from $79M (Q4 2024) to $608.7M (Q4 2025)

Struktur Tata Letak

Split layout with statement on left, line chart on right

Elemen Visual Utama

  • Upward trending line chart
  • Dot markers at each quarter
  • Dark chart background
Halaman 17
financial chart

GAAP Operating Income

Konten

Q4 2025 GAAP operating margin was 41%. Line chart from $11M (Q4 2024) to $575.4M (Q4 2025)

Struktur Tata Letak

Split layout with statement on left, line chart on right

Elemen Visual Utama

  • Steep upward line chart
  • Quarter-by-quarter progression
  • Dark chart background
Halaman 18
financial chart

Rule of 40

Konten

Rule of 40 line chart showing progression from 57% (Q1 2024) to 127% (Q4 2025) across 8 quarters

Struktur Tata Letak

Full-width dark chart card

Elemen Visual Utama

  • Line chart with dot markers
  • Q4 2025 highlighted with dashed circle
  • Steady upward trajectory
Halaman 19
financial chart

US Revenue Growth

Konten

US revenue grew 93% Y/Y and 22% Q/Q driven by US commercial and government acceleration. Bar chart: $558M to $1.076B

Struktur Tata Letak

Split layout with text on left, bar chart on right

Elemen Visual Utama

  • Two-bar comparison chart
  • +93% growth annotation
  • Dashed trend line
Halaman 20
financial chart

US Commercial and Government Revenue Growth

Konten

US Commercial: $214M to $507M (+137%). US Government: $343M to $570M (+66%)

Struktur Tata Letak

Side-by-side dual bar charts

Elemen Visual Utama

  • Two paired bar charts
  • Growth percentage annotations
  • Dashed trend lines
Halaman 21
financial chart

Commercial and Government Revenue Growth (Total)

Konten

Commercial revenue: $372M to $677M (+82%). Government revenue: $455M to $730M (+60%)

Struktur Tata Letak

Side-by-side dual bar charts

Elemen Visual Utama

  • Two paired bar charts
  • Growth percentage annotations
  • Highlighted Q4 2025 bars
Halaman 22
financial chart

Total Revenue Growth

Konten

Total revenue grew +70% Y/Y and +19% Q/Q to $1.407B, driven by continued US business acceleration. Bar chart: $828M to $1.407B

Struktur Tata Letak

Split layout with statement on left, bar chart on right

Elemen Visual Utama

  • Two-bar comparison
  • +70% growth annotation
  • Dashed trend line
Halaman 23
financial chart

Total Revenue Growth excl. Strategic Commercial Contracts

Konten

Revenue excluding strategic commercial contracts grew +72% Y/Y and +19% Q/Q. Bar chart: $818M to $1.405B

Struktur Tata Letak

Split layout with statement on left, bar chart on right

Elemen Visual Utama

  • Two-bar comparison
  • +72% growth annotation
  • Dashed trend line
Halaman 24
financial chart

Adjusted Operating Income

Konten

Q4 2025 adjusted operating income $798M at 57% margin. Quarterly progression from $373M (45%) to $798M (57%) across 5 quarters

Struktur Tata Letak

Split layout with statement on left, multi-bar chart on right

Elemen Visual Utama

  • Five-bar quarterly chart
  • Margin percentages above bars
  • Progressive height increase
Halaman 25
financial chart

US Commercial Customer Count

Konten

US commercial customers grew +49% Y/Y from 382 to 571. Quarterly progression: 382, 432, 485, 530, 571

Struktur Tata Letak

Full-width bar chart with TTM period labels

Elemen Visual Utama

  • Five-bar progression
  • Q/Q growth percentages between bars
  • Y/Y growth annotation
  • TTM period x-axis labels
Halaman 26
financial chart

Customer Count and Commercial Customer Count

Konten

Total customers: 711 to 954 (+34% Y/Y). Commercial customers: 571 to 780 (+37% Y/Y)

Struktur Tata Letak

Side-by-side dual bar charts

Elemen Visual Utama

  • Two five-bar progression charts
  • Q/Q and Y/Y growth annotations
  • TTM period labels
Halaman 27
key metric

Deal Activity - 180 Deals

Konten

Q4 2025: 180 deals of at least $1M, 84 at $5M+, 61 at $10M+. Visual dot matrix representation

Struktur Tata Letak

Large headline number with two dark cards showing dot matrices

Elemen Visual Utama

  • 180 deals in massive typography
  • Dot matrix visualizations
  • Two dark stat cards
  • Underlined dollar thresholds
Halaman 28
financial chart

Cash from Operations and Adjusted Free Cash Flow

Konten

Q4 2025: Cash from ops $777M (55% margin) vs Q4 2024 $460M (56%). Adjusted FCF $791M (56%) vs $517M (63%)

Struktur Tata Letak

Split layout with cash position statement on left, paired bar charts on right

Elemen Visual Utama

  • $7.2B cash headline
  • Paired bar charts
  • Margin percentage labels
  • No debt statement
Halaman 29
forward guidance

Q1 2026 and FY 2026 Guidance

Konten

Q1 2026: Revenue $1.532-$1.536B, Adj. operating income $870-$874M. FY 2026: Revenue $7.182-$7.198B, US commercial >$3.144B (+115%), Adj. operating income $4.126-$4.142B, Adj. FCF $3.925-$4.125B

Struktur Tata Letak

Side-by-side dark cards with bullet point guidance

Elemen Visual Utama

  • Two dark guidance cards
  • Arrow bullet points
  • Revenue range formatting
Halaman 30
section divider

Appendix Section Divider

Konten

Section divider for the Appendix

Struktur Tata Letak

Same design as other section dividers

Elemen Visual Utama

  • Q4 designation
  • Palantir logo
  • 2025 year
  • Appendix title
Halaman 31
data table

Additional Metrics and Notes

Konten

Total RPO: $1.73B to $4.21B. Short-Term RPO: $0.83B to $1.62B. Long-Term RPO: $0.90B to $2.59B. Billings: $779M to $1,489M. Net dollar retention: 139%

Struktur Tata Letak

Two data tables stacked vertically with explanatory note

Elemen Visual Utama

  • Dark-themed data tables
  • Quarterly column headers
  • Billions and millions formatting
Halaman 32
reconciliation table

Revenue Excluding Strategic Commercial Contracts

Konten

Reconciliation table: Q4 2024 $817,935K to Q4 2025 $1,404,709K. FY 2024 $2,813,218K to FY 2025 $4,460,187K

Struktur Tata Letak

Single reconciliation table

Elemen Visual Utama

  • Dark-themed data table
  • Revenue minus strategic contracts calculation
Halaman 33
reconciliation table

Reconciliation of Rule of 40

Konten

Quarterly Rule of 40 from Q1 2024 (57%) to Q4 2025 (127%). Revenue growth 21% to 70%, Adjusted operating margin 36% to 57%. FY 2025: 106%

Struktur Tata Letak

Wide quarterly data table

Elemen Visual Utama

  • Eight-quarter progression
  • Three metric rows
  • FY 2025 column
Halaman 34
reconciliation table

Reconciliation of Cash Flow to Adjusted FCF

Konten

Cash from operations: $460K to $777K (Q4), $1.15B to $2.13B (FY). Adjusted FCF: $517K to $791K (Q4), $1.25B to $2.27B (FY). Margin: 63% to 56% (Q4), 44% to 51% (FY)

Struktur Tata Letak

Reconciliation table with Q4 and FY columns

Elemen Visual Utama

  • Add/Less line items
  • Horizontal divider line
  • Margin percentage row
Halaman 35
reconciliation table

Reconciliation of Gross Profit to Adjusted Gross Profit

Konten

Q4 2025: Gross Profit $1,190,836K + SBC $18,777K = Adjusted Gross Profit $1,209,613K (86% margin). FY 2025: $3,686,269K + $64,555K = $3,750,824K (84%)

Struktur Tata Letak

Compact reconciliation table

Elemen Visual Utama

  • Two-period comparison
  • SBC add-back
  • Adjusted margin row
Halaman 36
reconciliation table

Reconciliation of Operating Income to Adjusted Operating Income

Konten

Quarterly adjusted operating income from $372,522K (Q4 2024, 45%) to $798,465K (Q4 2025, 57%). FY: $1,128,062K (39%) to $2,254,100K (50%)

Struktur Tata Letak

Wide quarterly reconciliation table

Elemen Visual Utama

  • Six-period columns
  • SBC and payroll tax add-backs
  • Adjusted margin row
Halaman 37
reconciliation table

Reconciliation of GAAP EPS to Adjusted EPS

Konten

Q4 2025: Net income $608,676K, adjusted net income $647,973K, adjusted EPS $0.25 diluted. FY 2025: Net income $1,625,033K, adjusted $1,915,638K, adjusted EPS $0.75

Struktur Tata Letak

Reconciliation table with per-share calculation

Elemen Visual Utama

  • Add/Less adjustments
  • Weighted-average shares row
  • Per-share amounts
  • Tax rate footnote
Halaman 38
reconciliation table

Reconciliation of Revenue to Billings

Konten

Quarterly billings from $778,883K (Q4 2024) to $1,488,702K (Q4 2025). Revenue + Change in Contract Liabilities = Billings

Struktur Tata Letak

Quarterly reconciliation table

Elemen Visual Utama

  • Five-quarter columns
  • Simple two-line reconciliation
  • Contract liabilities adjustment
Halaman 39
reconciliation table

Reconciliation of Expenses to Adjusted Expenses

Konten

Q4 2025: Total expenses $831,408K less SBC $196,405K and payroll taxes $26,666K = Adjusted expenses $608,337K. FY: $3,061,431K to $2,221,346K

Struktur Tata Letak

Reconciliation table with multi-period comparison

Elemen Visual Utama

  • Four-period columns
  • SBC and payroll tax deductions
  • Horizontal divider

Pertanyaan yang Sering Diajukan

Pertanyaan umum tentang slide ini dan konten presentasi yang mendasarinya.

What are the key financial highlights from Palantir's Q4 2025 earnings?

Palantir reported Q4 2025 total revenue of $1.407B (+70% Y/Y), US revenue of $1.076B (+93% Y/Y), adjusted operating income of $798M (57% margin), adjusted free cash flow of $791M (56% margin), and a Rule of 40 score of 127%. The company also closed 180 deals of at least $1M.

How many slides are in this Palantir investor presentation?

The presentation contains 39 slides organized into four sections: a cover and disclaimer, Business Update (partnerships, products, and initiatives), Financials (revenue, profitability, customer, and cash flow charts), and an Appendix with detailed reconciliation tables.

What design style does this Palantir presentation use?

The presentation features a sophisticated dark-theme design with charcoal/black chart cards on light gray backgrounds, minimalist white typography, clean bar and line charts with growth annotations, and consistent use of Palantir branding. The style is professional, data-dense, and optimized for investor communications.

What is Palantir's FY 2026 revenue guidance?

For FY 2026, Palantir expects revenue of $7.182-$7.198 billion, US commercial revenue exceeding $3.144 billion (115%+ growth), adjusted operating income of $4.126-$4.142 billion, and adjusted free cash flow of $3.925-$4.125 billion.

What new products and partnerships did Palantir announce in Q4 2025?

Key announcements include ShipOS with the U.S. Navy for maritime operations, the American Tech Fellowship for Veterans (ATF-V), a partnership with Accenture to scale enterprise AI with 2,000+ professionals, expanded partnership with HD Hyundai, Chain Reaction for AI infrastructure, and new AIP tools launched at DevCon 4.

How does Palantir's Rule of 40 compare to other enterprise software companies?

At 127%, Palantir's Rule of 40 score dramatically exceeds all peers in the enterprise software industry. The scatter chart on page 3 shows the nearest competitors (PTC at 99%, FICO at 71%) trailing significantly, with most peers clustering between 25-55%.

Can I use this presentation as a template for my own earnings report?

This presentation serves as excellent design inspiration for quarterly earnings reports. Its dark-themed chart style, split-layout structure, consistent typography, and data visualization patterns can guide your own investor presentation design while maintaining professional standards.

What financial reconciliations are included in the appendix?

The appendix includes reconciliations for: Revenue to Revenue Excluding Strategic Commercial Contracts, Rule of 40 calculation, Cash Flow to Adjusted Free Cash Flow, Gross Profit to Adjusted Gross Profit, Operating Income to Adjusted Operating Income, GAAP EPS to Adjusted EPS, Revenue to Billings, and Expenses to Adjusted Expenses.

2slides

Create Your Own Slides

Turn your ideas into professional presentations in seconds with 2slides AI.

Buat Slide Kelas Dunia dalam Hitungan Detik

Referensikan desain profesional, pilih gaya Anda, dan hasilkan slide dengan rendering teks sempurna. Didukung oleh Nano Banana—mulai buat presentasi Anda sekarang.

© 2026 2slides. All rights reserved.


