
Bagian dari Contoh presentasi investor · Contoh presentasi investor Jepang
Nomura Holdings H1 FY2026 Earnings Presentation (fiscal year ending March 2027, US GAAP, October 2026) — a 38-page Japanese-language results deck published on TDnet, the Tokyo Stock Exchange's timely disclosure system. It covers the second quarter (July–September 2026) and the first half (April–September 2026): net revenue of ¥1,294.2 billion for the half (+25% year on year), income before income taxes of ¥359.5 billion (+21%), net income attributable to shareholders of ¥249.3 billion (+27%), diluted EPS of ¥82.97, annualized ROE of 13.3% and an interim dividend of ¥35 per share, followed by Wealth Management, Investment Management, Wholesale and Banking segment pages, capital and liquidity ratios, and a 15-page financial supplement.
Menggunakan sampul presentasi ini sebagai referensi gaya untuk slide yang dibuat dari konten Anda sendiri. Atau pilih halaman mana pun di bawah untuk memakai tata letaknya sebagai referensi.
Navigasi Cepat
Tag
Bagikan slide
Nomura Holdings H1 FY2026 Earnings Presentation (fiscal year ending March 2027, US GAAP, October 2026) — a 38-page Japanese-language results deck published on TDnet, the Tokyo Stock Exchange's timely disclosure system. It covers the second quarter (July–September 2026) and the first half (April–September 2026): net revenue of ¥1,294.2 billion for the half (+25% year on year), income before income taxes of ¥359.5 billion (+21%), net income attributable to shareholders of ¥249.3 billion (+27%), diluted EPS of ¥82.97, annualized ROE of 13.3% and an interim dividend of ¥35 per share, followed by Wealth Management, Investment Management, Wholesale and Banking segment pages, capital and liquidity ratios, and a 15-page financial supplement.
Tampilan detail setiap halaman slide, termasuk tata letak, konten utama dan elemen visual.
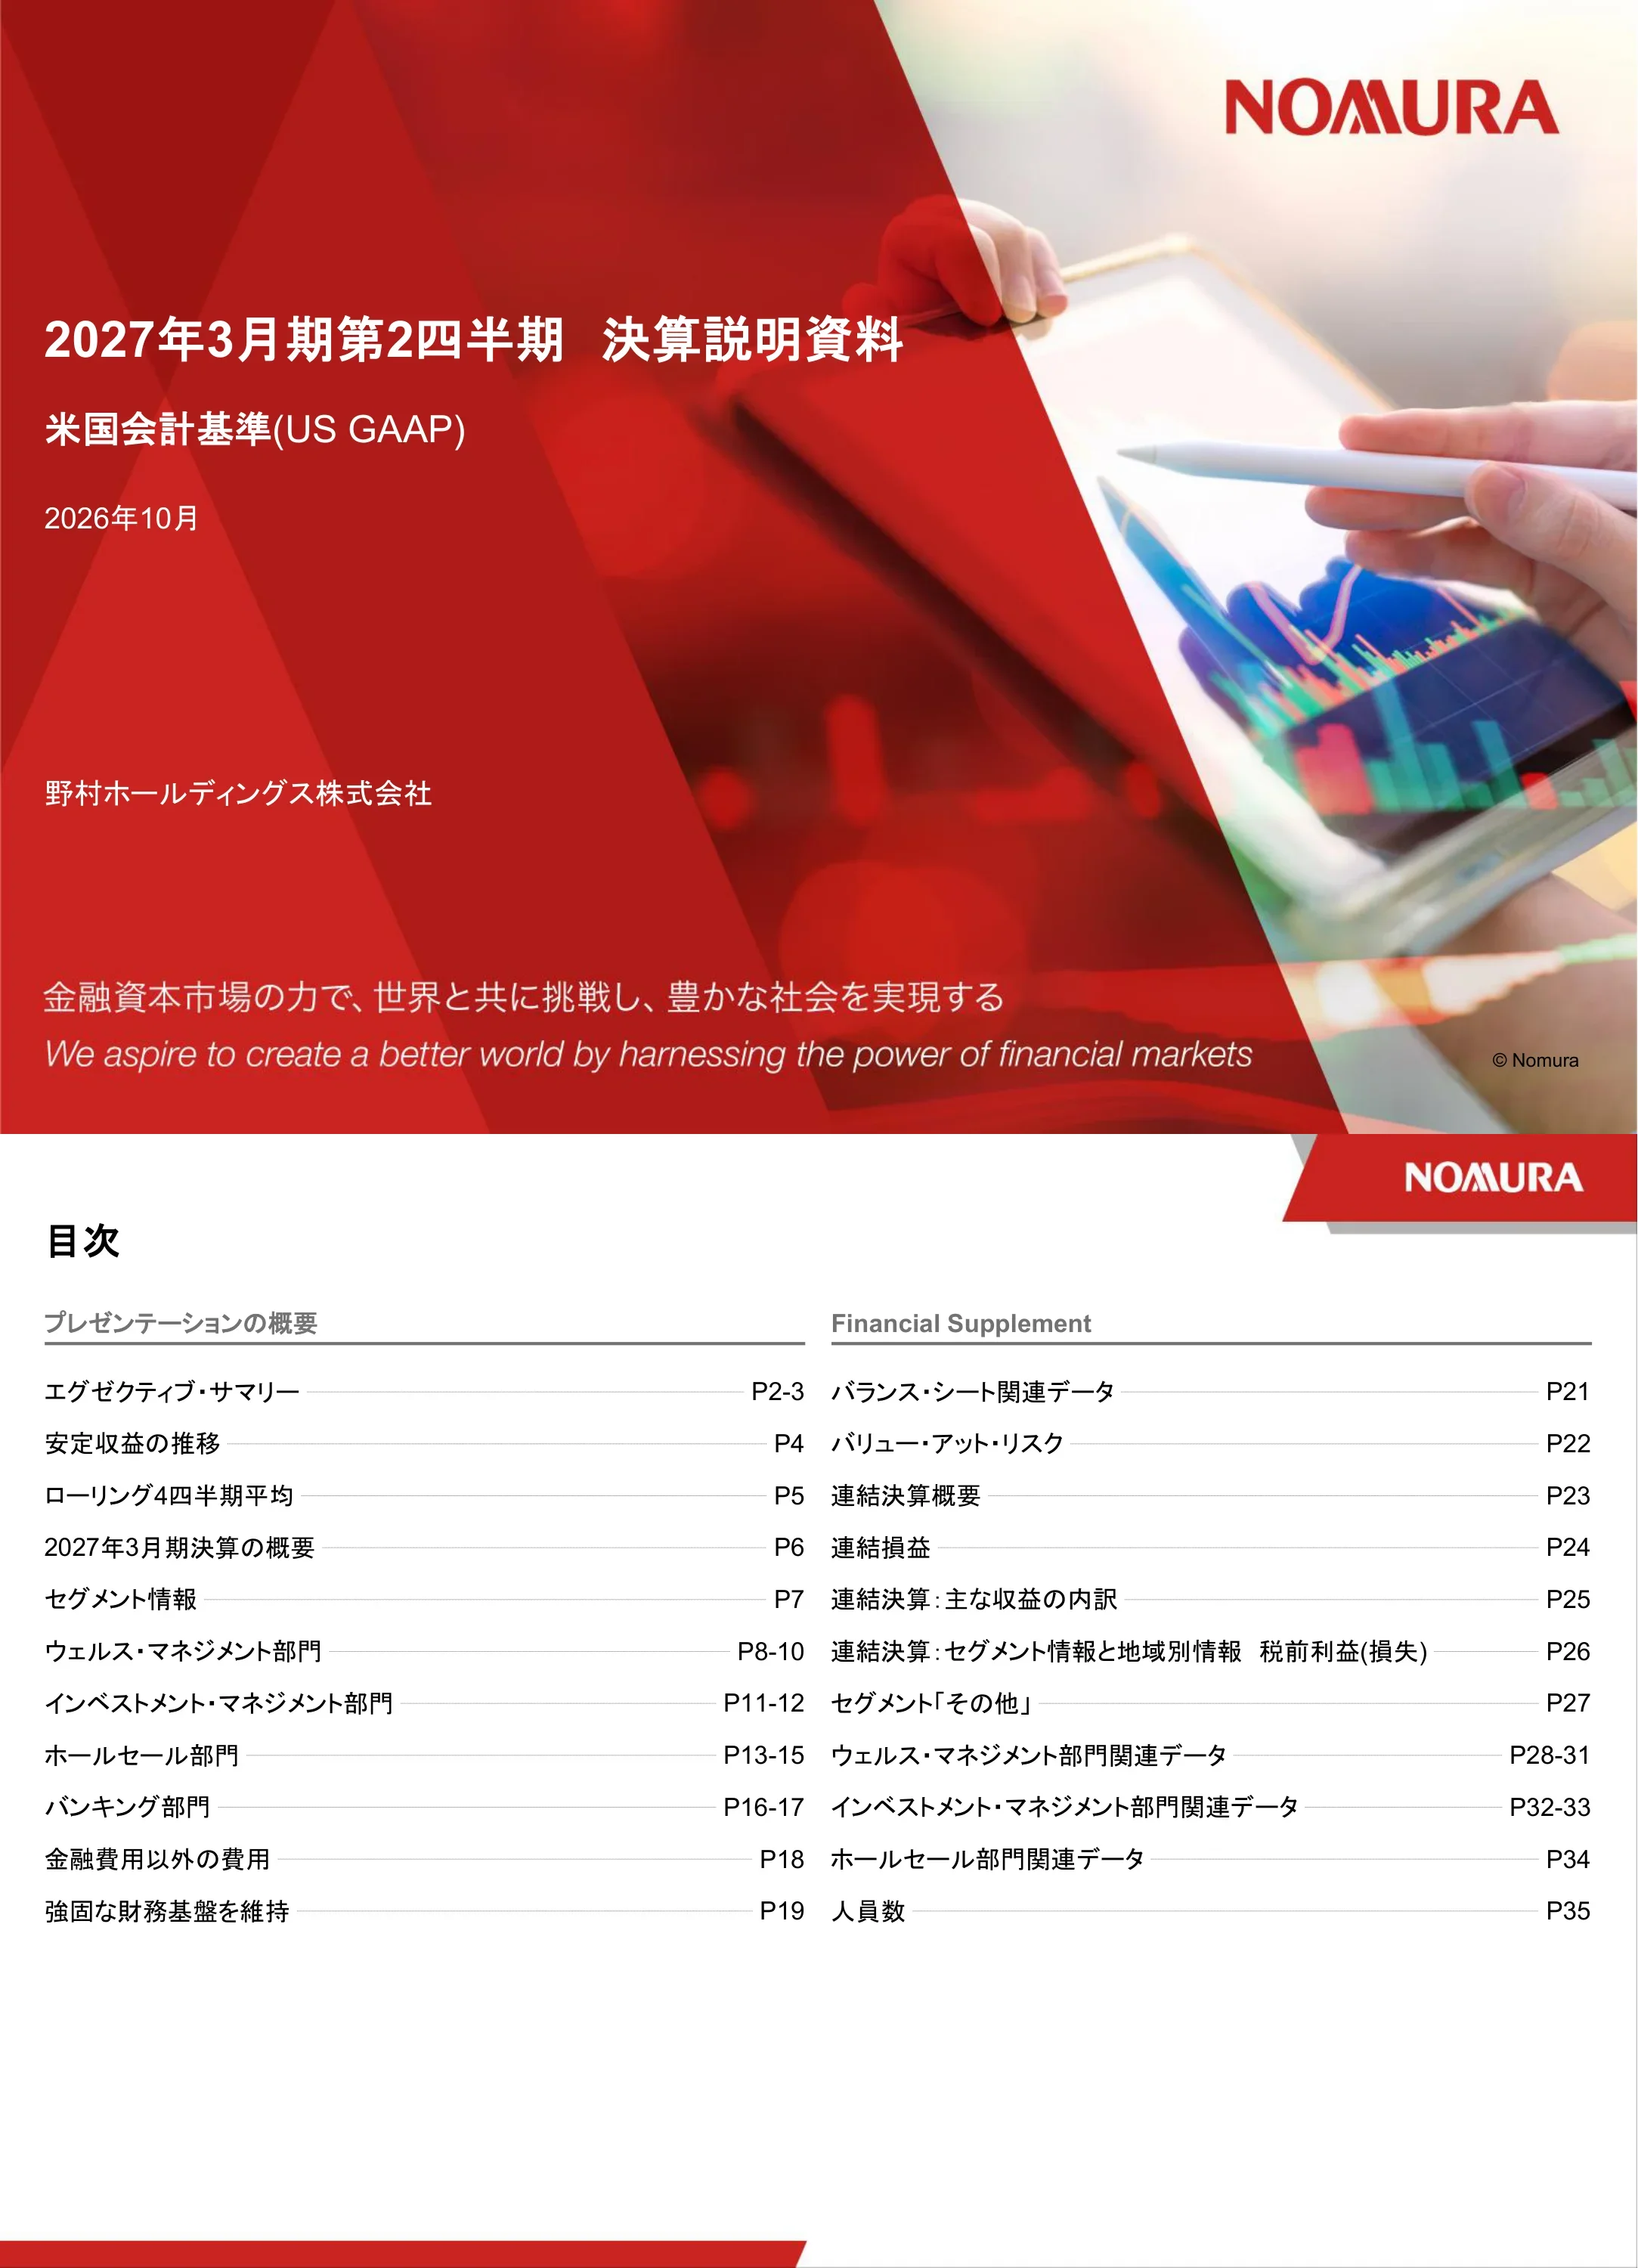
Title slide for Nomura Holdings' 2Q results presentation for the fiscal year ending March 2027 (FY2026), prepared under US GAAP and dated October 2026, with the corporate tagline 'We aspire to create a better world by harnessing the power of financial markets'.
Full-bleed red diagonal overlay on a photo of a hand using a tablet with market charts; NOMURA logo top right, white title text on the left, bilingual tagline at the bottom.
Two-column table of contents: the presentation overview (executive summary p2–3, stable revenue p4, rolling four-quarter averages p5, results overview p6, segment information p7, Wealth Management p8–10, Investment Management p11–12, Wholesale p13–15, Banking p16–17, non-interest expenses p18, robust financial position p19) and the Financial Supplement (balance sheet, VaR, consolidated results, P&L, revenue breakdown, segment and regional information, 'Other', segment data and headcount, p21–35).
Two-column list with grey section headings and right-aligned page references separated by thin rules; red corner logo tab.
First-half ROE was 13.3%, on track for the 2030 management vision: net revenue ¥1,294.2 billion (12,942億円, +25% YoY), income before income taxes ¥359.5 billion (+21%), net income attributable to shareholders ¥249.3 billion (+27%), diluted EPS ¥82.97 (+29%), ROE 13.3% versus 11.3%; interim dividend ¥35 per share. All divisions grew: income before income taxes rose 62% in Wealth Management (¥136.7bn), 39% in Investment Management (¥72.4bn), 47% in Wholesale (¥139.4bn) and 18% in Banking (¥8.0bn), four-segment total +50%; stable revenue grew about 1.6x. The prior-year 'Other' figure included a gain of about ¥56 billion (約560億円) on the sale of owned real estate.
Red-outlined highlight box with three bullet points at top; KPI comparison table (H1 last year vs H1 this year vs YoY) bottom left with an ROE line chart (5.1%, 10.0%, 10.1%, 13.3% for FY ending March 2024, 2025, 2026 and H1); stacked bar bridge of income before income taxes by segment on the right; dividend callout top right.
2Q net revenue was ¥607.5 billion (-12% QoQ), income before income taxes ¥148.0 billion (-30%), net income attributable to shareholders ¥103.7 billion (-29%), diluted EPS ¥34.61 and annualized ROE 10.9%, meeting the 2030 vision's new 10–12%+ target for a second straight quarter. Four-segment income before income taxes was ¥143.4 billion (-33%). Wealth Management posted record recurring-asset net inflows of about ¥750 billion and a 79% recurring revenue cost coverage ratio; Investment Management kept high AuM with inflows into new and balanced funds; Wholesale fell from a record 1Q but equities stayed strong and Investment Banking grew; Banking benefited from loans, trust/agent business and the deposit sweep service.
Left two-thirds: red headline and bulleted segment commentary; right column: bar-and-line chart of income before income taxes and net income over five quarters (136.6, 135.2, 107.7, 211.5, 148.0 / 92.1, 91.6, 73.9, 145.6, 103.7) and a stacked bar of four-segment income before income taxes (132.6, 142.9, 125.6, 213.0, 143.4).
Wealth Management recurring assets reached ¥31.3 trillion and Investment Management AuM ¥152.8 trillion at end-September 2026. Stable revenue (WM recurring revenue + IM business revenue + Banking revenue) was ¥326.1 billion for the first half versus ¥206.1 billion a year earlier (¥160.6bn in 1Q, ¥165.4bn in 2Q); full-year figures rose from ¥251.6 billion (FY ending March 2022) to ¥482.8 billion (FY ending March 2026). Banking revenue was split out from WM from 1Q of the year ending March 2026, with restatements back to the year ending March 2024.
Left: two small bar charts (WM recurring assets in ¥ trillion; IM AuM in ¥ trillion) with the latest bar boxed in red; centre arrow; right: large stacked bar chart of stable revenue by component across fiscal years and half-years with a quarterly callout box.
Four-quarter rolling averages rose steadily: Wealth Management revenue average reached ¥138.1 billion with income before income taxes averaging ¥64.1 billion; Investment Management ¥82.6 billion revenue average and ¥27.1 billion income before income taxes; Wholesale ¥325.0 billion revenue average (Global Markets ¥270.5bn, Investment Banking ¥54.5bn) and ¥61.2 billion income before income taxes; Banking ¥15.0 billion revenue and ¥3.8 billion income before income taxes.
Four-quadrant grid, one per division, each a stacked bar chart over five quarters (2Q of FY ending March 2026 to 2Q of FY ending March 2027) with an overlaid navy line for average income before income taxes and data labels.
Five-quarter and half-year table (¥ billion): 2Q net revenue ¥607.5bn (-12% QoQ, +18% YoY), non-interest expenses ¥459.5bn, income before income taxes ¥148.0bn (-30% QoQ, +8% YoY), net income ¥103.7bn, effective tax rate 28.1%, EPS ¥34.61, BPS ¥1,291.77, ROE 10.9%. First half: net revenue ¥1,294.2bn (+25%), expenses ¥934.7bn (+26%), income before income taxes ¥359.5bn, net income ¥249.3bn, tax rate 27.0%, EPS ¥82.97, ROE 13.3%. Overseas income before income taxes was ¥26.4bn in 2Q and ¥101.6bn for the half (+40%).
Full-width financial table with grey header rows for fiscal periods, the current 2Q and H1 columns boxed in red, QoQ/YoY change columns, a 'Reference' row for overseas income, and numbered footnotes.
Net revenue and income before income taxes by segment. 2Q net revenue: Wealth Management ¥141.5bn, Investment Management ¥84.8bn, Wholesale ¥308.9bn, Banking ¥16.4bn, four-segment total ¥551.6bn; first half four-segment revenue ¥1,179.7bn (+31%). 2Q income before income taxes: WM ¥65.6bn, IM ¥27.4bn, Wholesale ¥46.1bn, Banking ¥4.4bn, total ¥143.4bn; first half ¥356.4bn (+50%). 'Other' posted a ¥1.2bn loss in 2Q, including a ¥1.9bn loss related to economic hedging and a ¥1.1bn loss from changes in own and counterparty credit spreads on derivatives.
Large two-block table (revenue block, income block) with pink-shaded four-segment total rows, current 2Q and H1 columns boxed, and a short note beneath on 'Other'.
2Q net revenue ¥141.5 billion (1,415億円, -3% QoQ, +22% YoY) and income before income taxes ¥65.6 billion (-8% QoQ, +44% YoY). Recurring revenue hit a record ¥66.7bn (+13% QoQ) while flow revenue fell 13% to ¥74.8bn; expenses rose slightly due to temporary real-estate costs. Recurring revenue cost coverage reached 79%. Recurring-asset net inflows were a record ¥755.4 billion; investment trust net inflows ¥383.7bn, discretionary investment net inflows ¥226.9bn and net cash and securities inflows ¥803.2bn versus an outflow of ¥8.56 trillion in 1Q.
Left: summary P&L table and stacked bar chart of recurring vs flow revenue with a data table beneath; right: boxed headline figures, 'Key points' bullets on recurring and flow revenue, and an asset-growth table comparing 1Q and 2Q.
Total sales were ¥7,385.9 billion (7兆3,859億円) in 2Q, down 13% QoQ but high. Stocks ¥5,048.4bn (-21%, with primary equity offerings of ¥132.6bn, -41%), bonds ¥851.5bn (+66% as rising yen rates boosted bond buying), investment trusts ¥998.6bn (-14%, with inflows into Japanese equity and balanced funds), discretionary investments ¥337.9bn (+9%, record SMA contracts) and insurance ¥149.6bn (+14%).
Left: stacked bar chart of total sales by product over five quarters with a data table below; right: headline and product-by-product bullet commentary.
Four KPI charts: recurring-asset net inflows reached a record ¥755.4bn (¥801.3bn excluding the corporate section); recurring assets of ¥31.3 trillion at end-September with recurring revenue at a record ¥66.7bn; flow-business clients of about 1,288 thousand at end-September, above the prior-year level; workplace assets ¥10.4 trillion, steadily rising on employee stock ownership inflows.
2x2 grid of charts, each with a grey sub-heading and a one-line red bullet: clustered bars, bar + line dual axis, year-over-year line comparison and simple bar chart.
2Q net revenue ¥84.8 billion (848億円, -14% QoQ, +39% YoY) and income before income taxes ¥27.4 billion (-39% QoQ, -11% YoY). Business revenue was ¥82.3bn (-4% QoQ, +87% YoY), including the Macquarie public asset management business acquired from December 2025; a new Japanese equity active fund launched in July passed ¥150 billion AuM and the flagship balanced fund neared ¥2 trillion. Investment gain/loss fell to ¥2.5bn (-80% QoQ) on lower American Century Investments-related gains; integration costs rose at Nomura Asset Management International.
Left: P&L table and stacked bar chart of business revenue vs investment gain/loss with data table; right: boxed headline figures and key-point bullets by revenue line.
Net AuM was ¥152.8 trillion at end-September (investment trust business ¥93.8tn, investment advisory and international ¥59.0tn). Net inflows were ¥478 billion in 2Q: ¥1,019bn into the investment trust business (Japanese equity active, balanced and private equity funds, and ETFs) offset by ¥541bn outflows from advisory/international, where US mutual fund outflows narrowed. Alternative AuM hit a record ¥3,891 billion.
Top left: stacked bar chart of AuM; bottom left: positive/negative stacked bars of net flows; bottom right: bar chart of alternative AuM; top right: text commentary by business.
2Q net revenue ¥308.9 billion (3,089億円, -16% QoQ, +11% YoY) and income before income taxes ¥46.1 billion (-51% QoQ, -13% YoY) as revenue normalised from a strong 1Q amid inflation and rate uncertainty. Global Markets ¥254.2bn (-20%), Investment Banking ¥54.7bn (+9%). Expense ratio 85%; revenue/modified RWA 7.7%. Revenue by region: Americas ¥105.8bn, Europe ¥48.4bn, Asia ¥68.3bn, Japan ¥86.4bn.
Top: P&L table with expense ratio and revenue/RWA rows plus key-point box on the right; bottom: two stacked bar charts (by business line and by region) with data tables.
Global Markets net revenue ¥254.2 billion (2,542億円, -20% QoQ, +8% YoY). Fixed Income ¥119.2bn (-14% QoQ, -2% YoY): macro products fell as global rates rose, while securitized products led by the Americas grew and the international wealth business stayed strong. Equities ¥135.0bn (-25% QoQ, +19% YoY): financing businesses were solid but derivatives normalised after a strong 1Q, and execution revenue fell with lower market turnover.
Left: six-colour stacked bar chart of FI and EQ sub-products over five quarters with a table below; right: headline box and bullet commentary for Fixed Income and Equities.
Investment Banking net revenue ¥54.7 billion (547億円, +9% QoQ, +26% YoY); Nomura ranked first in the Japan ECM and DCM league tables for April–September 2026 (ECM ¥788.3bn, 30.5% share; DCM ¥2,608.6bn, 22.6% share). Advisory grew in Japan and overseas; ECM acted as bookrunner on 9 of the top 10 domestic deals in the half. Representative deals include the take-private of Dentsu Soken by Dentsu Group and Itochu (¥215.2bn), Nippon Yusen's acquisition of NS United Kaiun (¥165.4bn), SoftBank Group retail bonds (¥1 trillion) and an IBRD US$4.0bn sustainable development bond.
Left: stacked bar chart (advisory vs financing and solutions) with data row and key-point bullets; right: representative deal list split into Advisory and Financing/Solutions bands, plus ECM and DCM league table excerpts.
2Q net revenue ¥16.4 billion (164億円, +7% QoQ, +27% YoY) and income before income taxes ¥4.4 billion (+20% QoQ, +37% YoY). Banking revenue ¥4.5bn (+11%) rose with deposit sweep growth and higher market rates; trust and agent revenue ¥11.9bn (+6%) grew at Nomura Trust and Banking and Nomura Bank Luxembourg. Deposits at Nomura Trust and Banking rose ¥173.5bn in the quarter to ¥1,837.7 billion (1兆8,377億円).
Left: P&L table and yellow stacked bar chart (trust/agent vs banking revenue) with data table; right: headline box, key-point bullets and a small deposit balance table.
Loans at Nomura Trust and Banking grew to ¥1,361 billion at end-September (from ¥1,093bn a year earlier), helped by Nomura Web Loan and the Nomura app; investment trusts held in trust reached ¥44.2 trillion; assets under administration at Nomura Bank Luxembourg rose to US$73.7 billion (Nomura group US$41.3bn, outside group US$32.4bn).
Three gold bar charts (loans, trust assets, Luxembourg AUA stacked by source) with a KPI highlights text panel on the right.
2Q non-interest expenses were ¥459.5 billion (4,595億円, -3% QoQ): compensation ¥224.0bn (-5%) on bonus accrual adjustments and lower deferred compensation, commissions and floor brokerage ¥70.3bn (-5%) on lower volumes, IT and communications ¥70.2bn, occupancy ¥19.7bn (+5%) on office relocations. Full-year expenses were ¥1,420.5bn (FY ending March 2025) and ¥1,627.9bn (FY ending March 2026).
Two stacked bar charts (full year and quarterly) by cost category with a detailed table beneath; key-point bullets in a right column.
At end-September 2026 (Basel III, some figures preliminary): total assets ¥67.5 trillion, shareholders' equity ¥3.8 trillion, gross leverage 17.9x, adjusted leverage 13.2x, Level 3 assets ¥1.3 trillion, liquidity portfolio ¥12.7 trillion. Tier 1 capital ¥3,701bn, total capital ¥3,937bn, risk-weighted assets ¥25,499bn; CET1 ratio 12.6%, Tier 1 ratio 14.5%, total capital ratio 15.4%, leverage ratio 4.68%, HQLA ¥9.2 trillion, LCR 182.4%, TLAC 27.7% of RWA and 10.0% of total exposure. RWA rose from ¥25.0 trillion to ¥25.5 trillion in the quarter.
Left: two stacked tables of balance-sheet indicators and regulatory ratios across three quarter-ends; right: bar + line chart of RWA and CET1 ratio, and a waterfall of RWA change by risk type.
Section divider introducing the Financial Supplement appendix that follows on pages 22–36.
Full-bleed faded photo of a tablet with charts, grey diagonal shapes, red 'Financial Supplement' title on the left and NOMURA logo top right.
Consolidated balance sheet (¥ billion): total assets rose ¥4,836bn to ¥67,482bn between end-March and end-September 2026 — cash and deposits ¥6,667bn, loans and receivables ¥11,002bn, collateralized agreements ¥17,657bn, trading assets and private equity/debt investments ¥28,217bn. Liabilities ¥63,556bn including collateralized financing ¥19,549bn, trading liabilities ¥14,946bn and long-term borrowings ¥15,633bn; total Nomura shareholders' equity ¥3,775bn.
Side-by-side assets and liabilities/equity tables with end-March, end-September (boxed in red) and change columns.
VaR assumptions: 95% confidence level, one-day holding period, considering price movements across products. For April 1 to September 30, 2026, VaR peaked at ¥7.8 billion, bottomed at ¥5.5 billion and averaged ¥6.4 billion. At end-September consolidated VaR was ¥6.4bn: equity ¥4.7bn, interest rate ¥2.7bn, foreign exchange ¥1.7bn, less a diversification benefit of ¥2.7bn.
Two bullet blocks (assumptions and actuals) at top; period-end VaR table by risk type across seven quarter- and year-ends below.
Annual and quarterly summary (¥ billion): net revenue ¥1,892.5bn and ¥2,167.7bn for the fiscal years ending March 2025 and 2026; quarterly net revenue ¥515.5bn to ¥607.5bn. Net income attributable to shareholders ¥340.7bn and ¥362.1bn annually (ROE 10.0% and 10.1%) and ¥103.7bn in 2Q. Shareholders' equity ¥3,775.3bn; quarterly ROE (cumulative, annualized) 13.3% for the half; basic EPS ¥35.49 and diluted EPS ¥34.61 in 2Q; BPS ¥1,291.77.
Two bar + line charts (annual and quarterly net income with ROE) above two matching data tables.
Revenue line items (¥ billion) for two fiscal years and five quarters. 2Q: commissions ¥125.6bn, investment banking fees ¥57.2bn, asset management fees ¥171.6bn, net gain on trading ¥204.6bn, private equity and debt investments ¥5.4bn, interest and dividends ¥732.4bn, investment securities ¥6.2bn, other ¥20.0bn; total revenue ¥1,322.8bn less interest expense ¥715.4bn gives net revenue ¥607.5bn; non-interest expenses ¥459.5bn; income before income taxes ¥148.0bn; net income ¥103.7bn.
Full-width income statement table with annual columns on the left and quarterly columns on the right; current 2Q column boxed in red.
Breakdown of fee revenue (¥ billion). 2Q commissions ¥125.6bn (stock brokerage ¥81.3bn, other brokerage ¥5.8bn, investment trust distribution ¥18.1bn, other ¥20.3bn). Investment banking fees ¥57.2bn (equity ¥11.6bn, bonds ¥17.0bn, M&A and financial advisory ¥20.8bn, other ¥7.7bn). Asset management fees ¥171.6bn (asset management ¥121.4bn, asset-based fees ¥38.9bn, custodial fees ¥11.3bn).
Three grouped table blocks (commissions, investment banking fees, asset management fees) with annual and quarterly columns.
Reconciliation of segment and consolidated income before income taxes: four-segment total ¥143.4bn in 2Q, 'Other' -¥1.2bn, unrealized gain on investments held for operating purposes ¥5.8bn, consolidated ¥148.0bn. Regional income before income taxes (US GAAP geographic basis, 2Q preliminary): Americas ¥9.5bn, Europe -¥7.4bn, Asia and Oceania ¥24.3bn, overseas total ¥26.4bn, Japan ¥121.6bn.
Two stacked tables: segment reconciliation on top, regional breakdown below, each with annual and quarterly columns and footnotes.
Income (loss) before income taxes of the 'Other' segment: ¥35.1bn and ¥24.6bn for the fiscal years ending March 2025 and 2026, then ¥2.3bn, -¥10.3bn, -¥22.0bn, -¥7.0bn and -¥1.2bn over the five quarters. 2Q components: economic hedging -¥1.9bn, realized gain on investments held for operating purposes ¥0.0bn, equity in earnings of affiliates ¥11.4bn, corporate items -¥4.0bn, other -¥6.7bn.
Bar chart with positive and negative red bars above a component table.
Detailed WM revenue (¥ billion): 2Q commissions ¥55.4bn (stock brokerage ¥22.2bn, investment trust distribution ¥18.0bn), sales credit ¥16.5bn, investment banking fees ¥6.8bn, investment trust administration fees ¥55.8bn, net interest revenue ¥7.0bn; net revenue ¥141.5bn, expenses ¥75.9bn, income before income taxes ¥65.6bn. Domestic investment trust sales ¥1,377.9bn (stock funds ¥874.0bn, foreign funds ¥503.8bn) and retail JGB sales ¥179.9bn (5.4x YoY).
Single dense table with annual, quarterly, QoQ and YoY columns, grouped into revenue lines, P&L totals and sales volumes.
WM client assets were ¥183.6 trillion at end-September 2026 (¥183.7tn at end-June, ¥143.8tn at end-March 2025): equities ¥121.6tn, foreign currency bonds ¥6.6tn, domestic bonds ¥15.5tn, stock investment trusts ¥18.7tn, bond investment trusts ¥6.1tn, foreign investment trusts ¥3.3tn, other ¥11.7tn.
Stacked bar chart of client assets by asset class across year-ends and quarter-ends above a matching data table.
Net inflows of cash and securities (excluding regional financial institutions), ¥ billion: WM total ¥803bn in 2Q after an ¥8,558bn outflow in 1Q; retail only ¥773bn; retail cash deposits ¥2,466bn. Full-year figures were ¥1,288bn and ¥5,263bn (WM total) for the fiscal years ending March 2025 and 2026.
Two clustered bar charts (annual and quarterly, with a broken axis for the large 1Q outflow) above a three-row data table.
Account metrics (thousand accounts) at end-September 2026: accounts with balance 6,172, equity holding accounts 3,356, NISA accounts 1,933, online service accounts 6,521. New individual accounts were 84 thousand in 2Q; online (IT) share of cash stock trades was 85% by number and 58% by value.
Two tables: account balances across period-ends, and new accounts with IT ratios across quarters.
IM P&L (¥ billion): 2Q business revenue ¥82.3bn (+86.9% YoY), investment gain/loss ¥2.5bn, net revenue ¥84.8bn, expenses ¥57.4bn (+90.7% YoY), income before income taxes ¥27.4bn. AuM by company at end-September: Nomura Asset Management ¥127.4 trillion, Nomura Asset Management International and others ¥34.1tn, gross ¥161.5tn, net ¥152.8tn. Footnotes explain the December 2025 completion of the Macquarie public asset management acquisition and the creation of Nomura Asset Management International.
Two tables (segment P&L with QoQ/YoY; AuM by company across period-ends) with long footnotes at the bottom.
Net flows by business (¥ billion): domestic investment trust business +¥1,019bn in 2Q (of which ETFs +¥786bn), domestic advisory and international -¥541bn, total +¥478bn. Japanese public investment trust market ¥361.2 trillion at end-September with Nomura Asset Management's share at 24%; stock investment trusts ¥345.3tn (23% share), bond investment trusts ¥15.9tn (40%), ETFs ¥136.2tn (44%), per Japan Investment Trusts Association data.
Two tables: flows by business across years and quarters; market size and Nomura Asset Management share by fund type across period-ends.
Wholesale P&L (¥ billion): 2Q net revenue ¥308.9bn (-16.3% QoQ, +10.7% YoY), expenses ¥262.9bn, income before income taxes ¥46.1bn (-50.6% QoQ). Revenue breakdown: Fixed Income ¥119.2bn, Equities ¥135.0bn, Global Markets ¥254.2bn, Investment Banking ¥54.7bn. Annual net revenue was ¥1,057.9bn and ¥1,162.2bn for the fiscal years ending March 2025 and 2026.
Two tables (segment P&L and revenue breakdown) with annual, quarterly, QoQ and YoY columns.
Employees by region at end-September 2026: Japan 15,242, Europe 3,261, Americas 3,070, Asia and Oceania (including the Powai office in India) 7,740, total 29,313 — up from 28,677 at end-March 2026 and 27,242 at end-March 2025.
Single clean table of headcount by region across year-ends and quarter-ends, latest column boxed in red.
Legal disclaimer: the document provides information on 2Q of the fiscal year ending March 2027 under US GAAP, is not a solicitation to buy or sell securities, may contain forward-looking statements subject to risks and uncertainties (referring readers to the company website, EDINET and SEC filings including Form 20-F), and the consolidated financial information is unaudited.
Text-only slide with several paragraphs of small Japanese body text under a 'Disclaimer' heading.
Closing slide with 'Nomura Holdings, Inc.' and the website www.nomura.com/jp/ in a centred outlined box.
Mostly white slide with a centred bordered text box, red logo tab at top right and red footer bar.
Pertanyaan umum tentang slide ini dan konten presentasi yang mendasarinya.
It is Nomura's results deck for the second quarter (July–September 2026) and the first half (April–September 2026) of the fiscal year ending March 2027, referred to here as FY2026. It includes an executive summary, group results, pages for the Wealth Management, Investment Management, Wholesale and Banking divisions, non-interest expenses, capital and liquidity ratios, and a Financial Supplement with the balance sheet, VaR, the consolidated P&L, regional results and headcount.
The original slides are in Japanese. Nomura published them on TDnet, the Tokyo Stock Exchange's timely disclosure system, as its 2Q earnings presentation (決算説明資料) for the fiscal year ending March 2027. The page-by-page summary on this page is written in English, and amounts are kept in yen and in the units the slides use: ¥ billion (10億円), ¥100 million (億円) and ¥ trillion (兆円).
For April–September 2026, net revenue was ¥1,294.2 billion (+25% year on year), income before income taxes was ¥359.5 billion (+21%) and net income attributable to shareholders was ¥249.3 billion (+27%). Diluted EPS was ¥82.97 and annualized ROE was 13.3%. The interim dividend is ¥35 per share.
2Q net revenue was ¥607.5 billion, down 12% from a record 1Q. Income before income taxes was ¥148.0 billion (down 30%) and net income was ¥103.7 billion (down 29%). ROE was 10.9%, the second quarter in a row within Nomura's 2030 target range of 10–12%+. Against 2Q a year earlier, revenue was up 18% and income before income taxes was up 8%.
Page 8 has revenue and income before income taxes for every segment over five quarters and both half-years. Pages 9–18 cover each division in detail, and page 6 shows rolling four-quarter averages. In the Financial Supplement, pages 29–35 hold the detailed segment data tables, including client assets, net inflows, account numbers, AuM by company and fund market share.
Page 20 shows that at end-September 2026 the CET1 ratio was 12.6%, the Tier 1 ratio 14.5%, the total capital ratio 15.4% and the leverage ratio 4.68%. LCR was 182.4% and TLAC was 27.7% of risk-weighted assets. Total assets were ¥67.5 trillion and risk-weighted assets ¥25.5 trillion. The deck notes that some of the September figures are preliminary.
It works well as a structural reference for a diversified financial group's quarterly results. It follows a common pattern: an executive summary with a KPI table, a segment overview table, one or two pages per division with a 'key points' panel, a cost page, a capital page and a data-heavy appendix. The PDF is free to download for reference. Nomura's branding and data belong to Nomura Holdings.
Nomura's fiscal year runs from April to March, and the slides label it '2027年3月期' (the year ending March 2027). This gallery calls that year FY2026 after the calendar year in which it starts, which matches earlier Japanese entries such as the Daiwa Securities decks. 2Q means July–September 2026, and the first half means April–September 2026.
Original Japanese-language earnings presentation; TDnet links are typically available for a limited period after disclosure.
Company website listed on the deck's closing slide; investor relations materials are linked from here.

Create Your Own Slides
Turn your ideas into professional presentations in seconds with 2slides AI.
Referensikan desain profesional, pilih gaya Anda, dan hasilkan slide dengan rendering teks sempurna. Didukung oleh Nano Banana—mulai buat presentasi Anda sekarang.
Agen AI Anda untuk slide. Hemat waktu, bersinar lebih cepat dengan pembuatan presentasi yang cerdas.


© 2026 2slides. Hak cipta dilindungi.