
Bagian dari Contoh presentasi investor
Mondelez International Q3 2026 earnings presentation (October 29, 2026): organic net revenue +2.1% with volume/mix +1.8pp, adjusted gross profit +14.0% and adjusted operating income +17.0% at constant currency, adjusted EPS $0.78 (+5.5% cst fx), $2.8B returned to shareholders YTD, the Undercover Snacks acquisition, and a reiterated FY2026 outlook.
Menggunakan sampul presentasi ini sebagai referensi gaya untuk slide yang dibuat dari konten Anda sendiri. Atau pilih halaman mana pun di bawah untuk memakai tata letaknya sebagai referensi.
Navigasi Cepat
Tag
Bagikan slide
Mondelez International Q3 2026 earnings presentation (October 29, 2026): organic net revenue +2.1% with volume/mix +1.8pp, adjusted gross profit +14.0% and adjusted operating income +17.0% at constant currency, adjusted EPS $0.78 (+5.5% cst fx), $2.8B returned to shareholders YTD, the Undercover Snacks acquisition, and a reiterated FY2026 outlook.
Tampilan detail setiap halaman slide, termasuk tata letak, konten utama dan elemen visual.
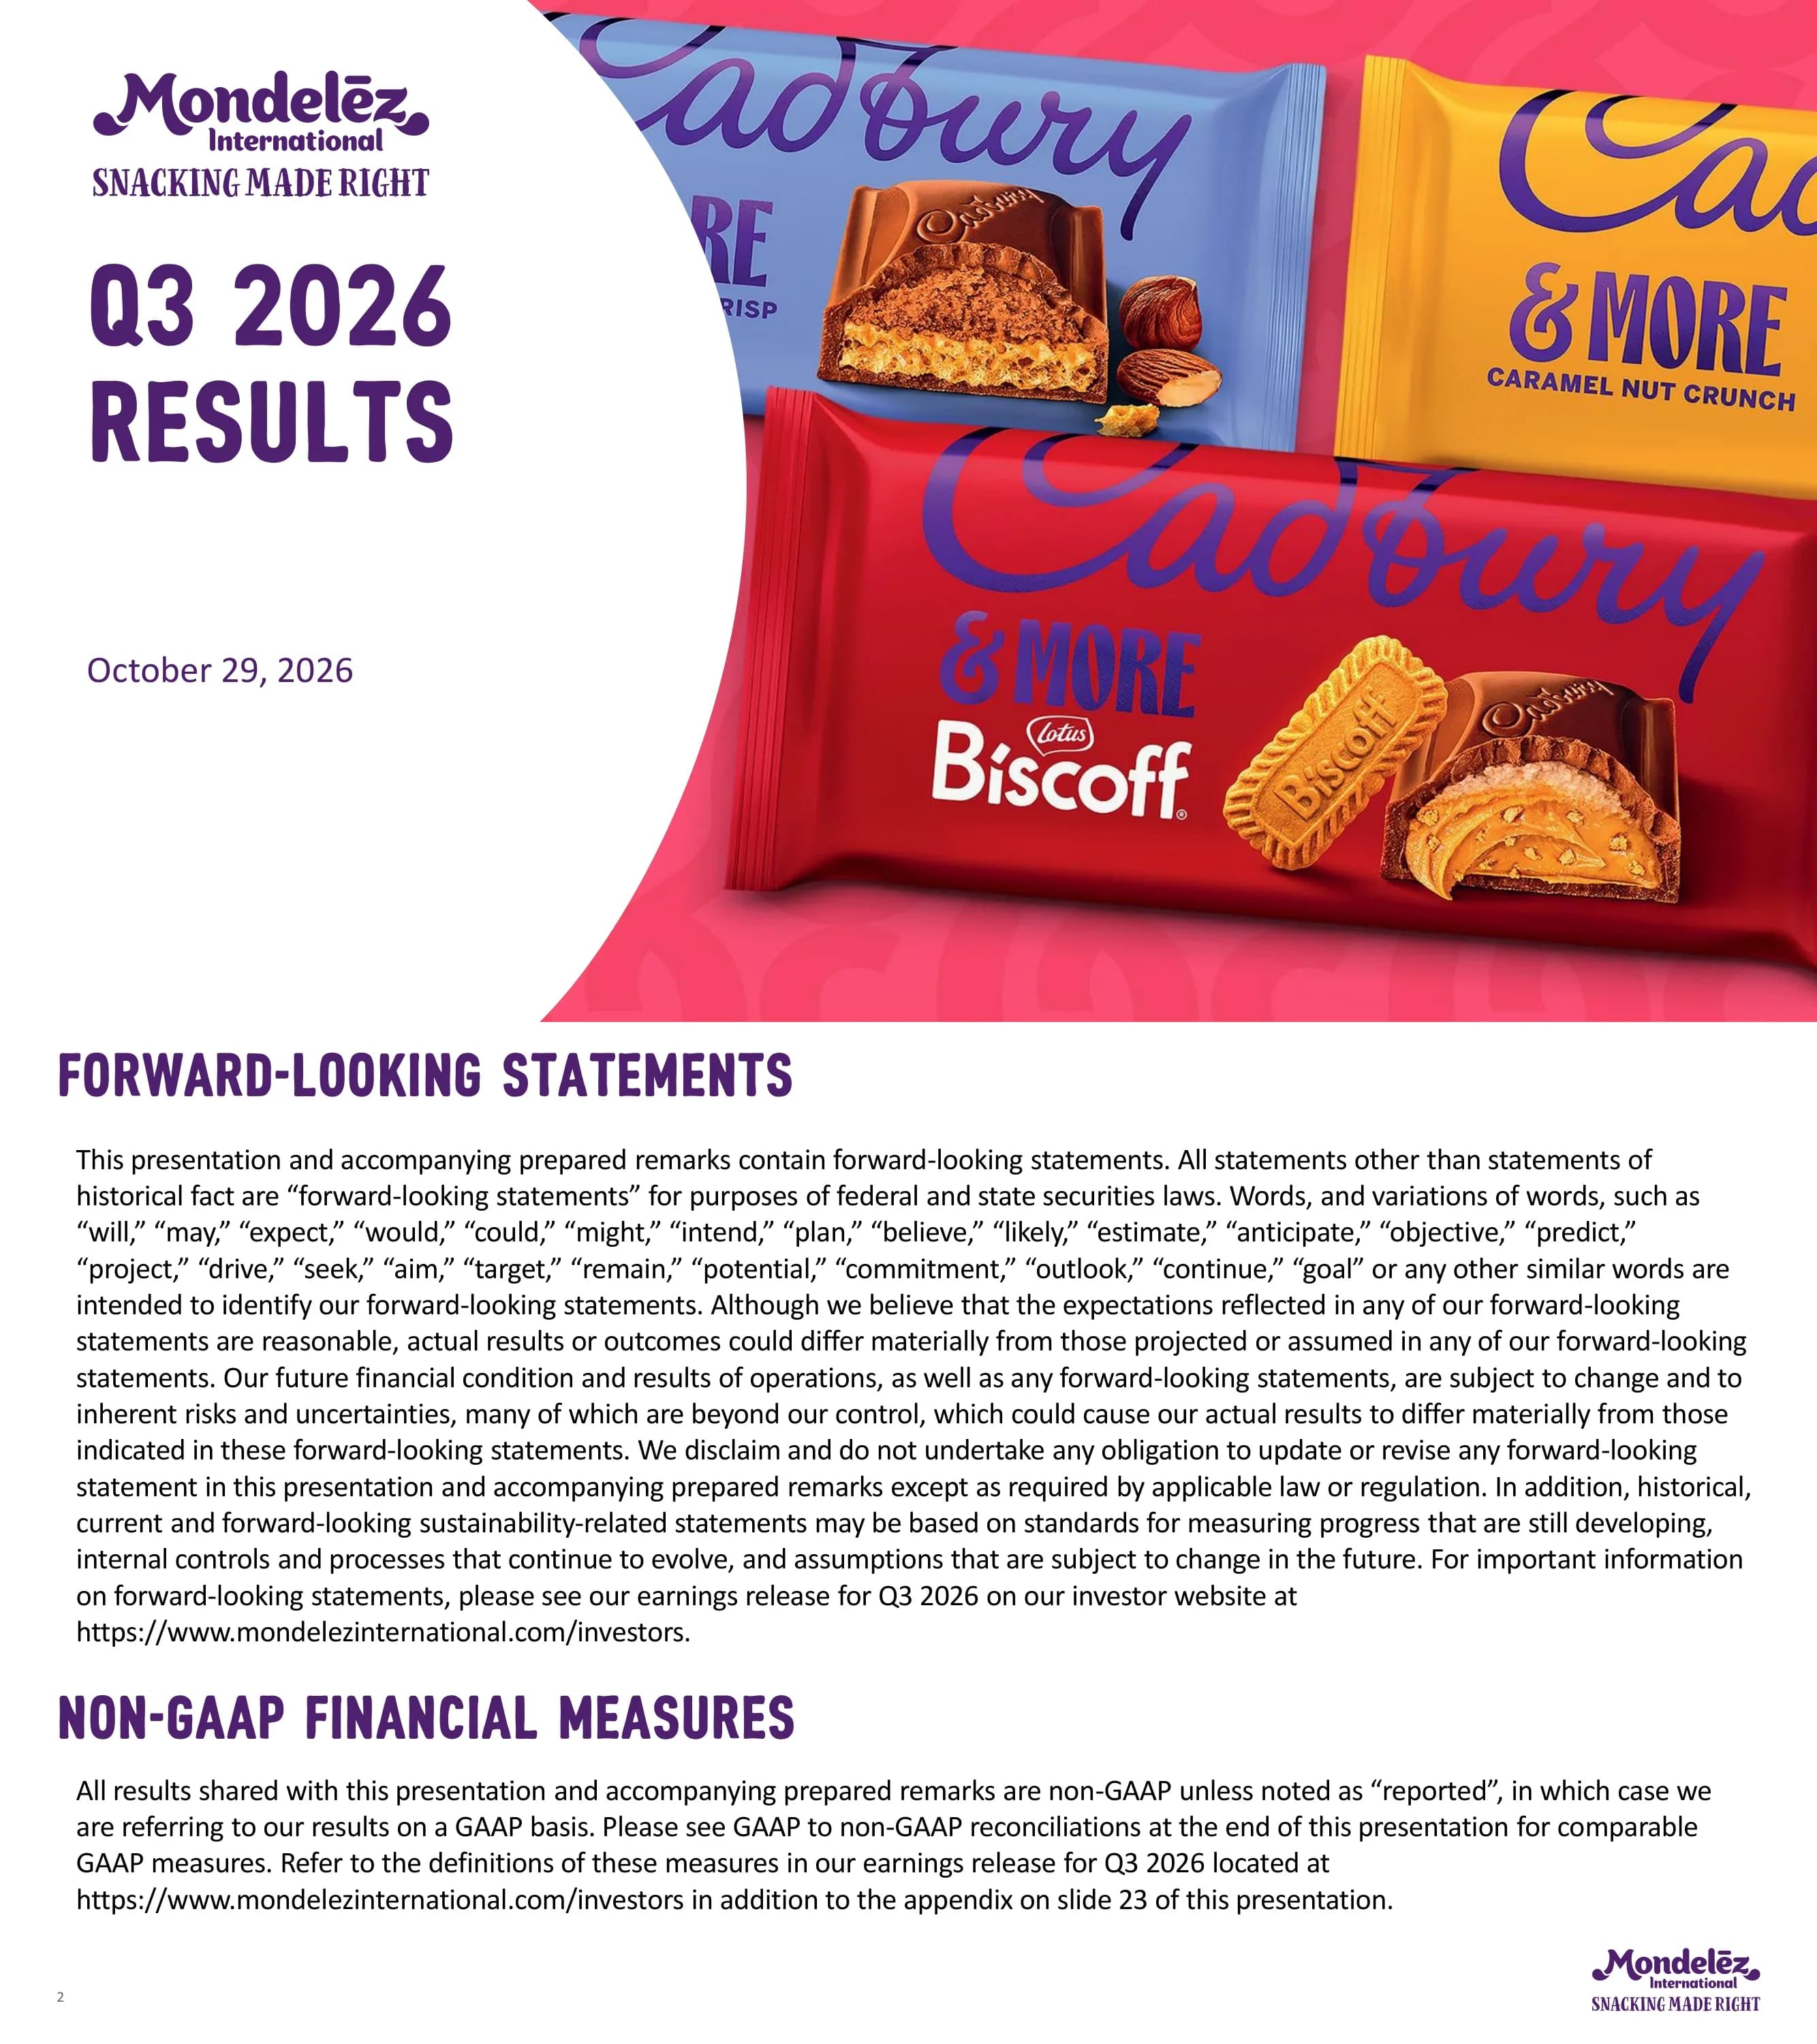
Cover slide reading 'Q3 2026 Results', dated October 29, 2026, with the Mondelez International 'Snacking Made Right' logo and a hero image of three Cadbury '& More' bars (including a Lotus Biscoff variant and a caramel nut crunch variant).
Split layout: white curved panel on the left holding logo, title and date; full-bleed product photography on a pink patterned background on the right.
Safe-harbor language for forward-looking statements and a note that all results in the deck are non-GAAP unless labelled 'reported'; GAAP to non-GAAP reconciliations are provided at the end of the presentation and definitions are in the Q3 2026 earnings release on mondelezinternational.com/investors.
Two stacked text sections, each with a purple uppercase heading over a dense paragraph; logo bottom right.
Three-part agenda (1. Business & Strategy Update, 2. Financial Results, 3. 2026 Outlook) with section 1 highlighted as the current section.
Numbered list on the left with orange circle markers (active item filled and bold); circular 'Empower People to Snack Right' purpose badge top right.
Six headline takeaways: Q3 top-line growth +2.1% with volume/mix +1.8pp; Emerging Markets continue to deliver; Europe returned to volume growth and North America posted solid growth with share gains; Q3 EPS $0.78, +5.5% at constant currency, with double-digit operating income dollar growth after A&C reinvestment; $2.8B of capital returned YTD; FY2026 outlook maintained with strong FY2027 EPS growth still expected.
Numbered bullet list with bold lead-ins occupying the left two-thirds; three circular brand photos (Trident, Sour Patch Kids, Oreo Golden) stacked on the right edge.
KPI scorecard: Q3 2026 organic net revenue +2.1% (vol/mix +1.8pp, price +0.3pp), adjusted gross profit +14.0%, adjusted OI +17.0%, adjusted EPS +5.5% (all cst fx); YTD 2026 organic net revenue +2.4% (vol/mix +0.6pp, price +1.8pp), adjusted gross profit +3.7%, adjusted OI -3.7%, adjusted EPS -4.1%, free cash flow $1.7B.
Grid of five colour-coded metric columns (purple, blue, green, orange, brown) across two rows labelled Q3 2026 and YTD 2026, with large percentage figures in tinted cells.
Bar chart of total MDLZ volume/mix growth: FY'23 +1.4%, FY'24 -0.9%, FY'25 -3.7%, Q1'26 -0.5%, Q2'26 +0.7%, Q3'26 +1.8%, showing a sequential recovery through 2026.
Single centred column chart with a zero baseline; grey bars for historical years and progressively darker purple bars for 2026 quarters, data labels above/below each bar.
Regional consumer and category read: North America confidence pressured by energy prices but spending grows, value channels and smaller packs plus premium/better-for-you growing, biscuits stabilizing and MDLZ gaining share; Europe confidence slightly improved, chocolate volume soft due to a record heat wave but MDLZ holding share; Emerging Markets resilient, robust biscuit growth with share gains via Oreo and Biscoff, solid chocolate growth via distribution and entry packs. Category data from NIQ through August/September 2026.
3x2 matrix: colour-coded region tabs (orange North America, blue Europe, green Emerging Markets) on the left, with Consumer and Categories columns of bullet text in matching tinted boxes.
Announces a signed agreement to acquire a majority stake in Undercover Snacks (chocolate or frosted quinoa crisps), expected to close in early 2027 subject to regulatory review. Rationale: loved for taste and simple ingredients; better-for-you indulgence segment growing 10%+ (NIQ); large distribution and household-penetration runway, highly incremental to MDLZ; founder and CEO Diana Levy continues to run the business standalone, consistent with the bolt-on emerging-brand model.
Left column of four colour-banded section headers (green, blue, orange, brown) with bullets; right panel with a purple header bar over Undercover product packaging photos.
Agenda repeated with section 2, Financial Results, highlighted to open the financial review.
Same numbered agenda layout as page 3 with the second item active; purpose badge top right.
Organic net revenue growth split: Mondelez total Q3 +2.1% (vol/mix +1.8%), YTD +2.4% (vol/mix +0.6%); Emerging Markets (40% of FY25 revenue) Q3 +4.1% (vol/mix +2.2%), YTD +4.9% (vol/mix +1.4%); Developed Markets (60%) Q3 +0.8% (vol/mix +1.5%), YTD +0.8% (vol/mix +0.2%).
Three columns (total highlighted with a lavender panel, EM in blue, DM in orange) by two rows (Q3, YTD); each cell is an organic blob shape with growth % and a smaller overlapping vol/mix bubble.
Category organic net revenue growth: Biscuits & Baked Snacks (48% of revenue) Q3 +2.2% (vol/mix +1.2%), YTD +2.2% (+1.1%); Chocolate (33%) Q3 +0.6% (vol/mix +2.8%), YTD +2.1% (-0.3%); Gum & Candy (10%) Q3 +6.9% (vol/mix +2.6%), YTD +5.9% (+2.5%).
Same blob-and-bubble grid as page 10, with category colours yellow (biscuits), green (chocolate) and brown (gum & candy).
Left chart: YTD 2026 category value growth of Biscuits & Baked Snacks 1.1%, Chocolate 3.0%, Gum & Candy 5.6%, Total Snacks 2.2%. Right chart: share of snacks revenue gaining or holding share rose from ~40% in 2025 to ~70% YTD 2026 (Nielsen and other scanner data as of October 19, 2026).
Two side-by-side column charts separated by a vertical divider, each with a brush-underlined title; long methodology footnote at the bottom.
Organic net revenue growth by region: Mondelez Q3 +2.1% (vol/mix +1.8pp), YTD +2.4% (+0.6pp); Europe Q3 -2.1% (vol/mix +1.6pp), YTD -2.0% (-1.2pp); North America Q3 +1.6% (vol/mix flat), YTD +1.8% (+0.2pp); AMEA Q3 +7.7% (+5.5pp), YTD +8.7% (+5.5pp); Latin America Q3 +6.9% (+0.8pp), YTD +6.8% (-0.6pp).
Five-column blob grid (total in purple, regions in blue) across Q3 and YTD rows, each with a light vol/mix bubble beneath.
Waterfalls: adjusted gross profit from $3.0B in Q3 2025 to $3.4B in Q3 2026 (+14.0% cst fx, +14.9% reported fx) driven by vol/mix +LSD%, pricing net of commodity costs +HSD% and net productivity +MSD%; adjusted operating income from $1.2B to $1.4B (+17.0% cst fx, +18.2% rpt fx) with gross profit +DD% partly offset by SG&A/other -DD%. YTD strip: adjusted gross profit $9.1B to $9.7B (+3.7% cst fx), adjusted OI $3.8B to $3.8B (-3.7% cst fx, -1.0% rpt).
Two waterfall charts side by side (gross profit left, operating income right), purple start/end bars with orange growth ovals, green/red step bars, and a dashed-line YTD summary row underneath.
Adjusted EPS bridge: Q3 2025 $0.73, operations +$0.12, shares +$0.01, interest/other -$0.02, taxes -$0.07, giving $0.77 at constant FX (+5.5%); forex +$0.01 to reported $0.78 (+6.8%). YTD: $2.20 to $2.11 at cst fx (-4.1%), $2.18 reported (-0.9%).
Single horizontal EPS waterfall with green favourable and red unfavourable steps, purple anchor bars with orange growth ovals, and a YTD values strip below a dashed divider.
YTD capital metrics: free cash flow $1.7B with cash conversion cycle of -23 days; share repurchases $0.8B at an average price of $60.60; dividends $1.9B.
Three stacked coloured blobs (purple, blue, gold) labelled Free Cash Flow, Share Repurchases and Dividends, each with bullet figures to the right.
Agenda repeated with section 3, 2026 Outlook, highlighted.
Numbered agenda layout with the third item active; purpose badge top right.
FY26 outlook: organic net revenue growth at least +2% (long-term algorithm 3-5%), adjusted EPS growth flat to +5% at constant FX (LT algo +HSD%), free cash flow ~$3B (LT algo $3B+). Planning assumptions: inflation ~LSD% of COGS, adjusted interest expense ~$350M, adjusted effective tax rate mid-20s, share repurchases up to $2B, forex impact ~+1.5pp on net revenue and +$0.04 on EPS (October 22, 2026 rates).
Guidance table with a vertical purple 'FY26 Outlook' label, purple value boxes, orange long-term algorithm strip, and a grey 'FY26 Planning Assumptions' row of five boxes below a dashed rule.
Summary: strong top-line growth in Q3 and YTD with sequential vol/mix improvement (Emerging Markets compelling, Developed Markets improving, North America solid, Europe inflecting to positive volume, strong share performance); FY2026 outlook maintained while reinvesting in brands and delivering cost savings; despite inflationary headwinds and volatility, strong EPS growth still expected for 2027.
Hierarchical bullet list (three levels) on the left; three circular brand images (Ritz, Milka Monopoly display, Cadbury Heroes) on the right edge.
Portraits of the call speakers: Dirk Van de Put, Chairman & CEO; Luca Zaramella, COO; Amit Banati, CFO.
Three equal hand-drawn purple outline frames, each with a headshot, bold name and title.
Full-bleed purple slide with the white Mondelez International logo and 'Snacking Made Right' tagline, closing the main presentation before the appendix.
Centred logo lockup on a solid brand-purple background.
FX table (source XE.com) comparing FY2025 average rates with October 22 spot rates and the impact direction: Argentine peso 1,224.29 to 1,527.03 per US$ (negative), Australian dollar US$0.64 to 0.70 (positive), Brazilian real 5.59 to 5.04 (positive), Canadian dollar US$0.72 to 0.71 (negative), Chinese yuan 7.19 to 6.68 (positive), euro US$1.13 to 1.12 (negative), Indian rupee 87.17 to 94.73 (negative), Mexican peso 19.21 to 18.70 (positive), pound sterling US$1.32 to 1.34 (positive).
Table with purple brush-stroke row labels including country flags, two rate columns and a red/green arrow impact column.
Explains that the FY2026 outlook metrics (organic net revenue growth, adjusted EPS growth at constant currency, adjusted interest expense, adjusted effective tax rate and free cash flow) are non-GAAP, and that forward-looking GAAP reconciliations are not provided because currency, acquisitions, mark-to-market and capex timing cannot be predicted without unreasonable effort.
Purple heading with a single justified paragraph of disclosure text filling the top half of the slide.
Defines Adjusted SG&A, Adjusted Interest Expense and Adjusted Effective Tax Rate, listing excluded items such as restructuring charges, acquisition and divestiture items, mark-to-market derivative impacts, hyperinflationary remeasurement, geopolitical-conflict costs, ERP System Implementation costs and tax law changes; refers to the Q3 2026 earnings release for other definitions.
Heading plus four text paragraphs, one per definition, with a hyperlink to the investor site.
Q3 2026 reported net revenue $9,967M (+2.3%) vs. $9,744M; organic $9,942M (+2.1%). Regional reported Q3 revenue: Latin America $1,387M (+12.0%), AMEA $2,182M (+8.2%), Europe $3,552M (-3.3%), North America $2,846M (+1.1%); Emerging Markets $4,072M, Developed Markets $5,895M. Nine-month reported revenue $29,402M (+4.9%), organic +2.4%, with vol/mix and pricing by region.
Financial table in millions of US$ with region columns plus EM/DM, split by a dashed line into three-month and nine-month sections.
Q3 2026 reported revenue by sector: Biscuits & Baked Snacks $4,891M, Chocolate $3,091M, Gum & Candy $1,154M, Total Snacks $9,136M (organic +2.2%), Beverages $208M (organic -4.1%), Meals $623M (+3.7%). Nine-month: Total Snacks $26,859M (organic +2.6%), company $29,402M, with vol/mix and pricing by sector.
Sector-column reconciliation table with three-month and nine-month blocks separated by a dashed rule.
Q3 2026 reported gross profit $3,924M and operating income $1,758M, adjusted to $3,407M and $1,384M after removing items including a $543M mark-to-market derivative gain, ERP costs and intangible impairment; adjusted margins 34.2% gross (+3.8pp) and 13.9% operating (+1.9pp). Q3 2025 comparatives: adjusted gross profit $2,964M, adjusted OI $1,171M.
Two-column (Gross Profit, Operating Income) reconciliation table for Q3 2026 above a matching table for Q3 2025.
Nine months 2026: reported gross profit $10,713M and operating income $4,512M; adjusted $9,680M and $3,788M (adjusted margins 32.9% and 12.9%); at constant FX $9,443M and $3,688M (+3.7% and -3.7%). Nine months 2025 adjusted: gross profit $9,105M, OI $3,828M.
Same two-column reconciliation format as page 27, for year-to-date periods.
Q3 2026 reported diluted EPS $1.02 (+78.9%) reconciled to adjusted EPS $0.78 (+6.8%; $0.77 and +5.5% at constant FX), mainly by removing a $0.34 mark-to-market gain. Nine months: reported $2.66 vs. adjusted $2.18 ($2.11 cst fx, -4.1%). Prior-year adjusted EPS: $0.73 (Q3 2025) and $2.20 (nine months 2025).
Two-period EPS reconciliation table for 2026 above the equivalent 2025 table.
Nine months to September 30: net cash from operating activities $2,606M (2025: $2,117M) less capital expenditures $947M ($881M) gives free cash flow $1,659M vs. $1,236M, up $423M.
Compact three-row table with 2026, 2025 and $ change columns at the top of an otherwise empty slide.
Historical organic growth supporting the volume/mix trend chart: FY2023 reported revenue $36,016M (organic +14.8%, vol/mix +1.4pp), FY2024 $36,441M (+4.4%, -0.9pp), FY2025 $38,537M (+4.3%, -3.7pp), Q1 2026 $10,080M (+3.0%, -0.5pp), Q2 2026 $9,355M (+2.2%, +0.7pp).
Five-period reconciliation table (three fiscal years and two quarters) with current and prior-period blocks and growth, vol/mix and pricing rows.
Pertanyaan umum tentang slide ini dan konten presentasi yang mendasarinya.
Reported net revenue was $9,967 million, up 2.3%, and organic net revenue grew 2.1% with volume/mix contributing +1.8pp. Adjusted gross profit rose 14.0% and adjusted operating income 17.0% at constant currency, and adjusted EPS was $0.78 (+5.5% at constant currency; reported diluted EPS $1.02).
Mondelez reiterated its FY2026 outlook: organic net revenue growth of at least +2%, adjusted EPS growth flat to +5% at constant currency, and free cash flow of about $3 billion. Planning assumptions include adjusted interest expense of ~$350M, a mid-20s adjusted tax rate and share repurchases of up to $2B.
AMEA (+7.7%) and Latin America (+6.9%) led organic growth, North America grew +1.6%, and Europe declined -2.1% but returned to positive volume/mix (+1.6pp). By category, Gum & Candy grew +6.9%, Biscuits & Baked Snacks +2.2% and Chocolate +0.6%.
Slide 8 announces a signed agreement to acquire a majority stake in Undercover Snacks, a maker of chocolate and frosted quinoa crisps in the better-for-you indulgence segment. The deal is expected to close in early 2027 subject to regulatory review, and founder and CEO Diana Levy will keep running the business standalone.
Through the first nine months of 2026, Mondelez returned $2.8 billion: $1.9 billion in dividends and $0.8 billion in share repurchases at an average price of $60.60. Year-to-date free cash flow was $1.7 billion ($1,659 million).
Yes. The page offers the original PDF released by Mondelez International and an editable PPTX converted from it, so you can reuse the layouts such as the KPI scorecard, regional blob grid, profit and EPS waterfalls and the outlook table. The PPTX is a machine conversion, so check fonts and charts before presenting.
It is Mondelez International's own Q3 2026 results presentation dated October 29, 2026, published on its investor relations site (ir.mondelezinternational.com). Mondelez is listed on Nasdaq under the ticker MDLZ. Most figures are non-GAAP, with GAAP reconciliations on slides 25-31.
Slide 20 shows the speakers: Dirk Van de Put (Chairman and CEO), Luca Zaramella (COO) and Amit Banati (CFO).
Original source file of this presentation
Investor site referenced in the deck for the Q3 2026 earnings release and non-GAAP definitions

Create Your Own Slides
Turn your ideas into professional presentations in seconds with 2slides AI.
Referensikan desain profesional, pilih gaya Anda, dan hasilkan slide dengan rendering teks sempurna. Didukung oleh Nano Banana—mulai buat presentasi Anda sekarang.
Agen AI Anda untuk slide. Hemat waktu, bersinar lebih cepat dengan pembuatan presentasi yang cerdas.


© 2026 2slides. Hak cipta dilindungi.