
Bagian dari Contoh presentasi investor
Mapletree Industrial Trust 2Q FY26/27 (July-September 2026) and 1H FY26/27 results presentation, lodged with SGX: S$ (Singapore dollars) 119.8 million net property income, DPU 2.97 cents, 37.7% leverage, and a S$8.3 billion portfolio of 134 data centre and industrial properties across Singapore, North America and Japan
Menggunakan sampul presentasi ini sebagai referensi gaya untuk slide yang dibuat dari konten Anda sendiri. Atau pilih halaman mana pun di bawah untuk memakai tata letaknya sebagai referensi.
Navigasi Cepat
Tag
Bagikan slide
Mapletree Industrial Trust 2Q FY26/27 (July-September 2026) and 1H FY26/27 results presentation, lodged with SGX: S$ (Singapore dollars) 119.8 million net property income, DPU 2.97 cents, 37.7% leverage, and a S$8.3 billion portfolio of 134 data centre and industrial properties across Singapore, North America and Japan
Tampilan detail setiap halaman slide, termasuk tata letak, konten utama dan elemen visual.
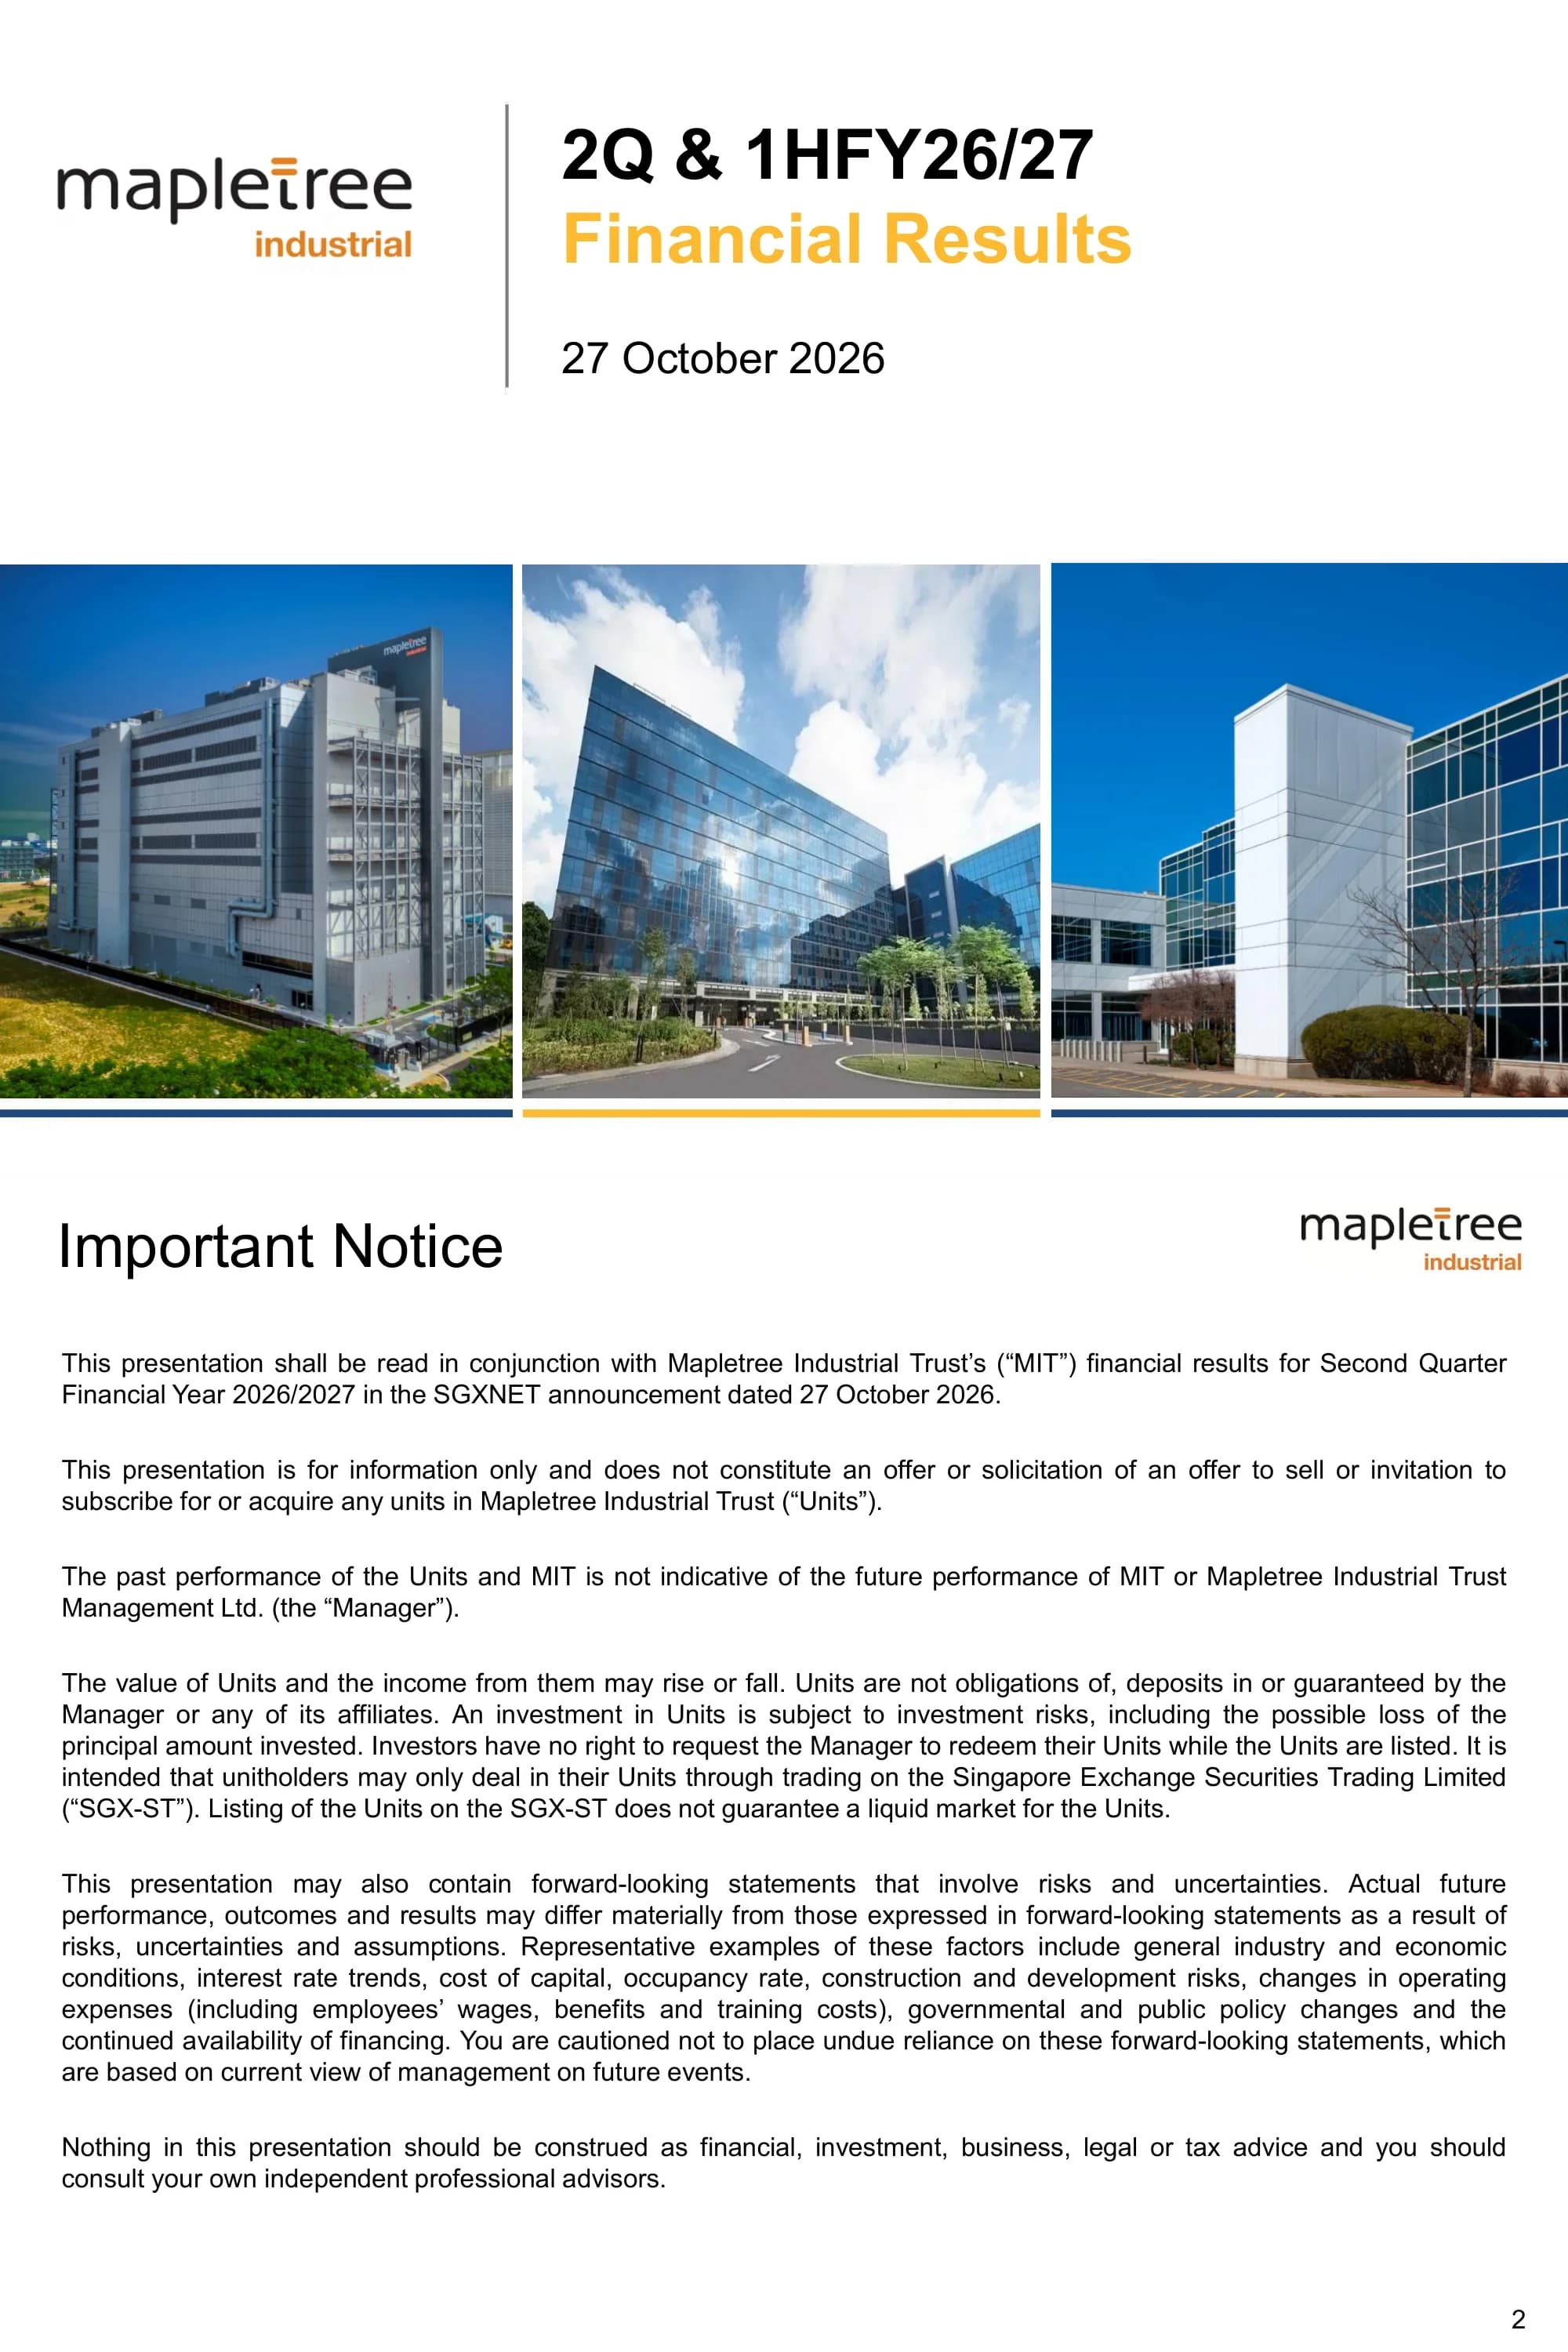
Cover slide for Mapletree Industrial Trust's (MIT) second-quarter and first-half FY26/27 financial results, dated 27 October 2026.
Logo at left, divider rule, bold title with yellow subtitle on the right; three-panel property photo strip across the lower half.
Legal disclaimer: the deck should be read with the SGXNET results announcement of 27 October 2026; it is not an offer of units, past performance is not indicative, units trade on SGX-ST, and forward-looking statements carry risks such as interest rates, occupancy and financing availability.
Full-width justified text in six paragraphs under a slide title.
Agenda in four sections: Key Highlights for 1 Jul to 30 Sep 2026; 2Q & 1HFY26/27 Financial Performance; Portfolio Update; Outlook.
Numbered list (01-04) on a pale blue horizontal band.
Section divider for the quarter's key highlights, photographed at the data centre at 13831 Katy Freeway, Houston.
Full-bleed building photograph with a translucent title box in the lower right and an italic photo caption.
Lower North American contribution, no income from the divested Singapore properties and pricier replacement interest rate swaps weighed on DPU. Net property income was S$119.8 million (down 3.5% y-o-y), distributable income to unitholders S$84.8 million (down 6.5%) and DPU 2.97 cents (down 6.6%). Singapore rental reversion rose to 6.9% from 5.3% in 1Q; 3255 Neil Armstrong Boulevard in Eagan, Minnesota was divested on 30 Sep 2026; after the quarter MIT signed new 15.5-year and 5.3-year leases at 1001 Windward Concourse, Alpharetta and 400 Holger Way, San Jose from Oct 2026. Aggregate leverage was 37.7% and about 90.8% of the next 12 months' distributable income is hedged or derived in SGD.
Three bolded blue headings (results, portfolio, capital management) each with square-bullet sub-points; down-triangle markers on the declines.
Section divider for the financial performance section, shown over the Hi-Tech Buildings and Business Space build-to-suit project for HP.
Full-bleed photograph of a glass office campus with a title box in the upper right and an amber accent bar.
Year-on-year table in S$'000: gross revenue 167,017 vs 170,211 (-1.9%); property operating expenses 47,264 vs 46,170 (+2.4%); net property income 119,753 vs 124,041 (-3.5%); borrowing costs 20,177 vs 21,659 (-6.8%); joint-venture cash distribution 6,046 vs 5,344 (+13.1%); amount available for distribution 87,276 vs 93,094 (-6.2%), of which 84,818 to unitholders (-6.5%); DPU 2.97 vs 3.18 cents (-6.6%); units 2,856 million. Commentary attributes the NPI drop to North American lease non-renewals, higher expenses and the Aug 2025 Singapore Portfolio Divestment, and lower borrowing costs to debt repayment from divestment proceeds.
Financial table on the left with a blue header row and grey-shaded current-period column; grey commentary panel with blue headings on the right.
Half-year table in S$'000: gross revenue 329,324 vs 346,093 (-4.8%); property operating expenses 87,296 vs 88,437 (-1.3%); net property income 242,028 vs 257,656 (-6.1%); borrowing costs 38,677 vs 46,186 (-16.3%); JV cash distribution 11,900 vs 10,789 (+10.3%); amount available for distribution 179,533 vs 188,701 (-4.9%); to perpetual securities holders 5,924 vs 4,738 (+25.0%); to unitholders 173,609 vs 183,963 (-5.6%); 1H DPU 6.08 vs 6.45 cents (-5.7%). Borrowing costs also benefited from temporary loan repayment with proceeds of new perpetual securities issued in Mar 2026.
Same two-column layout as the quarterly comparison: table left, commentary right.
Quarter-on-quarter table in S$'000: gross revenue 167,017 vs 162,307 (+2.9%); property operating expenses 47,264 vs 40,032 (+18.1%); NPI 119,753 vs 122,275 (-2.1%); borrowing costs 20,177 vs 18,500 (+9.1%); JV distribution 6,046 vs 5,854 (+3.3%); amount available for distribution 87,276 vs 92,257 (-5.4%); to unitholders 84,818 vs 88,791 (-4.5%); DPU 2.97 vs 3.11 cents (-4.5%). Higher borrowing costs reflect replacement hedges and the end of temporary savings from perpetual securities proceeds, partly offset by repaying loans with Philadelphia divestment proceeds.
Table left, grey commentary panel right, footnote marking unit change below 0.1%.
As at 30 Sep 2026 vs 31 Mar 2026: total assets S$7,967.6 million vs S$7,938.6 million (+0.4%); total liabilities S$3,034.0 million vs S$2,692.6 million (+12.7%); net assets attributable to unitholders S$4,633.8 million vs S$4,642.7 million (-0.2%); net asset value per unit S$1.62 vs S$1.63 (-0.6%). NTA per unit equals NAV as there are no intangible assets.
Simple four-row balance sheet table with a blue header and shaded current column; large white space below.
Including MIT's share of its joint venture, at 30 Sep 2026 vs 30 Jun 2026: total borrowings S$3,105.1 million vs S$3,084.8 million; weighted average debt tenor 3.5 vs 3.4 years; aggregate leverage 37.7% vs 37.5%; interest rate hedge ratio 72.7% vs 73.3%; hedge tenor 2.9 vs 3.1 years; average borrowing cost 3.3% vs 3.2%; trailing 12-month interest coverage 4.0 times; Fitch issuer rating 'BBB+' with Stable Outlook. About S$600 million of interest rate hedges expire in each of FY26/27 and FY27/28, and replacement hedges at higher rates may keep pressuring distributions.
Two-period metrics table with bold current values, followed by a grey takeaway box and footnotes.
Stacked bar chart of borrowings by fiscal year in S$ million (MTN, bank loans and 50% share of JV loans): FY26/27 110.9 (4%); FY27/28 853.2 (27%); FY28/29 229.8 (7%); FY29/30 308.8 (10%); FY30/31 635.4 (20%); FY31/32 707.9 (23%); FY32/33 123.4 (4%); FY35/36 53.5 (2%); FY38/39 82.2 (3%). Debt currency mix: USD 63.5%, SGD 18.2%, JPY 18.0%, CAD 0.3%. No more than 28% of debt matures in any year, and committed facilities cover FY26/27 refinancing.
Stacked column chart on the left with dashed boxes for JV loans; donut chart in a bordered panel on the right; grey takeaway band below.
About 72.7% of the S$3,105.1 million total debt is hedged or fixed-rate; the unhedged 27.3% splits into SGD 10.9% and USD 16.4%. A 50 bp move in base rates (SORA and SOFR) would change distributable income by about S$3.5 million, or 0.12 cent of DPU, per year. On forex, MIT borrows in local currencies as a natural hedge, and 90.8% of distributable income for the next 12 months is hedged or derived in SGD (9.2% unhedged).
Two bordered side-by-side panels, each with grey bullet text, a donut chart and a labelled breakdown.
Section divider for the portfolio update, shown over Mapletree Hi-Tech Park @ Kallang Way in Singapore.
Full-bleed photograph of a modern business park with a title box in the upper right.
S$8.3 billion AUM, 23.6 million sq ft of NLA and more than 2,000 tenants. By segment: data centres 57.1% (North America 46.1%, Japan 7.4%, Singapore 3.6%), general industrial buildings 24.4%, hi-tech buildings and business space 18.5%. By geography: Singapore 46.5%, North America 46.1%, Japan 7.4%. AUM includes MIT's 50% JV interest with Mapletree Investments in 3 hyperscale and 10 powered shell data centres in North America.
Three blue KPI tiles across the top; segment donut chart with callout at lower left; geography table beneath; photo grid of two images per segment on the right.
Properties: Singapore 79, North America 53, Japan 2, total 134. NLA: 15.1, 8.0, 0.5 and 23.6 million sq ft. Occupancy in 2QFY26/27 (1Q in brackets): Singapore 94.2% (94.3%), North America 79.1% (82.5%), Japan 100.0%, overall 89.7% (90.7%). Average rents S$2.28 psf/month in Singapore and US$2.54 in North America. Segment occupancy: data centres 82.1% (85.0%), hi-tech buildings and business space 90.1% (88.3%), general industrial buildings 95.3% (96.0%).
Summary table by geography on top; paired bar chart of segment occupancy (1Q vs 2Q) below.
WALE at 30 Sep 2026 (vs 2025): North America 6.7 (6.2) years, Singapore 2.6 (2.8), Japan 13.3 (14.2), overall 4.4 (4.6). Lease expiries by gross rental income: FY26/27 6.4%, FY27/28 20.8%, FY28/29 16.2%, FY29/30 14.0%, FY30/31 6.7%, FY31/32 and beyond 35.9%. North American data centres are about 1.4% of FY26/27 expiries; 1.2% have confirmed they will not renew, of which 1.1% has been backfilled by the new 15.5-year Alpharetta lease from Oct 2026.
WALE table at the top left; stacked column chart of expiries by year and segment below, with patterned fills for data centre geographies.
Managing North American vacancies through reletting (early engagement and backfilling), repositioning (DPU-accretive redevelopment) and rebalancing (divesting non-core assets). In 1HFY26/27 MIT executed about 364,500 sq ft of leases, 5.2% of North American NLA (79.0% new leases, 21.0% renewals); renewals that commenced in 1Q had a 2.2% reversion; the Eagan Data Centre was divested on 30 Sep 2026. After the quarter, new 15.5-year and 5.3-year leases were secured at the Alpharetta and San Jose data centres, starting Oct 2026 with annual escalations.
Strategy bullets at top; three coloured icon cards (Reletting, Repositioning, Rebalancing); bordered panel with a lease-mix donut and highlight bullets.
Top 10 tenants by gross rental income at 30 Sep 2026: HP 6.8%, an established data centre operator 4.1%, a global colocation provider 3.5%, a global social media company 3.2%, Equinix 2.6%, Bank of America 2.5%, an NYSE-listed telco 1.7%, Vanderbilt University Medical Center 1.5%, a leading aerospace technology company 1.4% and TierPoint 1.4%. Top 10 make up about 28.7% of gross rental income across more than 2,000 tenants; some names are withheld under lease confidentiality.
Descending bar chart with tenant logos or descriptions beneath each bar; blue summary box in the upper right.
No trade sector exceeds 16% of gross rental income. Groups: InfoComm 29.62% (data centre services 15.03%, telecommunications 9.28%), manufacturing 29.53% (precision engineering, machinery and transportation products 15.95%), wholesale and retail trade 15.53%, financial and business services 13.40%, others 11.92%.
Two-ring sunburst chart with labelled outer segments and leader lines; banner statement above.
2QFY26/27 Singapore renewals: 639,761 sq ft across 184 leases at a 6.9% weighted reversion (5.3% in 1Q). Hi-tech buildings and business space: 39,651 sq ft, 17 renewals, 3.7% (3.0%). General industrial buildings: 600,110 sq ft, 167 renewals, 7.1% (6.4%). North America had no renewal leases in the quarter (2.2% in 1Q). Singapore tenant retention was 77.3%.
Table with grouped headers comparing renewal volume and reversion rates by portfolio and segment; takeaway bullets below.
About 75.3% of the data centre portfolio is on triple net leases, with tenants bearing most maintenance, tax and insurance costs; double net and net leases 12.8%, gross leases 11.9%. By type: powered shell 59.5%, fitted hyperscale 22.0%, fitted 18.5%. By tenant type: colocation providers 44.6%, cloud/hyperscale providers 23.7%, enterprise/end users 23.7%, others 8.0%.
Two bullets at the top; three donut charts below, two on the left for lease and facility types and one on the right for tenant types, split by a vertical rule.
Tenant exercised its purchase option for a single-storey building at 3255 Neil Armstrong Boulevard, Eagan, Minnesota (87,402 sq ft NLA). Sale price US$9.81 million (US$ figures as shown) versus a US$9.0 million purchase price in Jul 2021 (part of a 29-data-centre portfolio) and a US$10.9 million valuation at 31 Mar 2026 by Cushman & Wakefield. Completed 30 Sep 2026; net proceeds go to debt reduction and/or working capital.
Key-fact table with blue label cells on the left and a captioned property photograph on the right.
Targets by FY29/30 for Singapore properties versus FY19/20: 15% lower average building electricity intensity, 17% lower Scope 2 GHG emissions intensity, and EV charging points at 30% of the Singapore portfolio. 2QFY26/27 achievements: 'A' for GRESB Public Disclosure, 204 trees planted since Apr 2026, and BCA Green Mark Platinum re-certification for 161 and 163 Kallang Way.
Three green icon target tiles across the top; bordered achievements panel with three icon-led statements below.
Section divider for the outlook section, shown over the data centre at 2601 West Broadway Road, Tempe.
Full-bleed photograph of a glass-curtain-wall building with a title box in the lower right.
The operating environment is challenging: global activity held up in 1H2026 despite the Middle East war and trade tensions, with the IMF projecting 3.1% growth in 2026 and 3.4% in 2027. MIT's near-term results will be hit by North American lease non-renewals and higher borrowing costs as swaps reprice, cushioned by Singapore and Japan assets and a 6.7-year North American WALE. Singapore's MTI raised its 2026 GDP forecast to 4.5% to 5.5%; GDP grew 5.4% y-o-y in the quarter to 30 Sep 2026.
Grey highlighted box with a blue heading and three justified bullets; Singapore subsection below; source footnotes.
CBRE: North American primary-market data centre capacity under construction rose almost 25% y-o-y to a record 7,481 MW (80.4% preleased), supply grew 33% to 10,903 MW, and vacancy fell to 1.4%; power, infrastructure and community opposition constrain development. Cushman & Wakefield: Greater Tokyo operational capacity grew 218 MW (+18%) to 1,397 MW, with under-construction capacity down 4% to 220 MW and vacancy at 4.4%; Greater Osaka offers cheaper land and 3-5 year grid connections versus 8-10 years in Tokyo.
Text-heavy slide with two underlined regional subheadings and justified bullets; source footnotes.
Three pillars: proactive portfolio rejuvenation (target S$500 million to S$600 million of North American divestments; broaden into more industrial and data centre sectors); prudent capital management (use proceeds to repay debt and create headroom; hedge rate and currency risks); strategic growth and value creation (redevelopment and repositioning; tenant-led investment through long-term partnerships).
Three rounded colour blocks (navy, yellow, teal) with chevron arrows pointing to bullet pairs on the right.
Closing slide with investor relations enquiry contact details (Vice President, Investor Relations and Sustainability) and the same three-panel property photo strip as the cover.
Mirrors the cover: logo left, divider, title and contact text right, photo strip below.
Pertanyaan umum tentang slide ini dan konten presentasi yang mendasarinya.
It is the 29-slide deck Mapletree Industrial Trust (MIT) released on 27 October 2026 with its results for the second quarter and first half of FY26/27. It covers highlights, financial performance, capital management, a portfolio update and outlook.
It was lodged with SGX (Singapore Exchange) through SGXNET on 27 October 2026, alongside MIT's results announcement. The disclaimer says it should be read with that announcement.
Mapletree's financial year starts on 1 April, so FY26/27 runs from April 2026 to March 2027. 2Q FY26/27 is July to September 2026, and 1H FY26/27 is April to September 2026.
Singapore requires half-yearly financial reporting, so many SGX-listed issuers publish only a business update for Q1 and Q3. This 2Q deck is the half-year results presentation, so it includes full half-year figures. MIT still reports quarterly DPU.
Net property income was S$119.8 million (down 3.5% year on year), distributable income to unitholders was S$84.8 million (down 6.5%), and DPU was 2.97 cents (down 6.6%). For 1H FY26/27, DPU was 6.08 cents versus 6.45 cents a year earlier.
The deck gives three reasons: lower contributions from the North American portfolio after some leases were not renewed, no income from three Singapore properties divested in August 2025, and higher interest costs as maturing interest rate swaps were replaced at higher rates.
At 30 September 2026, aggregate leverage was 37.7%, total borrowings were S$3,105.1 million, 72.7% of debt was hedged or fixed, the average borrowing cost was 3.3% and the Fitch rating was BBB+ with a Stable Outlook. No more than 28% of debt matures in any single year.
Yes. The page offers the original PDF and a PPTX converted from it, so you can reuse the layout of the results tables, debt maturity chart and portfolio dashboards. Check slide text against the PDF, because conversions can shift some formatting.
Official site with results announcements and presentation archives
SGXNET filings, including the 27 October 2026 results announcement

Create Your Own Slides
Turn your ideas into professional presentations in seconds with 2slides AI.
Referensikan desain profesional, pilih gaya Anda, dan hasilkan slide dengan rendering teks sempurna. Didukung oleh Nano Banana—mulai buat presentasi Anda sekarang.
Agen AI Anda untuk slide. Hemat waktu, bersinar lebih cepat dengan pembuatan presentasi yang cerdas.


© 2026 2slides. Hak cipta dilindungi.