
Bagian dari Contoh presentasi investor · Contoh presentasi investor India
Mahindra & Mahindra's Q2 FY27 (quarter ended 30 September 2026) Analyst & Press Meet earnings presentation, dated 5 November 2026 and filed with the Indian stock exchanges BSE/NSE, covering consolidated results, the Farm and Auto sectors, and the financial statements.
Menggunakan sampul presentasi ini sebagai referensi gaya untuk slide yang dibuat dari konten Anda sendiri. Atau pilih halaman mana pun di bawah untuk memakai tata letaknya sebagai referensi.
Navigasi Cepat
Tag
Bagikan slide
Mahindra & Mahindra's Q2 FY27 (quarter ended 30 September 2026) Analyst & Press Meet earnings presentation, dated 5 November 2026 and filed with the Indian stock exchanges BSE/NSE, covering consolidated results, the Farm and Auto sectors, and the financial statements.
Tampilan detail setiap halaman slide, termasuk tata letak, konten utama dan elemen visual.
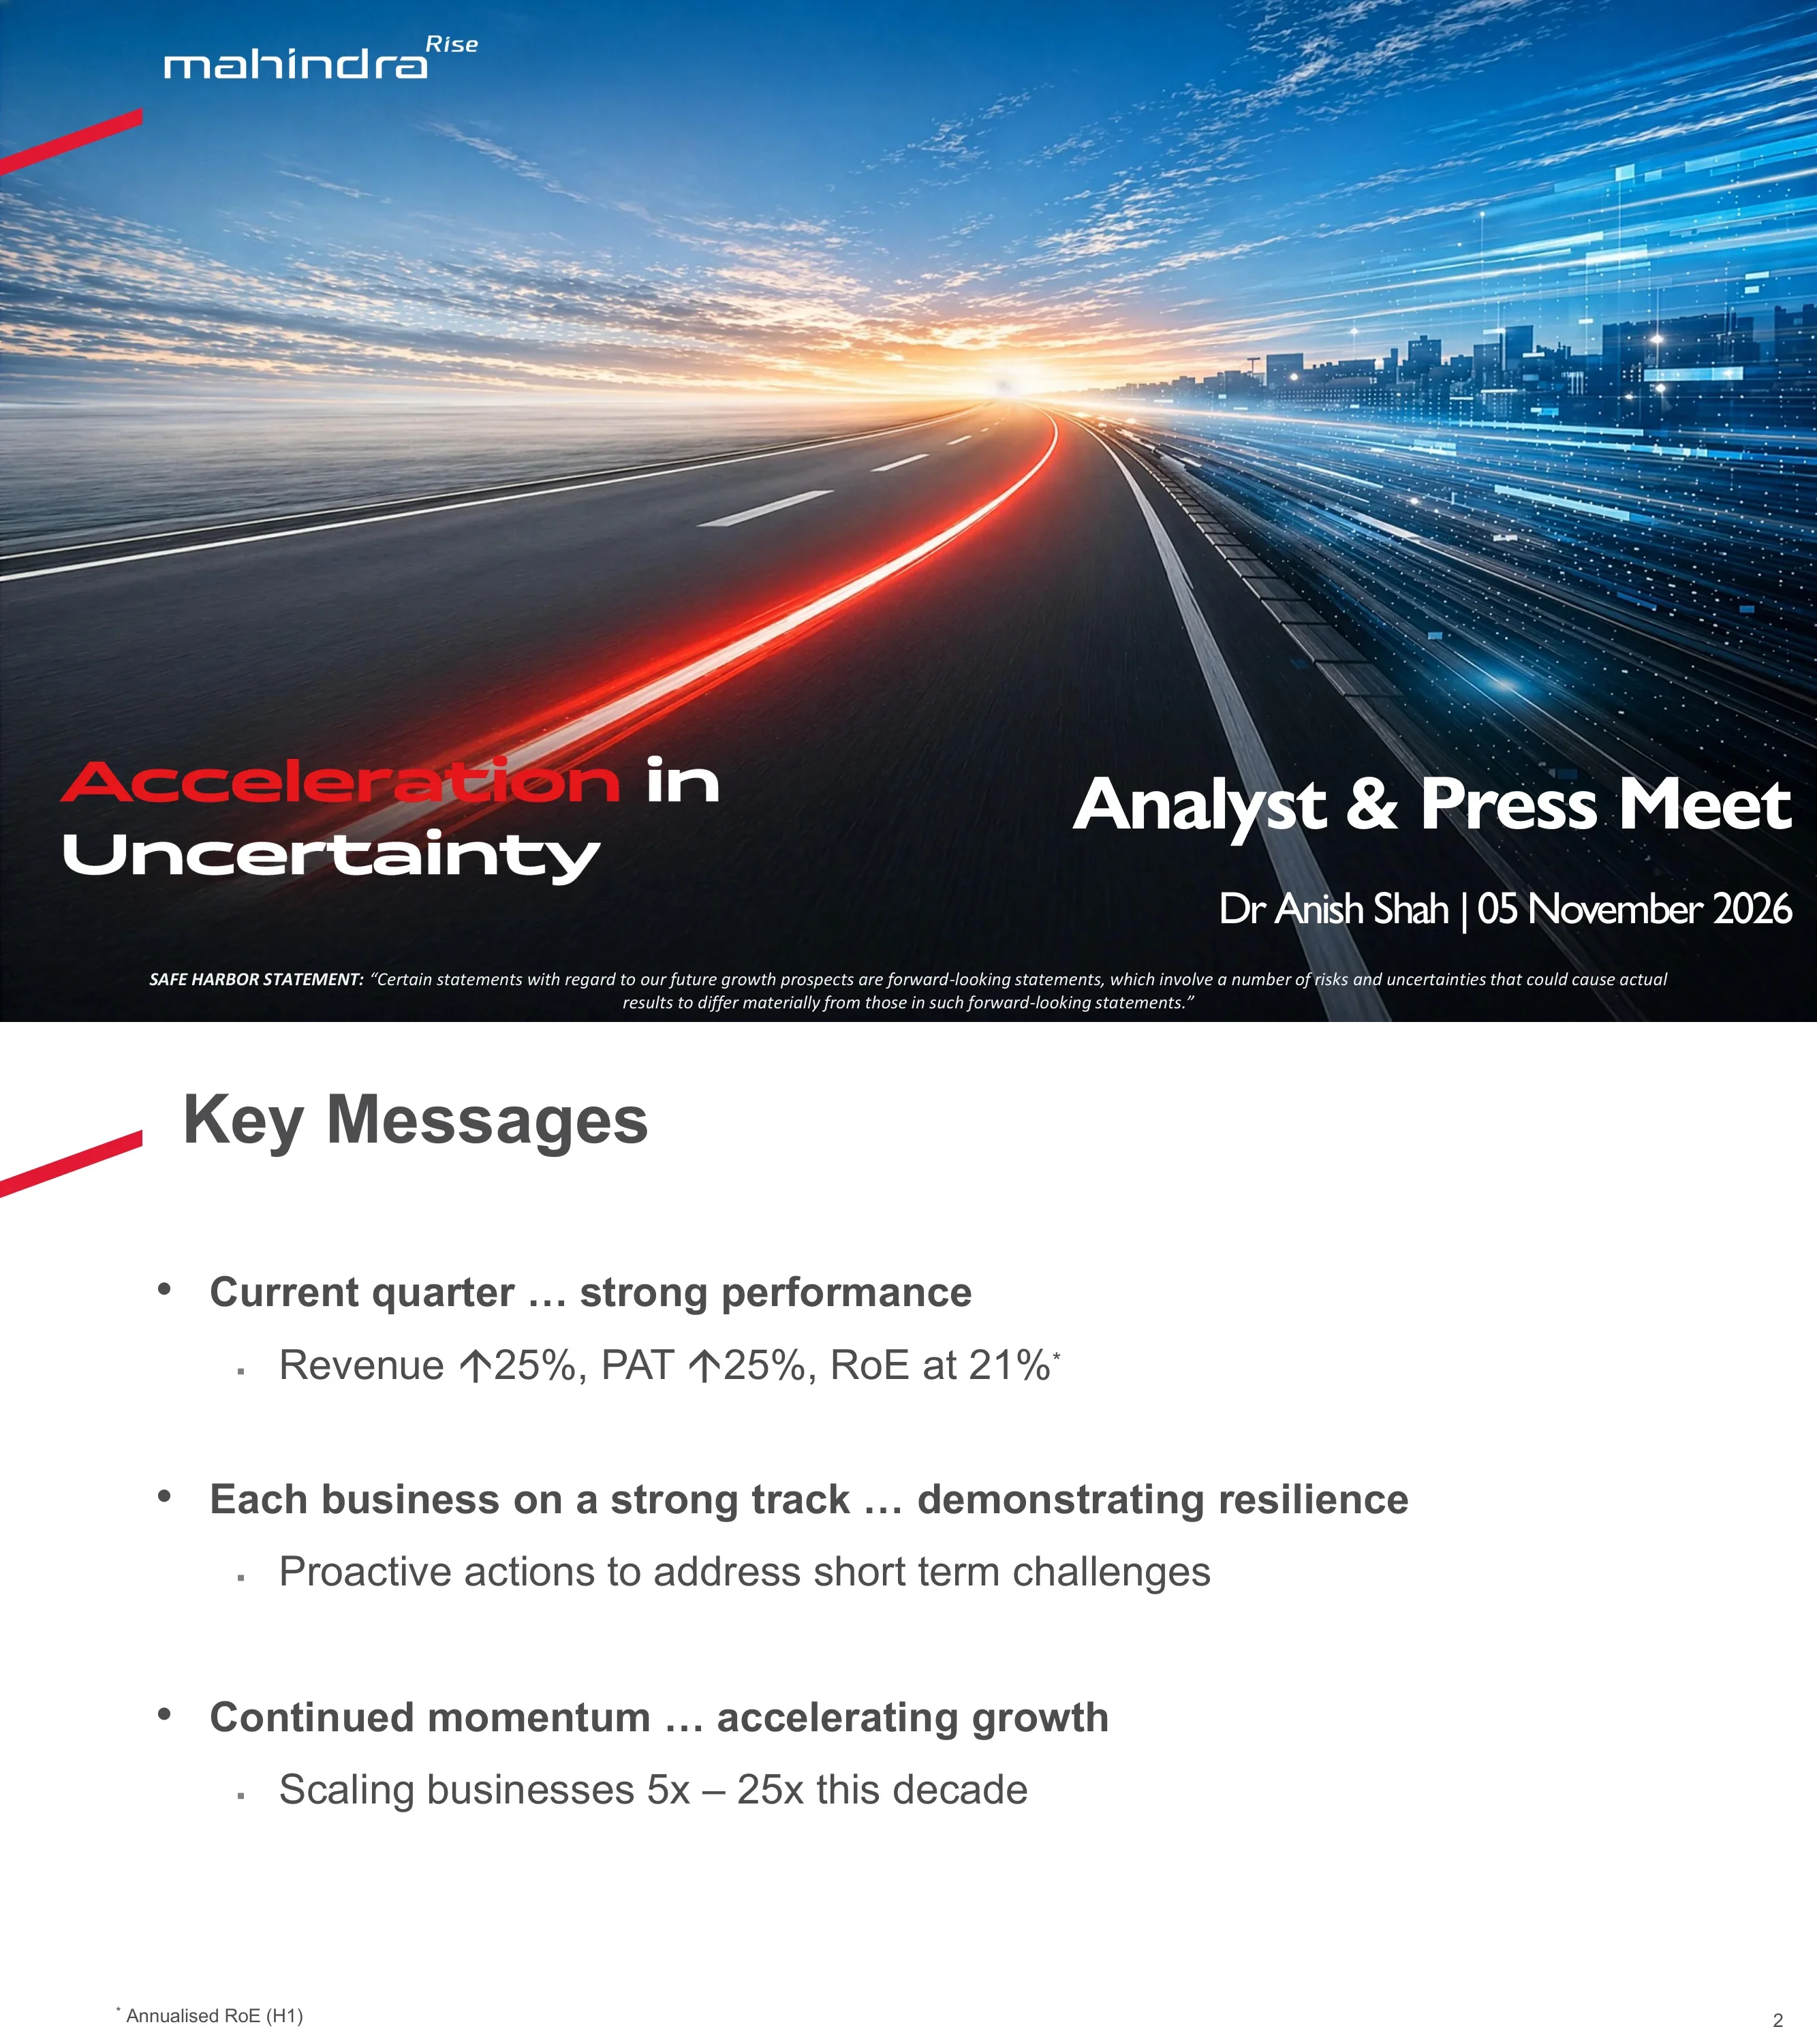
The cover announces the Analyst & Press Meet titled "Acceleration in Uncertainty" presented by Dr Anish Shah on 05 November 2026, with a safe harbor statement at the bottom.
Full-bleed photo with centered title block and a small disclaimer strip along the bottom edge.
Management states that the current quarter is strong (revenue up 25%, PAT up 25%, annualised H1 RoE of 21%), each business is on a strong track and resilient, and momentum continues with businesses scaling 5x-25x this decade.
Title with three stacked bullet statements on a white background.
Q2 revenue rose from ₹46,106 crore to ₹57,553 crore (+25%) and PAT from ₹3,673 crore to ₹4,588 crore (+25%), while YTD revenue reached ₹1,15,741 crore (+26%) and YTD PAT ₹10,042 crore (+29%).
Four-panel grid of paired navy bar charts with growth callouts.
PAT growth by business ranged from 3x for Growth Gems and +61% for MMFSL to +55% for Auto, +33% for TechM, -9% for Farm and -80% for Investments, with consolidated PAT up 25%.
Horizontal bar chart with a growth column and a drivers column.
Against a target of 15-20% EPS growth and 18% RoE, EPS grew from ₹21.0 in H1 F22 to ₹89.5 in H1 F27 (34% CAGR) and RoE rose from 14.8% to 21.0% annualised.
Left "What we said" box with two bar charts on the right.
Auto PAT grew 55% to ₹2,388 crore with strong volume but short-term margin pressure, while Farm PAT fell 9% to ₹1,053 crore with market share maintained, each shown with challenges and actions.
Two chart rows, each with challenge-to-action arrows and a summary statement.
A matrix of inflationary headwinds (steel and base metals, rubber, precious metals, currency, oil) is offset by Auto price increases of +5% and Farm of +4%, with core tractor margin pressure expected in Q3, improvement in Q4 and normalcy in F28.
Color-coded arrow matrix table with an offsets panel and a conclusion bar.
TechM PAT rose 33% to ₹445 crore, MMFSL PAT rose 61% to ₹477 crore with ROA at 2.3%, and Growth Gems PAT tripled from ₹61 crore to ₹168 crore.
Three chart rows, each with challenges and actions columns.
Auto aims for 4x revenue by F26 and 8x+ by F30 from ₹29k crore in F20, backed by 24.4% SUV revenue share, 32.3% eSUV share, exports up 50% and capacity rising from 64.5k to 132k per month by F31 exit.
Three columns: Momentum for scale, Growth Vectors and Proof Points, topped by an aspiration banner.
Farm targets 2x revenue by F26 and 3x+ by F30 from ₹21k crore in F20, supported by 43.4% tractor volume share, H1 exports up 16%, farm machinery at 25% CAGR and digital tools like DigiSense and Krish-e.
Same three-column layout as page 9 with an aspiration banner.
Financial Services aims for AUM growing from ₹65k crore in F20 to 4-5x by F30, with AUM up 15%, H1 PAT up 68%, GS3 at 3.42% and an insurance JV with Manulife.
Three-column layout with aspiration banner for the most trusted financial services provider for Bharat.
Trucks & Buses market share moved from 2% in F21 to 6% in F26 with a 10-12% target for F31, supported by the BLAZO i-TRK launch, 6.7% H1 F27 share and the SML-MTB merger with savings of ₹100 crore+.
Three-column layout with a market share trend chart.
Last Mile Mobility targets EV volumes of 25x the F20 base of 14k by F30, with 37.6% E-3W share, H1 E-3W volume up 57.5% and 26k+ UDO vehicles delivered.
Three-column layout with an EV volume growth chart.
Lifespaces targets residential pre-sales of 14x the F20 base of ₹0.7k crore by F30, with H1 pre-sales of ₹2k crore (+66%) and cumulative GDV above ₹50k crore.
Three-column layout with a pre-sales growth chart.
Aerospace targets deal wins of 50x the ₹200 crore F20 base by F30, with an order book of ₹11,500 crore, tripling capacity and an aspiration to be a top 10 global aerostructures supplier.
Three-column layout with a deal wins chart.
A scorecard of F20-F30 aspirations shows Auto, Farm, Financial Services, Trucks & Buses, Last Mile Mobility, Lifespaces and Aerospace all on track, from 3x+ Farm revenue to 50x Aerospace deal wins.
Table with business rows, aspiration multiples and green tick status.
A minimal statement slide lists four strengths: strong right to win, meaningful potential, market-leading returns and ability to execute.
Four centered lines on a white background with generous whitespace.
The recap repeats the key messages under a "Consistent profitable growth" banner to close the group overview section.
Bullet list with a bold banner at the bottom.
The section cover introduces the Q2 F27 Analyst and Investor Conference for the Automotive & Farm Sectors, presented by Rajesh Jejurikar, Executive Director & CEO, on 5 November 2026.
Full-bleed dark photo with left-aligned title and presenter block.
A section divider introduces the Farm Equipment business with the tagline "Transform Farming, Enrich Lives".
Full-bleed photo with overlaid title text.
Q2 tractor volume was 116k (-6% YoY) with 41.5% share, and H1 F27 volume was 274k (+7%) with 43.4% share, including Gromax.
Cream background with a 2x2 KPI grid and a laurel tractor icon.
Domestic tractor market share rose from 40.0% in F22 to 43.4% in H1 F27, peaking at 43.6%.
Single red line chart with labeled data points.
Farm machinery revenue grew from ₹253 crore in Q2 F25 to ₹330 crore in Q2 F26 (+30%) and ₹345 crore in Q2 F27 (+5%), including MITRA.
Three-bar chart with growth ovals.
Farm consolidated revenue of ₹9,572 crore delivered PBIT of ₹1,376 crore at 14.4%, with core tractor margin at 17.6% and the consolidated margin down only 130 bps YoY.
Segment sum table covering Core Tractor, International subsidiaries, Others and Farm Conso.
Core tractor PBIT margin was 18.7% in Q2 F25, 20.6% in Q2 F26 and 17.6% in Q2 F27, described as a sustained robust margin amid commodity price hikes.
Three-bar chart with margin labels and a message callout.
Industry growth swung between -9.9% and +34.8% while core tractor PBIT stayed in a 17-23% band from F19 to Q2 F27.
Dual line chart comparing industry growth with core tractor PBIT margin.
Farm consolidated revenue fell 6% to ₹9,572 crore, PBIT fell 14% to ₹1,376 crore and PAT fell 9% to ₹1,053 crore.
Three paired bar charts with decline callouts.
Exits from Sampo (Finland) and Erkunt Foundry (Turkey) are concluded and the MAM Japan restructuring is on plan, with losses expected to fall in F27 versus F26.
Three boxes with a chevron arrow toward the outcome.
Share was 6.0% in MAgNA below 110HP (industry -15%), 6.7% in Brazil below 120HP (industry -18%) and 6.3% for Erkunt in Turkey (industry -36%).
Three panel cards, each with a line chart of H1 F25-F27 trends.
The monsoon forecast fell from 92% to 87% of LPA between May and October 2026, reservoir storage moved from 19% to -16% versus normal, and yield risks and negative terms of trade weigh on the outlook.
Forecast table with supporting risk bullets.
A section divider introduces the Automotive Business with the tagline "Explore the Impossible".
Full-bleed photo with overlaid title text.
Q2 SUV volumes were 183K (+26%) with 24.3% revenue share (#1), and LCV below 3.5T volumes were 83K (+19%) with 52.3% volume share.
Cream background with a 2x2 KPI grid.
H1 SUV volume was 358K (+20%) with 24.4% revenue share, and LCV volume was 157K (+20%) with 52.5% share.
Cream background with a 2x2 KPI grid.
Quarterly SUV volumes grew from 136.0k in Q2 F25 to 183.4k in Q2 F27 and revenue share moved from 21.9% to 24.3%, with a peak of 27.1% in Q1 F26.
Two line charts, one for volume and one for share, with a ranking summary.
M&M's E-SUV penetration was 12.7% versus 11.0% for the industry, with 23.2% volume share, and excluding Vinfast and BYD the industry penetration was 10.0% and M&M share 25.7%.
Comparison tables with penetration and share figures.
Mahindra held 30.1% EV-UV revenue share in Q2 F27 (#2 behind OEM 1 at 32.7%) and 32.3% in H1 F27 (#1).
OEM ranking table with quarter and half-year columns.
Charge_IN operates 59 ultrafast charging stations covering about 12k km of highway, one every ~200 km, has dispensed about 4 million kWh and plans 250 stations by end of CY2027.
India map with station pins on a dark background plus key stats.
23,345 EVs were billed with 23.2% eSUV volume share, XEV 9S became India's highest-selling EV at 13,275 units, and BE 6 Sporteq launch brought bookings up 93%.
Numbered highlights list.
A promotional slide celebrates 100,000 electric SUVs sold since launch, featuring the XEV 9e, BE 6 and XEV 9S.
Full-bleed promotional image with milestone headline.
LCV below 3.5T volumes grew from 61.7k in Q2 F25 to 83.0k in Q2 F27 with 52.3% share, down 90 bps YoY.
Two line charts for volume and share.
Combined MTB and SML volumes rose from 6,139 in Q2 F26 to 8,416 in Q2 F27 (+37%), with MTB at 4,514 and SML at 3,902.
Stacked bar chart across three quarters.
The Naya Blazo i-TRK launch included one major plus 10+ city launches, 100+ customer meets, 350+ media articles and 65M+ social views.
Truck hero photo with a translucent text panel.
Truck and bus market share grew across all segments with a 5.9%, 5.6%, 5.8% trend through Q2 F27, and HCV capacity is fully utilised with expansion planned.
Line chart with supporting bullets.
Last Mile Mobility reached unicorn status valued at INR 10,822 crore, with E-3W share at 36.2%, Q2 volume up from 38,684 to 52,869 including 45,287 EVs, and L5 electrification at 41.4%.
Stacked bar chart on the left with bullets on the right.
A visual slide highlights India's No. 1 commercial EV brand with 400,000 EVs on the road.
Full-bleed vehicle lineup on a blue tunnel background with headline.
A recognition slide notes the 2026 Earthshot Prize finalist status in the Clean Our Air category, titled "From India's last mile to the world stage".
Full-bleed vehicle lineup with a recognition headline.
SUV and LCV PBIT margin was 10.2% in Q2 F25, 11.0% in Q2 F26 and 9.8% in Q2 F27 despite steep commodity inflation.
Three-bar chart with margin labels and a callout.
Auto consolidated revenue of ₹37,756 crore delivered PBIT of ₹3,319 crore at 8.8%, with SUV and LCV at 9.8%, BEV at 9.1% and the margin down only 50 bps YoY.
Segment sum table covering SUV & LCV, BEV, Others and Auto Conso.
Auto consolidated revenue rose 39% to ₹37,756 crore, PBIT rose 31% to ₹3,319 crore and PAT rose 55% to ₹2,388 crore.
Three paired bar charts with growth ovals.
A solid red section divider introduces the Capacity Unlock topic under the Way Forward theme.
Solid red full-bleed slide with large white title.
Auto capacity reached 68k per month in H1 F27 against 59k at F25 exit, with plans for 82k, an extra 10k NU_IQ at Chakan, a Nagpur greenfield and 2x capacity between F26 and F31.
Red-header capacity table with supporting bullets.
A solid red section divider introduces the Portfolio Expansion topic under the Way Forward theme.
Solid red full-bleed slide with large white title.
The Scorpio Lifestyler pickup, unveiled in August 2026, is showcased under the line "Built for a bigger world".
Full-bleed hero photo with headline.
The BE 6 Sporteq (launched 15 August 2026) and XUV 3XO ZNG (15 October 2026) are presented as refreshes to power growth.
Two side-by-side image panels with captions.
The Scorpio-N refresh (August 2026) and the Thar OG (September 2026) continue the product refresh story.
Two side-by-side image panels with captions.
The new Veero LCV, launched on 7 September 2026, is showcased under the line "Ab Mile Xtra Har Baar".
Full-bleed hero photo with headline.
Five big launches are planned by end of June 2027: one SUV on the new NU_IQ platform, one all-new BEV, the Lifestyler and one refresh, plus one new LCV.
Black background with veiled car images and a launch list.
The FY27 outlook expects a flattish tractor industry, mid-to-high-teen SUV growth for M&M with capacity on track, and double-digit industry growth for LCV below 3.5T.
Three-row outlook table.
The financials section cover introduces Amarjyoti Barua as presenter, dated 05 November 2026.
Full-bleed photo with title and presenter block.
The consolidated results repeat the headline figures of revenue ₹57,553 crore (+25%) and PAT ₹4,588 crore (+25%) for Q2, with YTD revenue ₹1,15,741 crore and PAT ₹10,042 crore.
Four-panel grid of paired bar charts.
Consolidated PAT rose from ₹3,673 crore to ₹4,588 crore (+25%), driven by Auto up ₹852 crore and offset by Investments down ₹226 crore from prior-year monetisation.
Business PAT table on the left with a waterfall chart on the right.
Standalone Q2 revenue rose 26% to ₹44,282 crore and PAT rose 13% to ₹5,102 crore, while YTD revenue rose 25% to ₹86,241 crore and PAT rose 10% to ₹8,787 crore.
Four-panel grid of paired bar charts.
H1 F27 cash flow for Standalone M&M, MEAL and LMM Co moved from ₹41,159 crore opening to ₹44,685 crore closing, with ₹7,446 crore net cash generation after capex of ₹5,196 crore and a dividend payout of ₹4,098 crore.
Financial table in a line-by-line cash flow format.
The closing slide thanks the audience on a dark background with red light streaks.
Centered thank-you text on a full-bleed dark background.
Pertanyaan umum tentang slide ini dan konten presentasi yang mendasarinya.
India's fiscal year FY27 runs from 1 April 2026 to 31 March 2027, so Q2 FY27 is July to September 2026 and H1 FY27 is April to September 2026. The deck writes fiscal years in the short form "F27".
It is Mahindra & Mahindra's Analyst & Press Meet deck for Q2 and H1 FY27, dated 5 November 2026, and was filed with the Indian stock exchanges BSE and NSE. The exchange cover letter has been removed from this version.
All amounts are in ₹ crore, written as "Rs cr." in the deck. One crore equals 10 million rupees, so ₹100 crore equals ₹1 billion. Indian digit grouping appears, for example ₹1,15,741 crore (about ₹1.16 lakh crore), and no currencies are converted.
Consolidated Q2 FY27 revenue rose 25% from ₹46,106 crore to ₹57,553 crore and PAT rose 25% from ₹3,673 crore to ₹4,588 crore. YTD revenue was ₹1,15,741 crore (+26%) and YTD PAT ₹10,042 crore (+29%), with H1 annualised RoE of 21%.
The Farm section (pages 20-30) covers tractor market share, farm machinery, core tractor margins, global subsidiary restructuring and the monsoon-driven outlook. The Auto section (pages 31-58) covers SUV, electric SUV, LCV, truck and bus and last mile mobility, margins, capacity expansion, new launches and the FY27 outlook.
Yes, both a PDF and a PPTX are provided, and the PPTX was converted from the PDF. Layout patterns such as 2x2 KPI grids, scorecards, red section dividers and PAT bridges are easy to adapt, though converted slides may need some clean-up of fonts and charts.
Content slides are on a white background with a red diagonal slash stripe at the top left and the mahindra Rise logo. Charts use navy and mid-blue bars, red lines and green growth ovals, and section dividers are full-bleed photos such as a highway at dawn, a tractor in a field and SUVs in a desert.

Create Your Own Slides
Turn your ideas into professional presentations in seconds with 2slides AI.
Referensikan desain profesional, pilih gaya Anda, dan hasilkan slide dengan rendering teks sempurna. Didukung oleh Nano Banana—mulai buat presentasi Anda sekarang.
Agen AI Anda untuk slide. Hemat waktu, bersinar lebih cepat dengan pembuatan presentasi yang cerdas.


© 2026 2slides. Hak cipta dilindungi.