
Bagian dari Contoh presentasi investor · Contoh presentasi investor semikonduktor
Intel Q3 2026 Earnings Presentation — the 16-slide deck Intel released on October 29, 2026 with CEO Lip-Bu Tan and CFO David Zinsner, covering third-quarter results (revenue $16.5B, up 20.9% YoY; non-GAAP gross margin 44.1%; non-GAAP EPS $0.52), segment trends for DCAI, CCPG and Intel Foundry, Q4 2026 guidance, and GAAP to non-GAAP reconciliations.
Menggunakan sampul presentasi ini sebagai referensi gaya untuk slide yang dibuat dari konten Anda sendiri. Atau pilih halaman mana pun di bawah untuk memakai tata letaknya sebagai referensi.
Navigasi Cepat
Tag
Bagikan slide
Intel Q3 2026 Earnings Presentation — the 16-slide deck Intel released on October 29, 2026 with CEO Lip-Bu Tan and CFO David Zinsner, covering third-quarter results (revenue $16.5B, up 20.9% YoY; non-GAAP gross margin 44.1%; non-GAAP EPS $0.52), segment trends for DCAI, CCPG and Intel Foundry, Q4 2026 guidance, and GAAP to non-GAAP reconciliations.
Tampilan detail setiap halaman slide, termasuk tata letak, konten utama dan elemen visual.
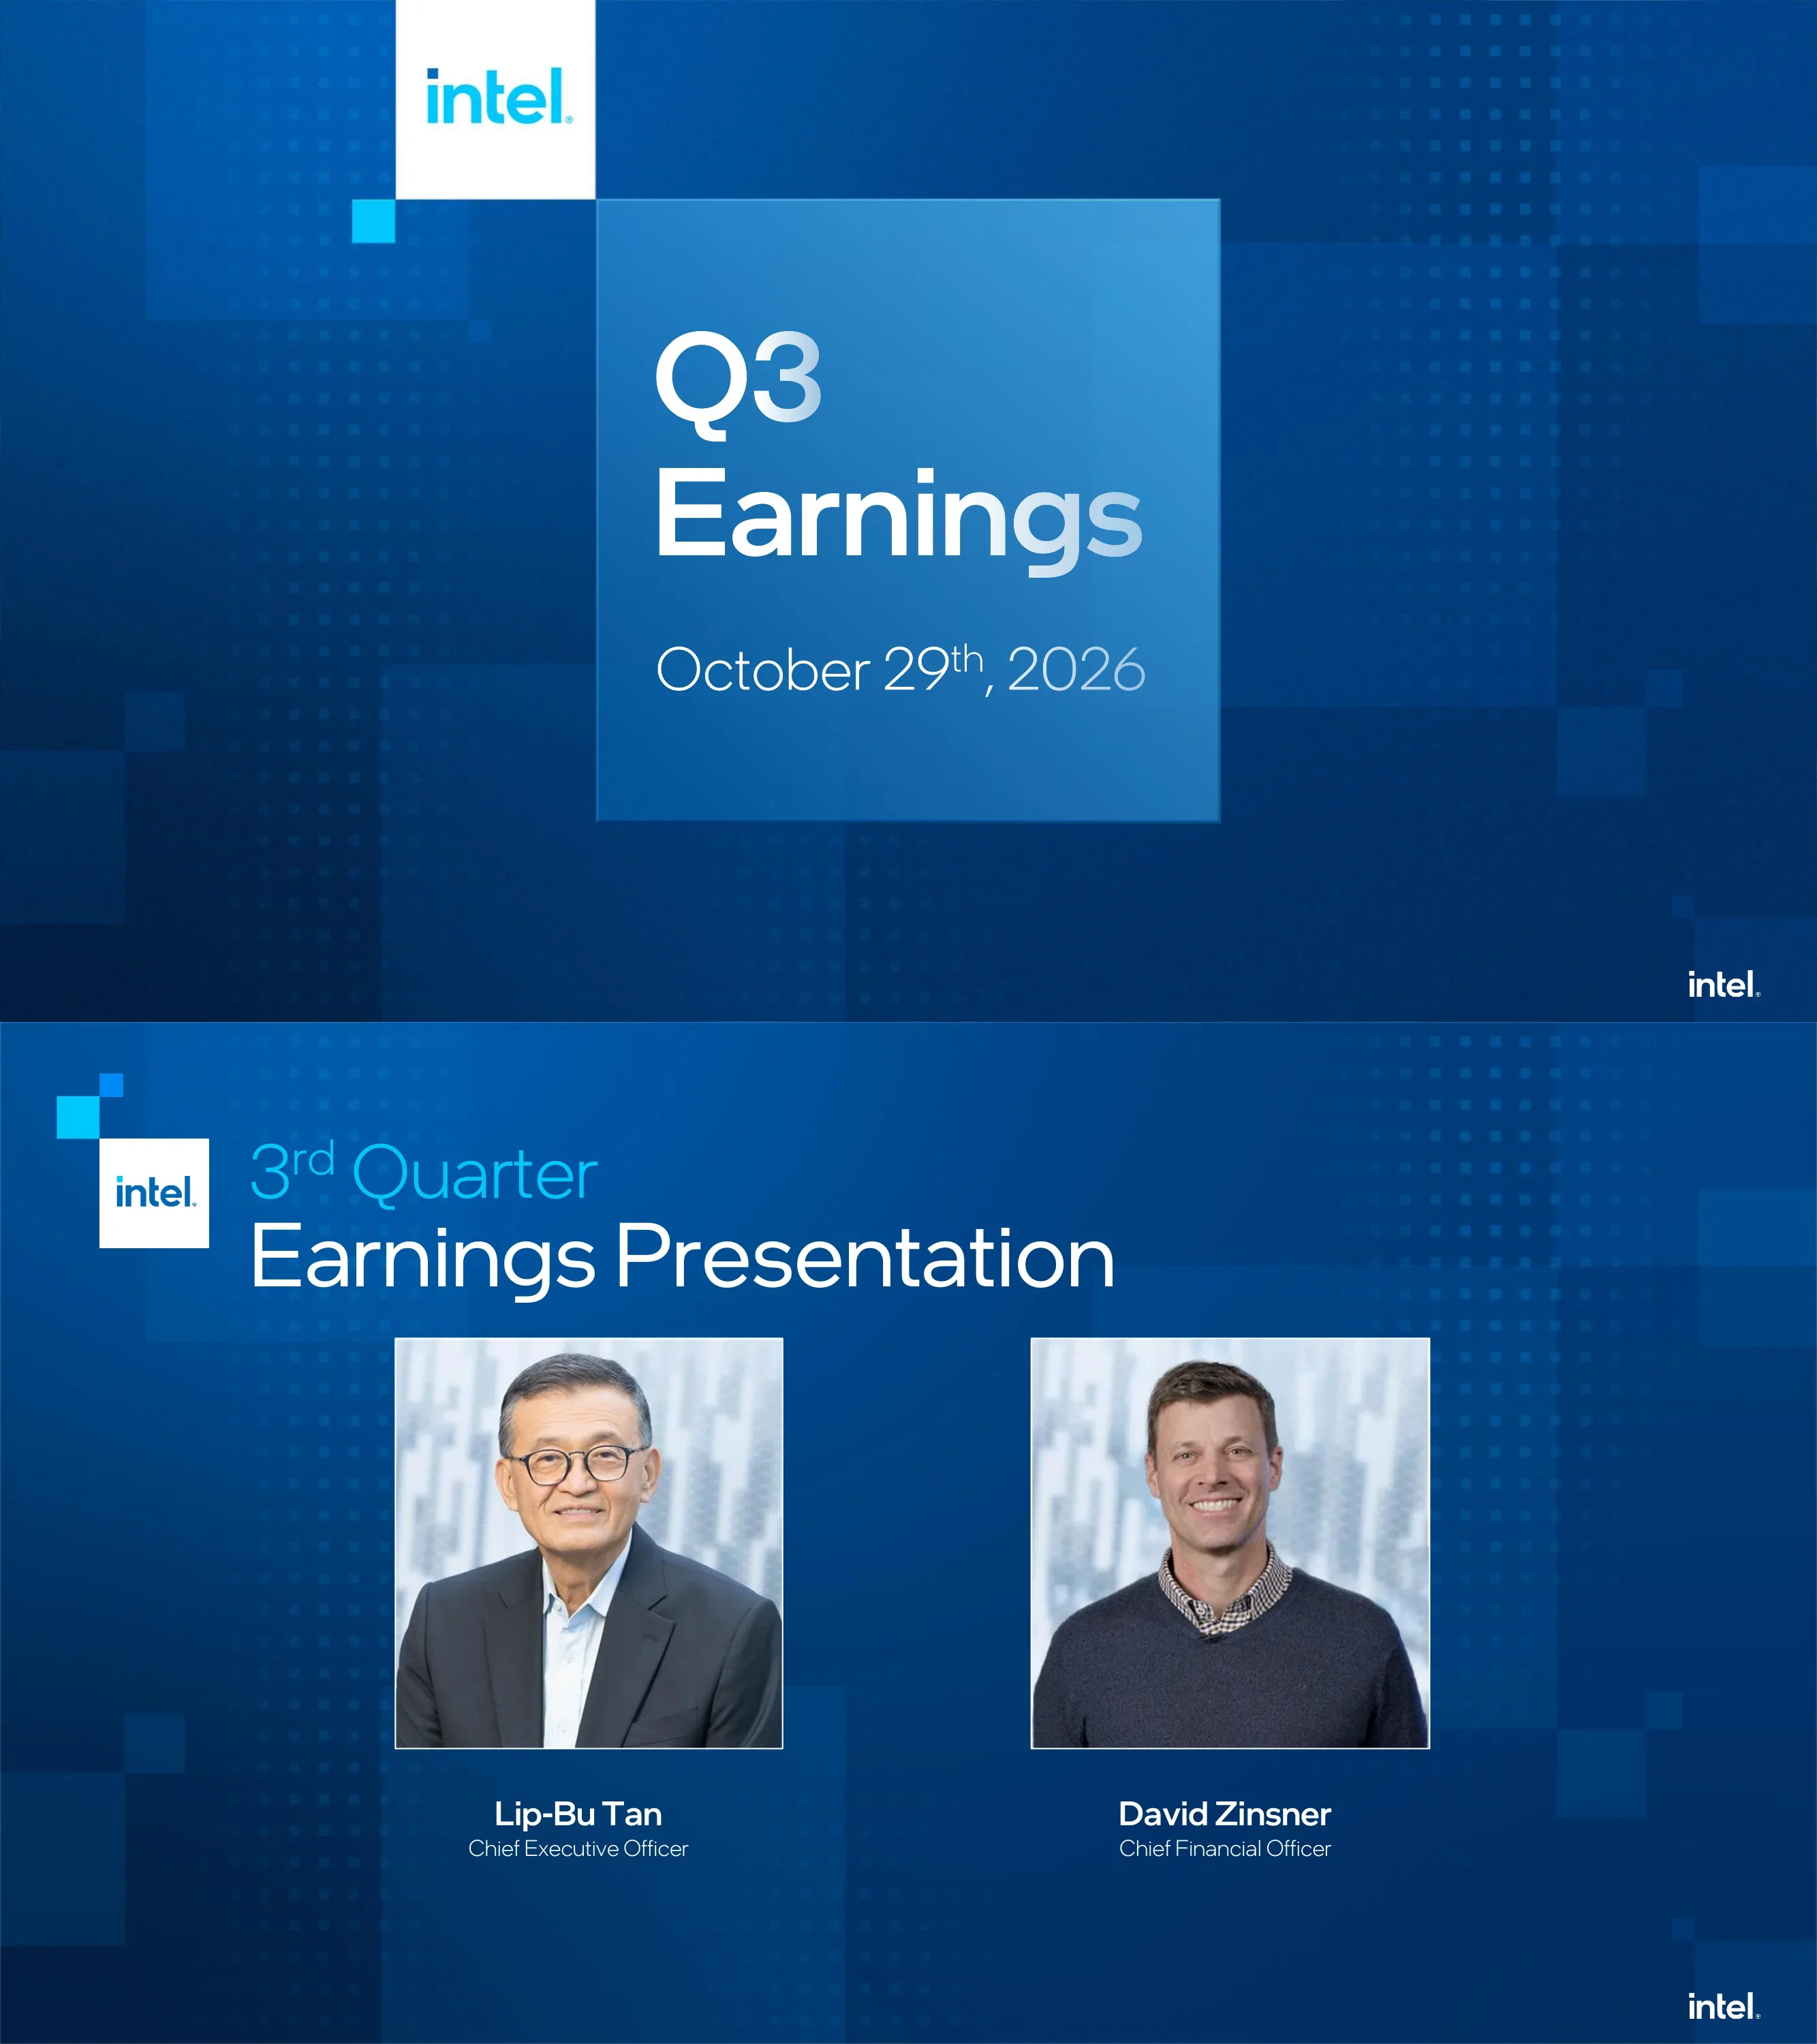
Cover slide announcing Intel's Q3 Earnings presentation dated October 29, 2026.
Full-bleed deep-blue background with a pixel-square texture; a white Intel logo tile at upper left and a large translucent blue square in the center holding the title and date; small Intel wordmark bottom right.
Introduces the two presenters: Lip-Bu Tan, Chief Executive Officer, and David Zinsner, Chief Financial Officer.
Two-line title at top left next to the Intel logo; two equally sized headshot photos side by side with name and title captions underneath.
Legal disclaimer explaining that gross margin, operating income, EPS and adjusted free cash flow are presented on a non-GAAP basis with reconciliations in the Appendix, and listing forward-looking statement risks including Intel 14A development, foundry customer wins, U.S. government equity ownership, tariffs and export controls, geopolitical tensions, and industry-wide substrate and memory shortages.
Centered title over a single translucent blue panel containing four dense justified bullet paragraphs.
Four takeaways: agentic AI is driving sustainable server CPU demand (record Q3 DCAI growth, improving roadmap, investing to secure supply); the PC market is challenged by memory shortages but the long-term outlook is positive across agentic systems, edge and physical AI; Intel Foundry execution is improving (Intel 3 and 18A yields, 18A-P in Q4, 14A 0.9 PDK, EMIB-T yield, reliability and supply); and significant value-creation opportunities lie ahead in the x86 franchise, purpose-built silicon (PBS), advanced packaging and wafer foundry.
Centered title; photo of the Intel headquarters sign on the left third; four stacked horizontal banner boxes on the right, each with a bold headline and a one-line subtitle.
Q3 2026 revenue of $16.5B, up 20.9% YoY and $0.2B above the July outlook midpoint; non-GAAP gross margin 44.1%, up 4.1 points YoY and 2.1 points above outlook; non-GAAP EPS $0.52, up $0.29 YoY and $0.14 above outlook. Footnote: GAAP gross margin 43.0% (up 4.8 points YoY) and GAAP EPS $0.60 (down $0.30 YoY).
Three equal KPI tiles in a row, each with a very large figure, metric label, bold YoY change and a comparison to the July outlook; footnotes along the bottom.
Five-quarter trend: revenue $13.7B (Q3'25), $13.7B (Q4'25), $13.6B (Q1'26), $16.1B (Q2'26), $16.5B (Q3'26); non-GAAP gross margin 40.0%, 37.9%, 41.0%, 41.8%, 44.1%; non-GAAP operating income $1.5B, $1.2B, $1.7B, $2.8B, $3.2B. Commentary: server CPUs are foundational to AI infrastructure, disciplined execution let server output exceed expectations, and Intel is investing aggressively and prudently to capture growth. Footnotes give GAAP gross margins (38.2%, 36.1%, 39.4%, 40.4%, 43.0%) and GAAP operating income ($0.7B, $0.6B, -$3.1B, $1.8B, $2.5B).
Large Intel wordmark header; left two-thirds is a stacked bar chart with revenue labels on top, operating income in the lighter base segment and a white gross-margin line across; right third is a dark commentary panel with three statements above a headquarters photo.
DCAI segment revenue rose from $4.1B (Q3'25) to $4.7B, $5.1B, $6.3B and $7.3B (Q3'26); operating income rose from $1.0B to $1.3B, $1.5B, $2.5B and $3.0B; operating margin expanded from 23.4% to 26.4%, 30.5%, 39.5% and 41.5%. Commentary: strong demand across hyperscale, enterprise and neo clouds; purpose-built silicon revenue more than doubled YoY; agentic workloads are driving increased customer interest across the product roadmap.
Same chart-plus-panel template as the company slide: 'intel DCAI' header, stacked bar chart with margin line on the left, three-point commentary and a data center corridor photo on the right.
CCPG segment revenue was $8.5B (Q3'25), $8.2B, $7.7B, $8.9B and $8.1B (Q3'26); operating income $2.7B, $2.2B, $2.5B, $2.3B and $2.3B; operating margin 31.6%, 27.0%, 32.6%, 26.4% and 28.2%. Commentary: industry-wide memory shortages are impacting the PC TAM, demand is strong for Wildcat Lake built on 18A, and AI PC continued to grow YoY.
'intel CCPG' header; stacked bar chart with operating margin line on the left; commentary panel and photo of engineers at monitors on the right.
Intel Foundry revenue grew from $4.2B (Q3'25) to $4.5B, $5.4B, $5.8B and $6.7B (Q3'26), while operating losses narrowed from -$2.3B and -$2.5B to -$2.4B, -$2.1B and -$1.9B; operating margin improved from -54.8% and -55.7% to -45.0%, -36.2% and -27.7%. Commentary: improved yield and cycle times are reducing wafer costs, Intel 14A is progressing with the 0.9 PDK released as committed, and expansion is accelerating across all sites including Ohio.
'intel foundry' header; bar chart with revenue above a zero baseline and operating losses below it, plus a rising margin line; commentary panel with a photo of a technician holding a wafer.
Section divider introducing the outlook portion of the presentation.
Single centered word on the plain blue pixel-texture background.
Q4 2026 guidance: revenue of $15.0–16.0B, up $1.8B YoY at the midpoint; non-GAAP gross margin of 38.0%, up 0.1 point YoY; non-GAAP EPS of $0.25, up $0.10 YoY. Footnotes note the figures are based on the revenue midpoint and reconciled in the Appendix.
Three KPI tiles mirroring the Q3 highlights slide, each with a large guidance number, metric label and YoY change; footnotes at bottom.
Transition slide opening the question-and-answer session of the earnings call.
Mirrors the cover: Intel logo tile at upper left and a central translucent blue square with 'Q&A'.
Section divider introducing the appendix of financial reconciliations.
Single centered word on the blue pixel-texture background.
Five-quarter reconciliation table: GAAP gross margin 38.2%/36.1%/39.4%/40.4%/43.0% plus acquisition-related and share-based compensation adjustments gives non-GAAP 40.0%/37.9%/41.0%/41.8%/44.1%; GAAP operating income $0.7B/$0.6B/($3.1B)/$1.8B/$2.5B to non-GAAP $1.5B/$1.2B/$1.7B/$2.8B/$3.2B, with Q1'26 including $4.1B of restructuring and other charges. EPS bridge for Q3'25 and Q3'26: GAAP $0.90 to non-GAAP $0.23 (including a $1.20 divestiture gain) and GAAP $0.60 to non-GAAP $0.52 (including a $0.17 mark-to-market gain on Escrowed Shares tied to the CHIPS Act Secure Enclave agreement). Non-GAAP tax rates are 11% for 2026 and 12% for 2025.
Two-line title over a large financial table with five quarterly columns, indented adjustment rows and underlined subtotals; footnotes beneath.
Reconciles Q4 2026 outlook to Q4 2025 actuals: GAAP gross margin of approximately 37.1% becomes 38.0% non-GAAP (vs. 36.1% to 37.9% a year earlier); GAAP EPS of $0.10 becomes $0.25 non-GAAP after $0.11 of share-based compensation and $0.04 of income tax effects (vs. GAAP -$0.12 to non-GAAP $0.15 in Q4 2025).
Two-line title over a centered table with two value columns (Q4 2026 Outlook, Q4 2025 Actuals) and footnotes at the bottom.
Q3 2026 adjusted free cash flow of $1.6B: $5.1B GAAP operating cash flow less $4.2B gross capital expenditures, plus $0.8B net partner contributions, less $0.1B finance lease payments, with no capital-related government incentive proceeds in the quarter.
Wide single-line title over a centered panel holding a short single-column reconciliation table.
Pertanyaan umum tentang slide ini dan konten presentasi yang mendasarinya.
According to the deck, Intel reported Q3 2026 revenue of $16.5B (up 20.9% year over year and $0.2B above the July outlook midpoint), non-GAAP gross margin of 44.1% (43.0% GAAP) and non-GAAP EPS of $0.52 (GAAP EPS $0.60). Non-GAAP operating income was $3.2B and adjusted free cash flow was $1.6B.
Intel guided Q4 2026 revenue to $15.0–16.0B, non-GAAP gross margin to about 38.0% (37.1% GAAP) and non-GAAP EPS to $0.25 (GAAP EPS $0.10), all based on the midpoint of the revenue range.
Data Center and AI (DCAI) had a record quarter with $7.3B revenue, $3.0B operating income and a 41.5% operating margin. Client Computing (CCPG) delivered $8.1B revenue and a 28.2% margin despite memory shortages. Intel Foundry grew revenue to $6.7B while its operating loss narrowed to $1.9B (-27.7% margin).
The presentation lists CEO Lip-Bu Tan and CFO David Zinsner as the speakers for the October 29, 2026 earnings call.
It is Intel's official Q3 2026 earnings deck, published on Intel's investor relations website alongside the earnings release dated October 29, 2026. Intel is listed on the Nasdaq.
Yes. The page offers the original PDF and an editable PPTX converted from it, so you can reuse the KPI tiles, chart-plus-commentary layout and reconciliation tables in your own earnings presentation.
It is a compact, well-structured example: cover, speakers, disclaimer, executive summary, three-tile financial highlights, one trend slide per segment, outlook, Q&A and an appendix of GAAP to non-GAAP reconciliations — a sequence most public companies can follow.
Intel presents gross margin, operating income, EPS and adjusted free cash flow on a non-GAAP basis to exclude items like acquisition-related adjustments, share-based compensation, restructuring charges and gains on investments or Escrowed Shares. The appendix slides reconcile each measure to its GAAP equivalent.
Original presentation file hosted by Intel's investor relations site.
Earnings releases, webcasts and SEC filings.

Create Your Own Slides
Turn your ideas into professional presentations in seconds with 2slides AI.
Referensikan desain profesional, pilih gaya Anda, dan hasilkan slide dengan rendering teks sempurna. Didukung oleh Nano Banana—mulai buat presentasi Anda sekarang.
Agen AI Anda untuk slide. Hemat waktu, bersinar lebih cepat dengan pembuatan presentasi yang cerdas.


© 2026 2slides. Hak cipta dilindungi.