
Bagian dari Contoh presentasi investor · Contoh presentasi investor India
Hindustan Unilever Q2 FY27 Earnings Presentation (SQ'26 Results, 28 October 2026) — a 17-page results deck from Hindustan Unilever Limited (HUL), filed with BSE/NSE, covering the September quarter 2026 (Q2 of India's FY27, which runs April 2026 to March 2027): turnover of ₹18,071 crore, 15% underlying sales growth (USG), 7% underlying volume growth (UVG), 9% PAT (bei) growth, the WINI ('Winning In New India') strategy, segment results for Home Care, Beauty & Wellbeing, Personal Care and Foods, first-half FY27 totals and a mid-term outlook with a 22-24% EBITDA margin guide. Amounts are in Indian rupees, mostly ₹ crore (cr.).
Menggunakan sampul presentasi ini sebagai referensi gaya untuk slide yang dibuat dari konten Anda sendiri. Atau pilih halaman mana pun di bawah untuk memakai tata letaknya sebagai referensi.
Navigasi Cepat
Tag
Bagikan slide
Hindustan Unilever Q2 FY27 Earnings Presentation (SQ'26 Results, 28 October 2026) — a 17-page results deck from Hindustan Unilever Limited (HUL), filed with BSE/NSE, covering the September quarter 2026 (Q2 of India's FY27, which runs April 2026 to March 2027): turnover of ₹18,071 crore, 15% underlying sales growth (USG), 7% underlying volume growth (UVG), 9% PAT (bei) growth, the WINI ('Winning In New India') strategy, segment results for Home Care, Beauty & Wellbeing, Personal Care and Foods, first-half FY27 totals and a mid-term outlook with a 22-24% EBITDA margin guide. Amounts are in Indian rupees, mostly ₹ crore (cr.).
Tampilan detail setiap halaman slide, termasuk tata letak, konten utama dan elemen visual.
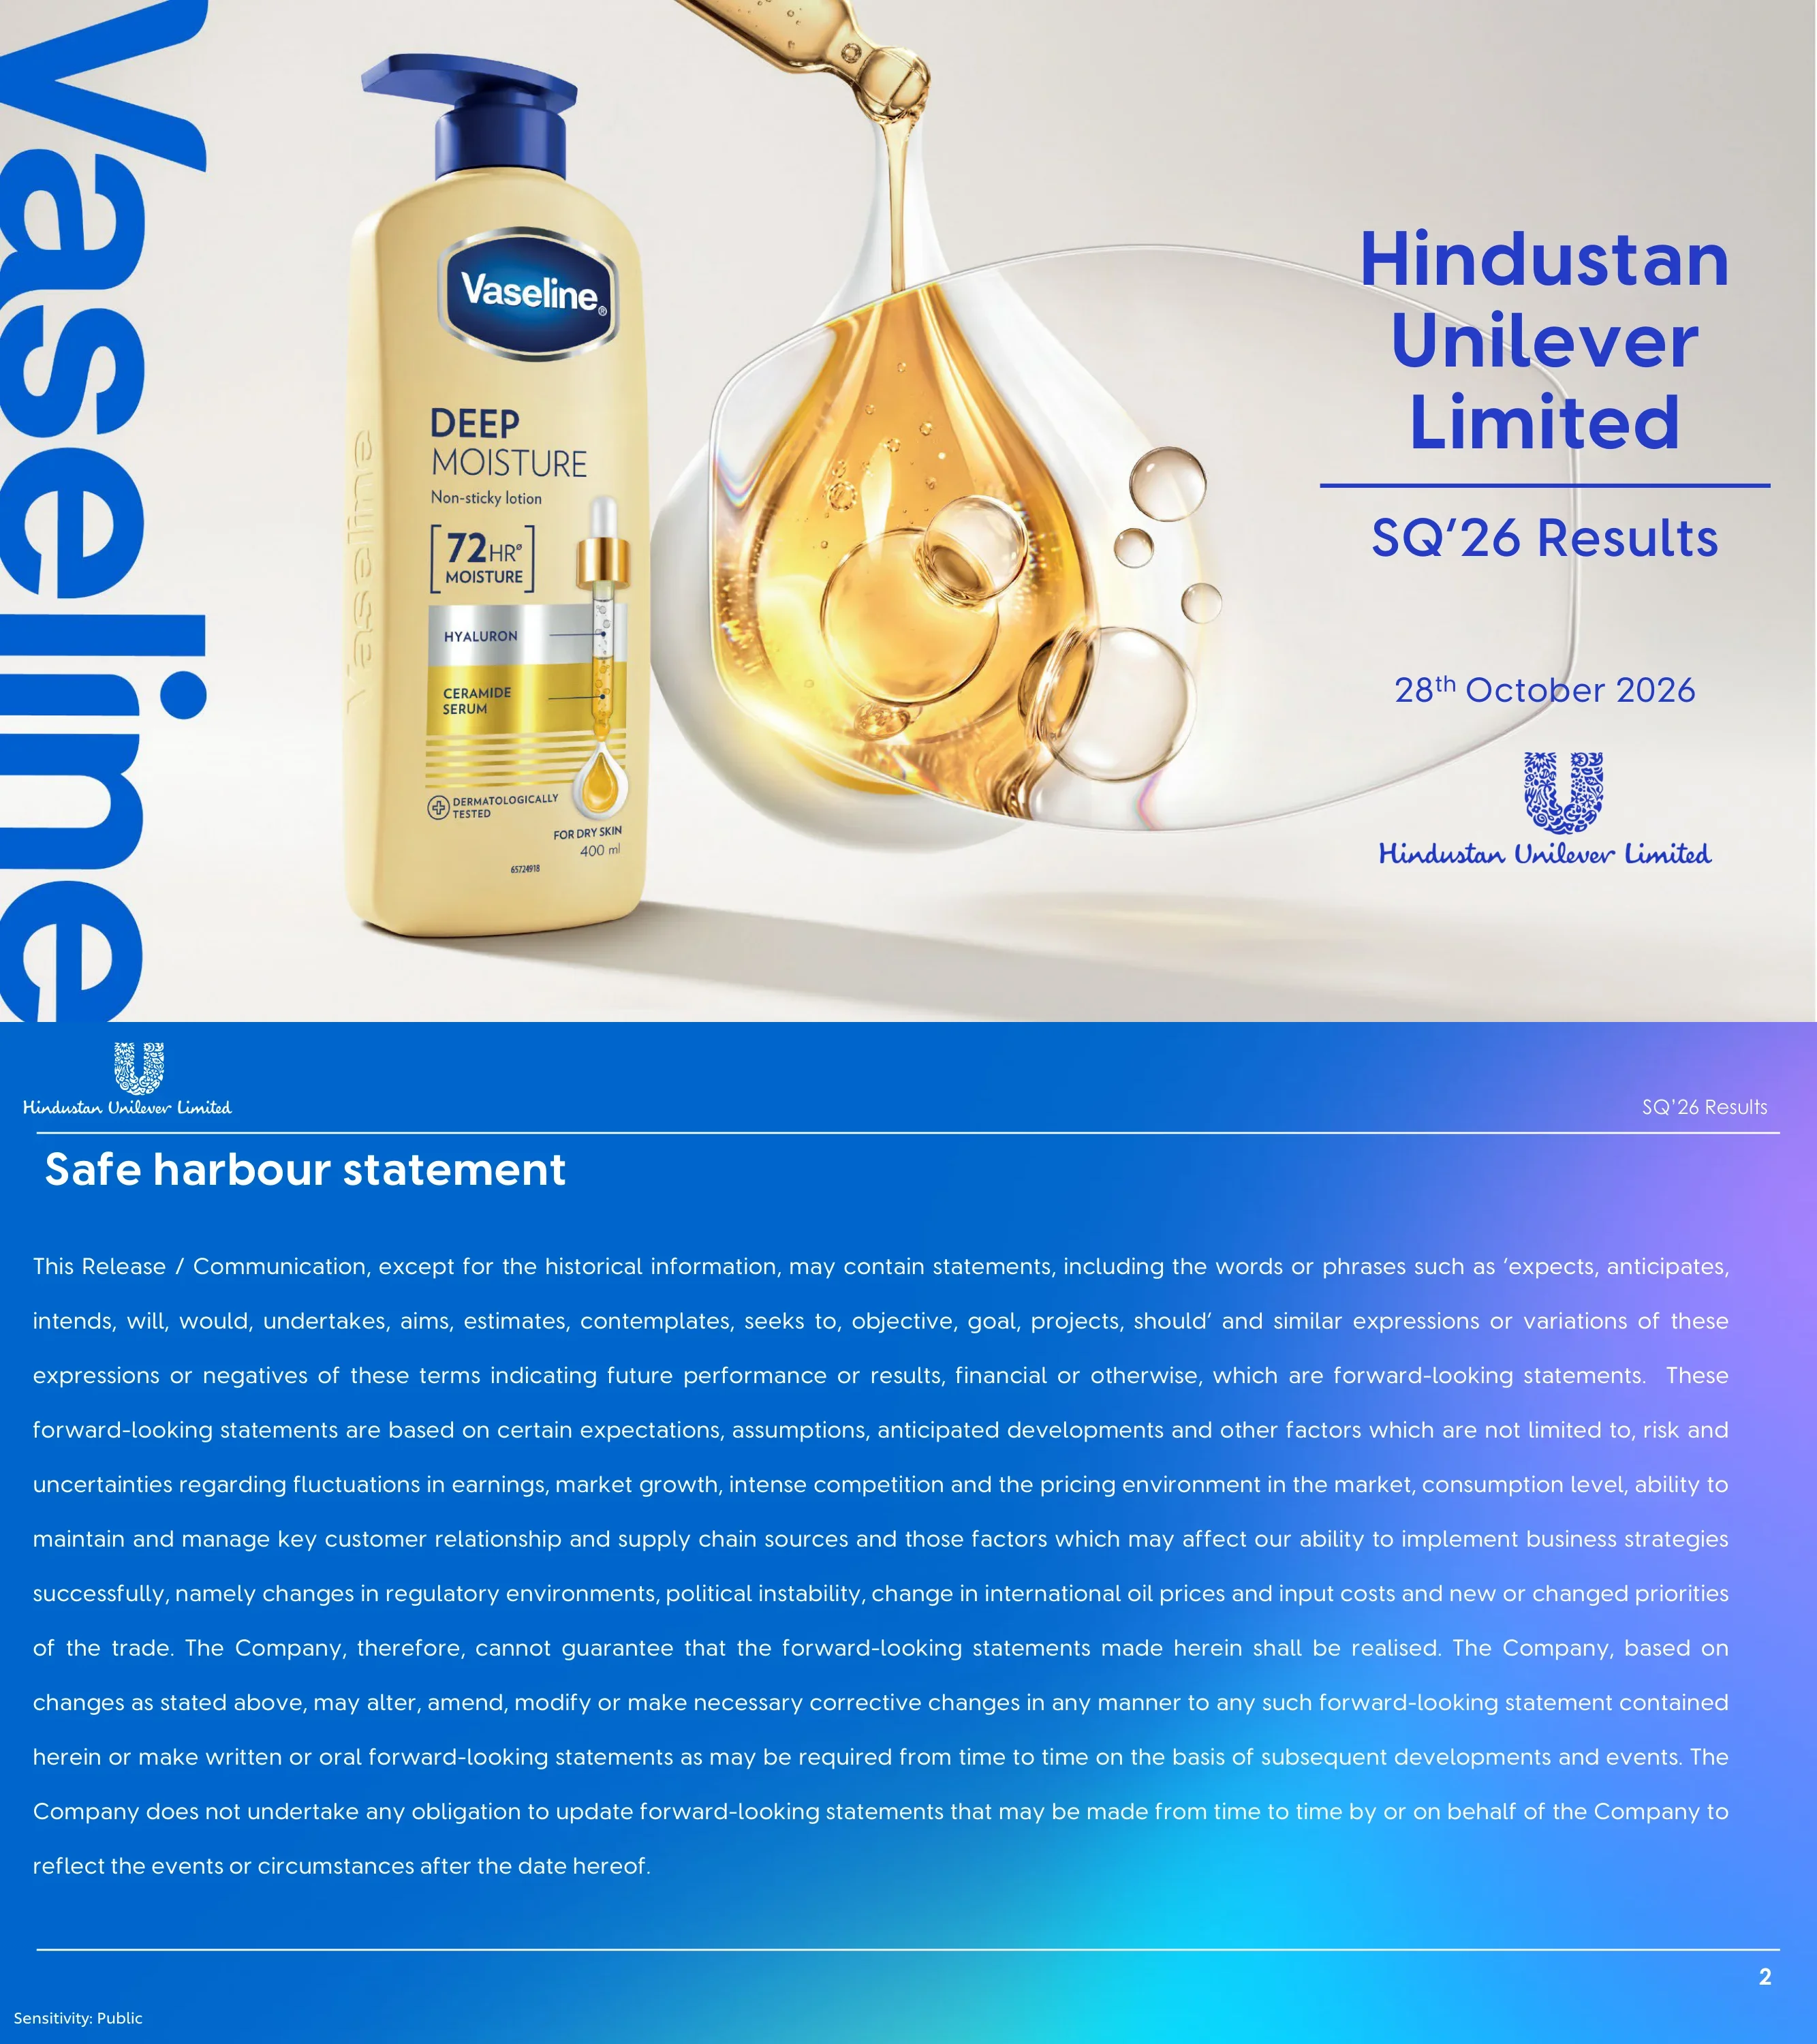
Title slide naming Hindustan Unilever Limited and 'SQ'26 Results' (the September quarter 2026, i.e. Q2 FY27), dated 28th October 2026, with the Hindustan Unilever Limited logo and script wordmark.
Full-bleed product photograph on a warm off-white background: a giant vertical blue 'Vaseline' wordmark runs down the left edge, a Vaseline Deep Moisture lotion bottle and a golden serum droplet inside a glass shape fill the centre, and the blue title block sits on the right separated by a thin rule.
Standard forward-looking statements disclaimer: words such as expects, anticipates, intends and estimates indicate forward-looking statements subject to risks including earnings fluctuations, market growth, competition and pricing, consumption levels, supply chain, regulatory changes, political instability and international oil prices and input costs; the company does not undertake to update them.
Single full-width paragraph of white justified text on the deck's signature blue-to-violet-to-cyan gradient background, with the HUL logo top-left, 'SQ'26 Results' top-right, thin white rules framing the content and a 'Sensitivity: Public' footer.
Section opener introducing Priya Nair, Chief Executive Officer and Managing Director, who presents the operating context, headline performance and strategy section.
Reuses the Vaseline cover artwork with the speaker's name in large blue type, a horizontal rule and her title beneath, and the HUL logo at bottom right.
Three-part summary of the quarter's environment: Geopolitical environment — elevated commodity prices; Resilient Indian economy — macro indicators intact; Consumption trend — positive demand conditions.
Three equal dark-blue cards with cyan top bars, each with a heading, an illustrative photo (cargo ship and oil barrels against a world map; Indian city skyline with metro and logistics; shoppers in a supermarket aisle) and a one-line takeaway; footnote notes synthetic human images were created with generative AI.
Quarter headline KPIs: Turnover ₹18,071 cr., USG 15%, UVG 7% and PAT (bei) growth 9%; 'Broad-based Underlying Sales Growth across segments' with Home Care 22%, Beauty & Wellbeing 16%, Personal Care 9% and Foods 9%. Footnotes define USG (turnover growth excluding acquisitions and disposals), UVG (volume growth including mix of turnover realisation) and PAT (bei) (profit after tax before exceptional items).
Top row of four navy KPI tiles separated by cyan vertical bars, each with a label, white rule and large number; below, a full-width banner headline over a four-column segment strip divided by white vertical lines.
First-half FY27 (April–September 2026) results: Turnover ₹35,255 cr., USG 12%, UVG 6%, PAT (bei) growth 9%, and an interim dividend of ₹19 per share.
Four tall navy columns with header labels and cyan separators holding large white figures, plus a full-width rounded banner announcing the interim dividend; same metric-definition footnotes as page 5.
Strategy house to 'Deliver competitive volume-led growth' through four vectors — Consumption (more usage) and Premiumisation (more benefits) together 40% delta, Market Making (more users) 40% delta, New Spaces (more categories) 20% delta, where delta is incremental turnover contribution; enablers are Crafting Desirable Brands, Future-fit Go-to-Market and AI as a Moat; the value creation model runs Generate Fuel for Growth → Deploy Fuel for Growth → Step-up Capital for Growth → Deliver Volume-led Profit Growth, all underpinned by talent, culture and ESG.
Stacked framework: a 'WINI' letter collage of Indian lifestyle photos at top, then a gold gradient banner, four pale pillar cards with gold sub-labels, sage-green delta bars, a gold 'Enablers' banner with three icon cells, a gold 'Value creation model' banner with four icon steps linked by chevrons, and a navy foundation bar.
Four execution proof points illustrated with brand visuals: Crafting desirable brands (Simple skin care — 'Repairs Sensitive Skin Barrier from 1st use'), Building future-fit Go-to-Market (a Vaseline in-store shelf display), Entering new demand spaces (Horlicks Protein, 24 g protein) and Winning in volatile environment (an automated bottling line in a factory).
Four equal vertical columns, each with a two-line heading on a navy header block, a cyan bar and a tall portrait image beneath; generative-AI image disclosure in the footer.
Section opener introducing Niranjan Gupta, Chief Financial Officer, who presents the consolidated results, profit growth bridge and segment detail.
Full-bleed Comfort fabric conditioner campaign image — a woman in a flowing blue dress against blue sky and pink peonies holding a Comfort Morning Fresh bottle, with a giant vertical white 'Comfort' wordmark on the right; speaker name, title and HUL logo in blue on the left.
Consolidated quarter results: Topline — USG 15% and UVG 7%; EBITDA margin 22.6%, a change of -140 bps YoY; EBITDA ₹4,089 cr., growth 8% YoY; PAT (bei) ₹2,795 cr., growth 9% YoY.
Four tall navy cards with header labels (Topline, EBITDA Margin, EBITDA, PAT (bei)) over cyan bars, each showing a sub-label, a primary figure, a white rule, a secondary figure and a bottom caption; standard metric-definition footnotes.
Left panel 'Executing with discipline' lists 01 Calibrated pricing actions, 02 Accelerated savings and 03 A&P spends productivity (illustrated by a 'Sangam' graphic). Right panel 'Sequential step-up in revenue and profit growth' shows USG of 3% (FH FY'26), 6% (SH FY'26) and 12% (FH FY'27) with PAT (bei) growth of -2%, 2% and 9% respectively. Banner: 'Focused on protecting consumer franchise'.
Two side-by-side rounded navy panels: a three-column numbered list with cyan numerals and photos on the left, a white-bar column chart with outlined PAT growth boxes above each bar on the right, and a full-width banner beneath.
Home Care delivered USG of 22% with double-digit UVG. Fabric Wash grew strongly double-digit across liquids, powders and bars, with all brands contributing and the Surf excel Easy Wash ₹99 pack driving premiumisation in powders; Household Care accelerated to double-digit, volume-driven USG with Vim Liquids outperforming; focused market development in liquids expanded penetration and strengthened market leadership.
Segment template: title with revenue and margin subtitle, two navy pill boxes for USG and UVG, three checkbox bullets of commentary on the left two-thirds and large Surf excel Easy Wash and Surf excel Matic Top Load pack shots on the right; footnotes define segment revenue and segment margin (EBIT, excluding exceptional items).
Beauty & Wellbeing posted USG of 16% with double-digit UVG. Hair Care accelerated its double-digit, volume-led growth with Premium Hair Care and innovations outperforming; Skin Care and Colour Cosmetics delivered double-digit, volume-led growth with Premium Skin Care on trajectory and Minimalist accelerating through innovations; Health & Wellbeing saw subdued performance in OZiva, though category fundamentals remain healthy and an innovation funnel is in place.
Same segment template with USG and UVG pills, three checkbox bullets and a TRESemmé Hydra Matrix serum, conditioner and shampoo trio on the right.
Personal Care reported USG of 9% with flat UVG. Skin Cleansing delivered double-digit growth driven by pricing actions in an inflationary environment; market development in Pears and Dove bars supported double-digit, volume-led growth, and bodywash strengthened penetration and leadership via sampling and in-store activations; Oral Care reported low-single-digit growth while premium innovations kept double-digit growth.
Segment template with USG and UVG pills, three checkbox bullets and Dove Exfoliate Away and Dove nourishing bodywash bottles on the right.
Foods posted USG of 9% with low-single-digit UVG. Beverages: coffee delivered high-single-digit volume-driven growth while inflation moderated tea, led by softer mass tea, with premium tea innovations scaling well; Lifestyle Nutrition accelerated double-digit momentum, with Horlicks Biscuits and Ready-To-Drink growing well and newly launched Horlicks Protein gaining traction; Packaged Foods delivered double-digit, broad-based growth and Kissan condiments were relaunched with contemporary packaging.
Segment template with USG and UVG pills, three checkbox bullets and Horlicks Super Foods jar and pouch pack shots on the right.
Demand: the underlying demand environment remains resilient, supported by healthy macro indicators, and FY'27 is expected to be better than FY'26, driven by portfolio and channel transformation. Margin: commodity inflation is expected to continue in the short term, and consolidated EBITDA margin is expected to be within the current guided range of 22-24%. Focus: driving competitive, volume-led profit growth anchored to the WINI strategy.
One large navy panel with a cyan top bar containing three rows, each led by a striped cyan arrow icon, a bold heading (Demand, Margin, Focus) and diamond-bulleted statements.
Closing slide repeating the cover: Hindustan Unilever Limited, SQ'26 Results, 28th October 2026, with the HUL logo.
Identical to the cover — Vaseline vertical wordmark, lotion bottle and golden serum droplet on the left and centre, blue title block on the right.
Pertanyaan umum tentang slide ini dan konten presentasi yang mendasarinya.
It is HUL's 17-page 'SQ'26 Results' deck dated 28 October 2026, covering the September 2026 quarter: turnover of ₹18,071 crore, 15% underlying sales growth, 7% underlying volume growth, 9% PAT (bei) growth, consolidated EBITDA of ₹4,089 crore at a 22.6% margin, segment results for Home Care, Beauty & Wellbeing, Personal Care and Foods, the WINI strategy and a mid-term outlook.
SQ'26 is HUL's label for the September quarter of calendar 2026. Indian companies report on an April–March financial year, so FY27 runs from April 2026 to March 2027; the September quarter is Q2 FY27, and 'FH FY'27' on page 6 means the first half, April to September 2026.
Hindustan Unilever (HINDUNILVR) filed the presentation with BSE/NSE as part of its quarterly results disclosure. All amounts are in Indian rupees, mostly in ₹ crore (cr.), where one crore is 10 million rupees. The original BSE filing's cover-letter pages have been removed here, leaving the 17 presentation slides.
Home Care: ₹6,878 cr. revenue, 16% margin, USG 22%, double-digit UVG. Beauty & Wellbeing: ₹4,319 cr., 29% margin, USG 16%, double-digit UVG. Personal Care: ₹2,617 cr., 17% margin, USG 9%, flat UVG. Foods: ₹3,849 cr., 22% margin, USG 9%, low-single-digit UVG.
The mid-term outlook slide says demand remains resilient and FY'27 is expected to be better than FY'26, commodity inflation is expected to continue in the short term, and consolidated EBITDA margin should stay within the guided range of 22-24%. The company also declared an interim dividend of ₹19 per share for the first half.
As defined in the deck's footnotes, Underlying Sales Growth (USG) is turnover growth excluding acquisitions and disposals; Underlying Volume Growth (UVG) is volume growth including the mix impact of turnover realisation; PAT (bei) is profit after tax before exceptional items.
Yes. The page offers the original PDF plus a PPTX version converted from it, so you can reuse the KPI tile layouts, segment page template, WINI strategy house and outlook slide. Because the PPTX is machine-converted, some text boxes and images may need adjusting.
It is a strong reference: a consistent blue gradient theme, large-number KPI tiles, a repeatable segment template with revenue, margin and growth pills plus product pack shots, and brand-campaign section dividers. Swap in your own brands and figures to build a quarterly results deck quickly.
Original filing of this presentation with BSE, including the cover letter pages removed from this gallery version.

Create Your Own Slides
Turn your ideas into professional presentations in seconds with 2slides AI.
Referensikan desain profesional, pilih gaya Anda, dan hasilkan slide dengan rendering teks sempurna. Didukung oleh Nano Banana—mulai buat presentasi Anda sekarang.
Agen AI Anda untuk slide. Hemat waktu, bersinar lebih cepat dengan pembuatan presentasi yang cerdas.


© 2026 2slides. Hak cipta dilindungi.