
Bagian dari Contoh presentasi investor · Contoh presentasi investor Jepang
Haseko H1 FY2026 Earnings Presentation — Haseko Corporation's first-half (April–September 2026) results for the fiscal year ending March 2027, showing record-high consolidated sales, operating profit and ordinary profit for a first half, with sales of ¥6,023 (100 million yen units, 億円) and ordinary profit of ¥543 (+37.9%), standalone orders of ¥3,839 and an unchanged full-year forecast. This is a Japanese-language deck whose original was published on TDnet (the Tokyo Stock Exchange's Timely Disclosure network), dated 12 November 2026.
Menggunakan sampul presentasi ini sebagai referensi gaya untuk slide yang dibuat dari konten Anda sendiri. Atau pilih halaman mana pun di bawah untuk memakai tata letaknya sebagai referensi.
Navigasi Cepat
Tag
Bagikan slide
Haseko H1 FY2026 Earnings Presentation — Haseko Corporation's first-half (April–September 2026) results for the fiscal year ending March 2027, showing record-high consolidated sales, operating profit and ordinary profit for a first half, with sales of ¥6,023 (100 million yen units, 億円) and ordinary profit of ¥543 (+37.9%), standalone orders of ¥3,839 and an unchanged full-year forecast. This is a Japanese-language deck whose original was published on TDnet (the Tokyo Stock Exchange's Timely Disclosure network), dated 12 November 2026.
Tampilan detail setiap halaman slide, termasuk tata letak, konten utama dan elemen visual.
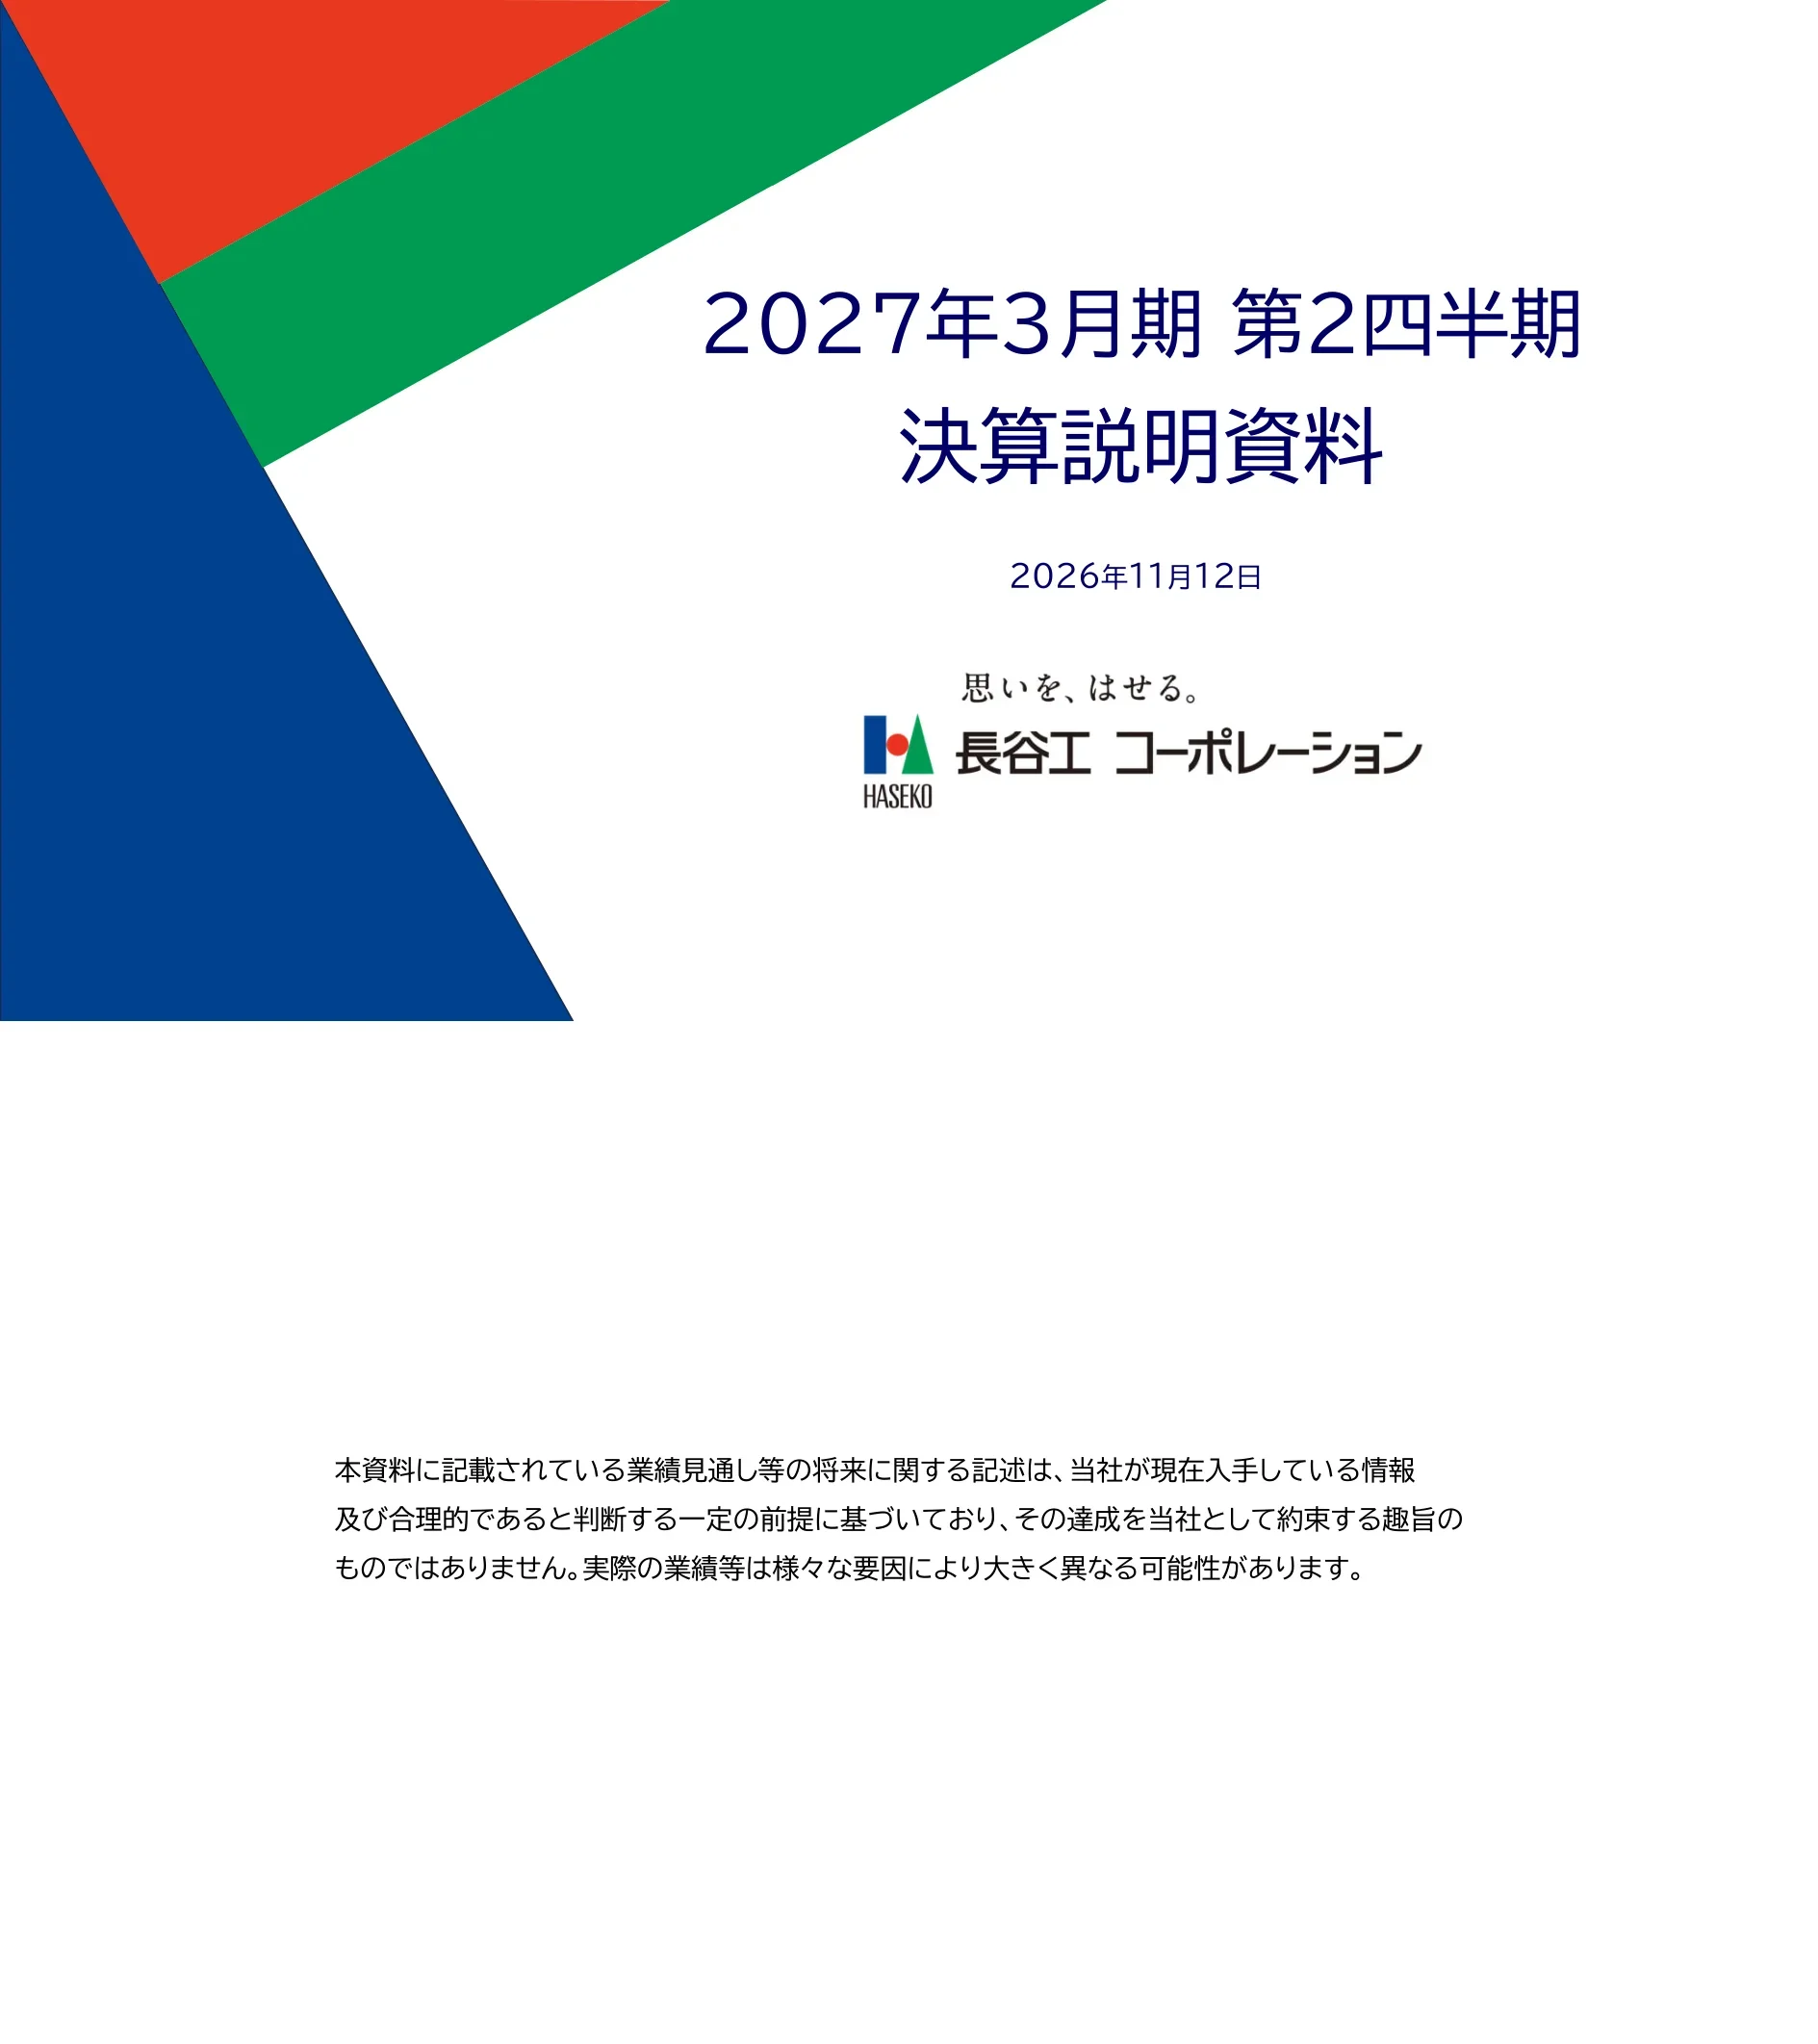
Title slide of Haseko Corporation's second-quarter (first-half) results presentation for the fiscal year ending March 2027, dated 12 November 2026. The Haseko logo and its Japanese company name appear with the tagline shown beneath the logo.
Large title and date centered right, with Haseko logo and tagline below; a red, green and blue geometric shape band covers the left and top-left of the slide.
States that forward-looking statements such as earnings forecasts rest on information currently available and assumptions the company considers reasonable. They are not a promise of achievement, and actual results may differ significantly due to various factors.
Plain white slide with a three-line paragraph of text centered in the middle.
Lists the deck's 19 numbered sections in two columns: results overview (P.1), key figures (P.2), consolidated income statement (P.3), completed construction (P.4), orders (P.5-P.7), real estate sales (P.8), condominium sales indicators (P.9), other real-estate indicators (P.10), management and operations indicators (P.11), overseas business (P.12), balance sheet drivers (P.13-P.14), interest-bearing debt and equity (P.15), segments (P.16), cash flow (P.17), shareholder returns and capital policy (P.18) and reference material (P.19).
Two-column list of page numbers and section names under a title bar with the Haseko logo at top right.
First-half consolidated sales were ¥6,023 (100 million yen units), up 1.2%, and ordinary profit was ¥543 (+37.9%) on higher completed-construction and real-estate gross profit; sales, operating profit and ordinary profit set first-half records. Sales missed the interim forecast of ¥6,300 while ordinary profit beat the ¥470 forecast. Standalone orders were ¥3,839 (+25.3%) against a ¥3,300 initial forecast, the full-year forecast is unchanged, and the interim dividend is ¥50 per share with the annual forecast unchanged at ¥100.
Text-only slide with two underlined section headings (first-half results, shareholder returns) and blue-bar bullet points.
Compares first-half FY2025 (fiscal year ended March 2026) and FY2026 (¥100 million units): sales 5,955 to 6,023 (+1.2%), gross profit 839 to 1,017 (+21.2%), operating profit 413 to 555 (+34.2%, margin 9.2%), ordinary profit 393 to 543 (+37.9%), profit attributable to owners of parent 242 to 356 (+47.2%), standalone orders 3,062 to 3,839 (+25.3%). Full-year forecasts are sales 13,800, operating profit 1,100, ordinary profit 1,050, net profit 660 and orders 7,300, with progress rates from 43.6% to 54.0%.
Single wide table with blue header; prior-year, current-year, change, percent change columns, then a separate block for the full-year forecast and progress rate; current-year column shaded light blue.
Detailed first-half consolidated income statement: sales 6,023 (+69), gross profit 1,017, SG&A 462 (+36), operating profit 555, ordinary profit 543, profit attributable to owners of parent 356, all in ¥100 million units. Completed construction gross margin improved to 17.6% (+3.6pt). The waterfall shows ordinary profit rising from 393 to 543 (+149): construction +113, real estate +59, SG&A -36 (personnel and expenses both up), other +14.
Left half is a dense income-statement table with prior year, current year, change and percent change; right half is a waterfall chart with orange increase bars, one gray decrease bar and blue start and end bars.
Completed construction was ¥3,073 (+0.9%), essentially flat, while completed construction gross profit rose 26.6% to ¥540 on improved standalone margin. Consolidated margin reached 17.6% and standalone 18.0% for FY2026 first half; standalone completed construction was 2,761 and gross profit 498, with differences between consolidated and standalone of 312 and 43.
Two bullet lines on top; below, a stacked bar chart on the left (completed construction) and a stacked bar plus margin line chart on the right (gross profit and margin) for four fiscal years.
Standalone orders were ¥3,839 (+25.3%), above the interim forecast of 3,300, driven by strong private condominium orders; the full-year forecast of 7,300 is on track (52.6% progress). Private condominiums were 3,162 (+508), rental condominiums and company housing 500 (+492), non-residential 0 (-218). Subsidiary orders: Haseko Reform 160 and Fuji Construction 204.
Table with hierarchical rows for construction business sub-lines, design supervision, standalone total highlighted in cyan, and subsidiaries; right-hand block shows full-year forecast and progress rate.
Stacked-bar history of standalone orders by quarter from FY2016 to the FY2026 forecast: FY2025 totaled 7,267 and the FY2026 forecast is 7,300, with first-quarter 2,488 and second-quarter 1,351 booked so far and 3,461 remaining. A table lists five major projects received, including units: 757 (Ageo, Saitama), 591 (Higashimurayama, Tokyo), 488 (Shinagawa, Tokyo), 216 (Chuo-ku, Osaka) and 170 (Toyota, Aichi).
Upper stacked column chart with eleven years in four blue shades by quarter; lower table of five projects with developer, location and unit count.
Private condominium orders per project rose to ¥86.0 to 95.5 (100 million yen) with 31 projects (versus 30). Share of projects with 400+ units fell from 42.2% to 30.0%; Tokyo metropolitan share fell from 69.5% to 62.5% while Tokai rose from 5.8% to 13.6% on a large company-housing order. Specially-commissioned order ratio was 85.8% (96.3% prior year) and design-build ratio 99.9% (74.2%).
Six-panel grid: five small stacked-bar panels with comparisons for prior half, current half, full-year forecast and prior full-year, plus a comment panel.
Real estate sales were ¥2,283 (+0.3%), flat, while real estate gross profit rose 22.5% to ¥318, mainly on a strong condominium sales business at subsidiaries. Standalone real estate sales fell to 915 (from 1,217) while consolidated difference rose to 1,368; standalone gross profit was 82 and the consolidated difference 236.
Two bullet lines above two side-by-side stacked bar charts covering four fiscal years, each split into standalone and consolidated difference.
Condominium sales revenue was ¥1,031 for FY2025 and is forecast at ¥1,100 for FY2026; units sold were 2,062 and are forecast at 1,600. As of 30 September 2026, about 6,300 forecast units are scheduled for sale: about 700 (11%) in the second half of FY2026, about 1,500 (24%) in FY2027 and about 4,100 (65%) from FY2028 onward. Contract progress for the FY2026 forecast units is 42.6% at the start of period and 63.5% by end of Q1, with 78.0% at end of Q2.
Four panels: quarterly sales stacked bars, quarterly units stacked bars, contract progress rate bars, and a donut chart of scheduled sales timing with a note at the bottom.
Four panels cover sales agency for condominiums (full-year contracts 8,042, 7,694 and forecast 8,050 units), brokerage (3,034 contracts in FY2025, forecast 3,500), used-condominium renovation resale (930 units in FY2025, forecast 1,020; first-half 226 units) and income-producing real estate sales (first-half ¥471 against ¥560 prior-year first half; full-year forecast ¥1,200).
Four-quadrant layout with blue section headers; each panel pairs full-year and first-half bars across FY2024 to FY2026 forecast, with line overlays for handled amounts in the top panels.
Condominium units under management were 449,502 at the end of September 2026 (448,076 at March 2026; forecast 453,500). Rental condominium units managed were 126,055 (forecast 126,390) and company-housing units managed on behalf of others were 66,632 (forecast 64,000), with a slight full-year decline expected for rental and company housing due to profitability-focused selection.
Three bar-chart panels with blue headers comparing end of March 2026, end of September 2026 and end of March 2027 forecast; the first has axis-break marks.
In Q2 a ¥33 valuation loss was booked on Hawaii residential land (¥38 in the prior year), so the full-year loss is expected to exceed the initial forecast (ordinary profit -34). Overseas sales were 16 and ordinary profit -39 for the first half (Hawaii -50, US mainland etc. +11); the full-year forecast is sales 70 and ordinary profit -67. In April 2026 the company acquired a 30% stake in a US rental-housing developer, and states a gradual shift to an asset-light model.
Intro bullets above a table with prior first half, current first half and full-year forecast columns; the policy section with three bullets and a footnote sits below.
Total assets were ¥14,165 (down 12 from ¥14,177 at March 2026). Cash fell by 286 to 2,514 and real estate and overseas investment rose by 415 to 8,612. On the other side, interest-bearing debt was 4,225 (-25), net assets 5,843 (+209, retained earnings +223) and deposits received 511 (-174).
Two stacked-bar comparisons, assets on the left and liabilities and net assets on the right, each with before and after bars and change boxes between them; footnotes below.
Real estate and overseas investment rose by 415 to ¥8,612 from 8,197. Income-producing real estate rose 377 to 2,734 as investment outpaced sales, overseas investment in the US mainland rose 230 to 1,087, renovation rose 83 to 318, while land for orders fell 168 to 715 on multiple large-site sales and the condominium business fell 160 to 2,011 as deliveries advanced.
Two stacked columns (end of March and end of September 2026) with change figures in the middle and callout boxes on the right explaining each change; definitions of categories at the bottom.
Interest-bearing debt was ¥4,225 at the end of September 2026 (borrowings 3,424 and bonds 801) with a D/E ratio of 0.72, versus 4,250 and 0.76 at March 2026. Equity was 5,836 with an equity ratio of 41.2%, up from 39.7%, shown across ten balance-sheet dates from March 2018.
Two panels, each pairing columns with an orange line: stacked bars of borrowings and bonds with D/E ratio on the left, equity bars with equity ratio on the right.
Segment sales were ¥6,375 (-0.8%): construction-related 4,224 (-4.9%), real-estate-related 1,301 (+10.9%), management and operations 835 (+4.6%), overseas 16. Operating profit plus equity-method gains was 582 (+29.0%): construction 429 (+30.6%), real estate 161 (+14.4%), management and operations 33 (-20.3%), overseas -41.
Single table with sales and profit blocks, each with four segment rows, plus current-versus-prior change and percent columns and two footnotes.
First-half operating cash flow was +¥60 (prior year 426), investing cash flow -278 on overseas investment and others, financing cash flow -161 on dividends and others, giving free cash flow of -217. Cash and cash equivalents ended the half at 2,513, down 368 from the start of the period (2,881).
Four summary bullets above a table with prior-year, current-year and change columns, with free cash flow and period-end balance rows highlighted in light blue.
The interim dividend is ¥50 per share as announced at the start of the year, and the annual forecast of ¥100 is unchanged. Annual dividends per share: ¥95 for FY2025 (45 interim, 50 year-end) and a forecast of ¥100 (50 interim). Treasury-share purchases were ¥54, ¥215, ¥31 and ¥200 in the years shown. Under the mid-term plan HASEKO Evolution Plan (FY2025 to FY2030) the policy is a total return ratio of about 50%, a progressive dividend and flexible buybacks.
Stacked column chart of dividends per share for eight years with a row of treasury-share purchase boxes below, and a gray policy panel at the bottom.
Section divider introducing the reference material (appendix) that follows, labeled page 19.
White slide with a centered title and a green, red and blue horizontal rule underneath.
Full consolidated income statement with prior and current first-half results, interim forecast comparison and full-year forecast. First-half sales were 6,023 versus an interim forecast of 6,300; operating profit 555 versus 490; ordinary profit 543 versus 470; net profit 356 versus 300. Full-year forecast: sales 13,800, operating profit 1,100, ordinary profit 1,050, net profit 660, with depreciation of 46 in the first half.
Three-block table (first-half results with year-over-year change, first-half versus forecast, full-year forecast with progress) with subtotal rows highlighted and a depreciation row at the bottom.
Standalone first-half sales were ¥3,763 (-6.3%), operating profit 370 (+33.6%), ordinary profit 605 (+40.3%) and interim net profit 482 (+43.3%). Completed construction gross profit was 474 and real estate gross profit 82; full-year standalone forecasts are sales 8,700, operating profit 700, ordinary profit 950 and net profit 690.
Same three-block table format as the consolidated version, with standalone line items such as contract-service and design supervision.
At 30 September 2026 total assets were ¥14,165 (current assets 10,372, fixed assets 3,793), total liabilities 8,322 and net assets 5,843. Shareholders' equity was 5,333 with treasury shares at -479, long-term borrowings 3,422 and bonds 801; compared with March 2026 the totals fell 12 each.
Side-by-side table: assets on the left, liabilities and net assets on the right, with March 2026, September 2026, change and percent columns for each.
First-half pre-tax profit was 541; operating cash flow +60 (-366 versus prior year), investing -278 (including -285 for purchase of investment securities) and financing -161 (including -134 dividends paid). Cash ended the period at 2,513 versus 2,881 at the start; the full-year FY2025 column is also shown.
Long line-item table with prior first half, current first half, change and prior full-year columns; three section totals highlighted.
Per-company first-half sales, ordinary profit and interim net profit for Haseko Corporation (3,763, 605, 482), construction, real estate, management and overseas subsidiaries, with full-year forecasts. Examples: Fuji Construction 153, 14, 13; HASEKO America, Inc. 15, -40, -41; consolidated 6,023, 543, 356. Footnotes mention a Fair Trade Commission on-site inspection involving large-scale repair work orders and an absorption merger effective 1 July 2026.
Wide table grouped by business with light-blue category rows, three column groups (prior half, current half, full-year forecast) and footnotes below.
Condominium supply and first-month sales rates by project size for the Tokyo metropolitan area and the Kinki area across FY2024, FY2025 and FY2026 to September. For the Tokyo area in the first half of FY2026, total supply was 8,601 units, Haseko-built 2,874 (share 33.4%), with first-month sales rates of 62.8% overall and 46.8% for Haseko; the Kinki area supply was 6,557 with 1,273 Haseko-built (19.4%).
Two stacked tables (Tokyo metropolitan area on top, Kinki area below), each with three fiscal-year blocks, size-class rows, totals, and calendar-year totals.
Six-year first-half history from FY2021 to FY2026 for consolidated and standalone results. Consolidated sales grew from 4,148 to 6,023, operating profit from 414 to 555, and total assets from 10,008 to 14,165; the equity ratio is 41.2% and employees 9,529 in FY2026. Standalone orders were 3,839 against 3,062 the year before; shares issued are 292,479 thousand.
Single table with years as columns and grouped rows for consolidated, standalone and share data; current year boxed.
States that Haseko is selected for all six ESG indices adopted by GPIF. Logos show FTSE Blossom Japan Index, FTSE Blossom Japan Sector Relative Index, MSCI Japan ESG Select Leaders and Women's Empowerment (WIN) indices, S&P/JPX Carbon Efficient Index and Morningstar Gender Diversity Tilt Index. Also shown: CDP A List 2025, CDP Supplier Engagement Leader 2025, a health-management certification and participation in TCFD, TNFD, Keidanren biodiversity initiative, Science Based Targets and 30by30.
Three panels of logo tiles (ESG index inclusion, ESG ratings and certifications, initiatives) with a link and an MSCI disclaimer at the bottom.
Closing slide with the Haseko company logo and a mascot character holding a heart balloon, together with an anniversary wordmark marking 90 years of the company.
Centered logo lockup on a plain white background with ample white space.
Pertanyaan umum tentang slide ini dan konten presentasi yang mendasarinya.
It covers the first half of Haseko Corporation's fiscal year ending March 2027, meaning April to September 2026. It is dated 12 November 2026 and compares the period with the same half a year earlier, the interim forecast and the full-year forecast.
The deck is a Japanese-language earnings presentation (決算説明資料), and its original was published on TDnet, the Tokyo Stock Exchange's Timely Disclosure network. This page describes the slides in English, with amounts given in yen in the deck's own unit of 100 million yen (億円).
Haseko's fiscal year runs from April to March. This gallery labels a fiscal year by the calendar year in which it starts, so April 2026 to March 2027 is called FY2026 and its first half is H1 FY2026. The company's own deck calls the same year the fiscal year ending March 2027 (shown on slides as 27/3), so the two names refer to the same period.
Consolidated sales were ¥6,023 (100 million yen units), up 1.2%; operating profit was 555 (+34.2%); ordinary profit was 543 (+37.9%); and profit attributable to owners of parent was 356 (+47.2%). Sales, operating profit and ordinary profit were first-half records according to the overview slide.
Sales of 6,023 fell short of the interim forecast of 6,300, while ordinary profit of 543 beat the forecast of 470. The full-year consolidated forecast was left unchanged: sales 13,800, operating profit 1,100, ordinary profit 1,050 and net profit 660, with progress rates of 43.6% to 54.0%.
Standalone orders were ¥3,839 (+25.3%), above the initial interim forecast of 3,300, mainly from private condominiums at 3,162. The full-year order forecast is 7,300 and progress is 52.6%. The deck also gives quarterly order history from FY2016 and a table of five major projects.
The interim dividend is ¥50 per share, as announced at the start of the year, and the annual dividend forecast is unchanged at ¥100 per share. The shareholder-return slide also describes the mid-term plan policy of a total return ratio of about 50% and a progressive dividend.
It has 31 slides: a title slide, a disclaimer and contents, then 19 numbered pages covering the results overview, key figures, income statement, completed construction, orders, real estate, condominium sales, management business, overseas business, balance sheet, segments, cash flow and shareholder returns. A reference section follows with summary financial statements, subsidiary results, market supply data, a six-year summary and ESG index inclusion, and the deck ends with a closing slide.

Create Your Own Slides
Turn your ideas into professional presentations in seconds with 2slides AI.
Referensikan desain profesional, pilih gaya Anda, dan hasilkan slide dengan rendering teks sempurna. Didukung oleh Nano Banana—mulai buat presentasi Anda sekarang.
Agen AI Anda untuk slide. Hemat waktu, bersinar lebih cepat dengan pembuatan presentasi yang cerdas.


© 2026 2slides. Hak cipta dilindungi.