
Bagian dari Contoh presentasi investor · Contoh presentasi investor Australia
Aristocrat Leisure FY2026 Full Year Results Presentation is the English-language "Full Year 2026 Results – Investor Presentation" lodged with the ASX on 12 November 2026, covering the twelve months to 30 September 2026. It walks through group and segment results for Aristocrat Gaming, Product Madness and Aristocrat Interactive, the cash flow and capital allocation story, and the FY27 outlook, with full financial tables, a glossary and a disclaimer in the appendices. Figures are in Australian dollars (A$) unless a slide says US$.
Menggunakan sampul presentasi ini sebagai referensi gaya untuk slide yang dibuat dari konten Anda sendiri. Atau pilih halaman mana pun di bawah untuk memakai tata letaknya sebagai referensi.
Navigasi Cepat
Tag
Bagikan slide
Aristocrat Leisure FY2026 Full Year Results Presentation is the English-language "Full Year 2026 Results – Investor Presentation" lodged with the ASX on 12 November 2026, covering the twelve months to 30 September 2026. It walks through group and segment results for Aristocrat Gaming, Product Madness and Aristocrat Interactive, the cash flow and capital allocation story, and the FY27 outlook, with full financial tables, a glossary and a disclaimer in the appendices. Figures are in Australian dollars (A$) unless a slide says US$.
Tampilan detail setiap halaman slide, termasuk tata letak, konten utama dan elemen visual.
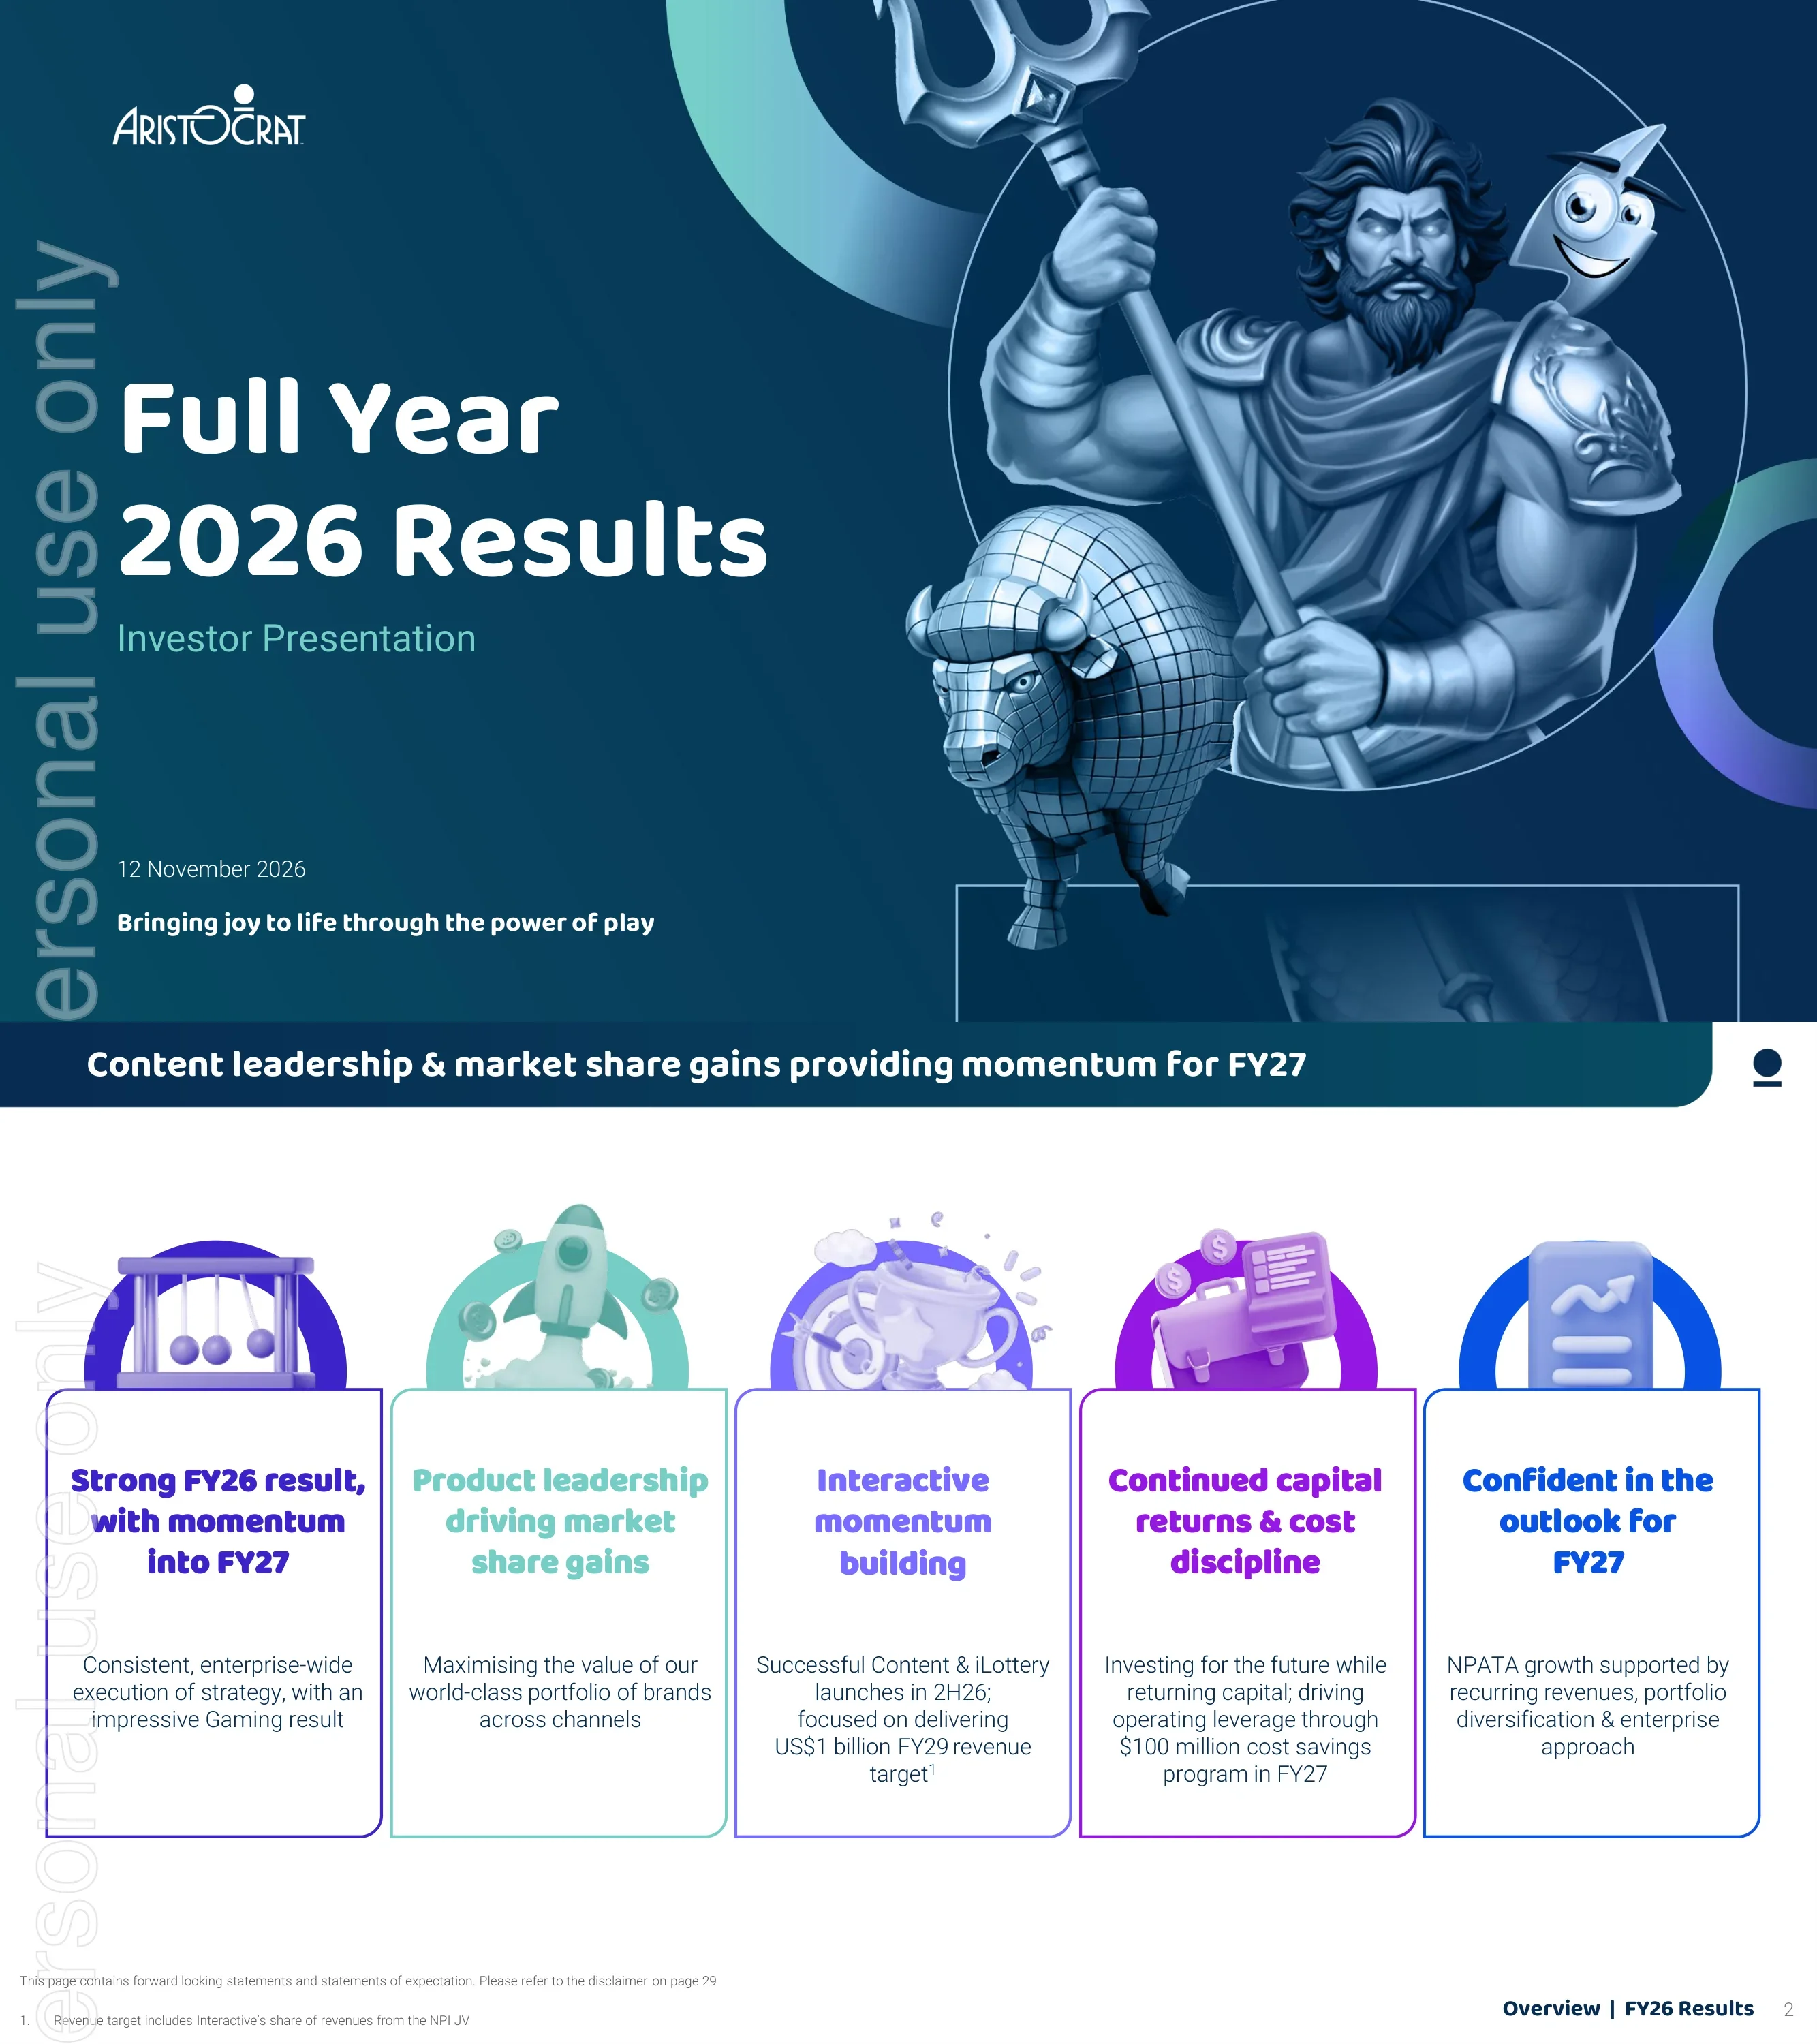
Cover slide of Aristocrat's Full Year 2026 Results investor presentation, dated 12 November 2026. It carries the tagline "Bringing joy to life through the power of play".
Dark navy cover with the Aristocrat logo top left, large white title and teal subtitle on the left, and a game-character illustration inside a circle on the right. A faint "personal use only" watermark runs up the left edge.
Five summary messages: a strong FY26 result with momentum into FY27; product leadership driving market share gains; Interactive momentum building, with successful Content and iLottery launches in 2H26 and a US$1 billion FY29 revenue target; continued capital returns and cost discipline, including a $100 million cost savings program in FY27; and confidence in the FY27 outlook. This is the first slide to state a currency, using US$ for the Interactive target. The footnote says the target includes Interactive's share of revenues from the NPI JV.
Five equal outlined cards in a row, each with a coloured 3D icon above a bold heading and a short paragraph. Footnotes and a forward-looking statement reference sit at the bottom.
Six headline tiles: EPSA growth of 13%, revenue +4% with Recurring Revenue of 70%, EBITA +8%, NPATA +10%, about $1.9bn returned to shareholders through dividends and on-market buy-backs, and an outlook for NPATA growth in FY27. The footnote states that all figures are in AUD unless otherwise stated, that changes are year on year to 30 September 2026, and that the outlook is on a constant currency basis.
Two-by-three grid of KPI tiles separated by dashed lines, with a coloured bar underneath and a large purple illustrated figure on the right edge. Small-print definitions at the bottom.
Scorecard for the three segments. Aristocrat Gaming: revenue growth +9%, profit margin 54.6% in FY25 and 54.9% in FY26, with market share gains (NA Gaming Ops 39%, NA Outright Sales ship share 27%, ANZ ship share 45%). Product Madness: +2%, margin 46.3% to 48.4%, Social Slots share 24%. Aristocrat Interactive: +3%, margin 29.6% to 26.8% (29.9% excluding acquisition impacts), US iLottery share 69% and US iSlots 8%. Footnotes explain the bases and sources, though they are small.
Three column cards, one per segment, with rows for Revenue Growth, Profit Margin % (two-bar FY25 vs FY26 charts) and Market Share, and row labels at the left. Up arrows and a grey dot flag the market share direction.
Strategy execution is yielding results. Three pillars: Content Leadership (invest and innovate while protecting IP), Distribution & Growth (distribute across key channels and markets via operator partnerships and a unified data platform) and Scale Efficiently (operate as one enterprise). They are enabled by Talent, AI, Sustainability, Compliance Culture and Financial Strength, leading to sustainable superior total shareholder returns. Performance aspirations: market share growth, a US$1 billion Interactive revenue target by FY29, EBITA margin expansion and revenue growth greater than D&D expense growth.
Left stack of three icon-led pillars flowing through arrows to an "Enabled by" box and a "Sustainable Superior Total Shareholder Returns" box, with a four-part Performance Aspirations banner along the bottom.
Five differentiators: leading content, brands and IP; creative studios and talent; multichannel distribution; deep regulatory experience and trust across over 350 licensed jurisdictions; and long-standing customer partnerships backed by a global distribution and sales network. A banner underneath covers Sustainability & Responsible Gameplay, with an aspiration to lead in ESP (Empowering Safer Play).
Five dashed-outline columns with circular colour icons inside a large framed panel, with a wide banner at the bottom and two cartoon characters at the lower right.
A game-logo timeline from FY25 to FY26 with a 4Q26 marker. North America Gaming Operations market share rises from 36.6% to 39.3%, and Interactive Content iSlots market share from 3.7% to 7.6%. Gaming titles include Buffalo Mega Stampede, Safe Buster, Spooky Link Grand, Lightning 10 Year Storm, MONOPOLY Big Board Bucks, Tarzan Unleashed, Buffalo Super Eclipse, Buffalo Super Rush and Timber Wolf Mega Stampede. Interactive titles include Mo' Mummy Mighty Pyramid, Phoenix Kingdom Extra Burst, Lil' Tut King's Temple, Lightning Link High Stakes and Tiki Fire.
Two widening wedge shapes, purple for Gaming above and green for Interactive below, along a central FY25 to FY26 arrow with a dashed 4Q26 divider. Dozens of game logos are placed inside each wedge, with share percentages at each end.
Section divider introducing the group results and financial summary part of the Full Year 2026 Results presentation.
Dark navy divider with a large white title and teal subtitle on the left and a cartoon wolf character in a circle on the right.
Normalised A$ million results: total segment revenue 6,092.4 (reported -3.2%, constant currency +3.8%); total segment profit 3,138.0 (+6.6% constant); EBITA 2,236.1 (+7.9%); NPAT 1,450.4 (+9.9%); NPATA 1,578.5 (+9.7%). Reported-continuing NPATA was 1,492.5 (+22.3% constant). EPSA was 259.3c (+13.0% constant), total dividend 101.0c per share and effective tax rate 27.4%. Commentary: D&D expense up 9%, a litigation recovery of about $45 million lowering corporate costs, lower interest expense after the March 2025 Term Loan B repayment, and a final unfranked dividend of 51.0 cents per share for the half-year ended 30 September 2026.
Left side a dense financial table with 2026, 2025 and two variance columns (reported and constant currency); right side five bullet points and two footnotes.
Gaming revenue A$4,020.7m (+1.5%), profit A$2,208.2m and margin 54.9% (+0.3 pts). North America revenue US$2,201.1m (+9.1%) with profit margin 57.6%; Rest of World revenue A$844.2m (+3.7%) with margin 44.9%. Gaming Operations installed base reached almost 82,000 units (about 6,500 net additions), FPD US$53.93 and market share 39%. Outright Sales: North America units +8% (26,923 units, ASP US$21,772) and ANZ about 11,000 units (ASP A$25,649), with ANZ ship share 45%.
Left side a summary P&L table with up and down arrows, below it a three-panel box of unit and FPD/ASP bar charts; right side bulleted commentary under Gaming Operations and Outright Sales headings.
Social Casino revenue US$1,076.8m (+2.2%), profit US$521.4m (+7.0%) and margin 48.4% (+2.1 pts), against a Social Slots market that declined 11%. Market share rose 2.9 pts to 24%, making Product Madness #1 in Social Slots. Social Casual revenue fell to US$4.5m from US$100.7m. DTC rose from 16% to 27% of revenue (2H26 DTC revenue US$161.3m, 30.1% of Social Casino revenue). UA spend was 19% of revenue, and Lightning Link, Cashman Casino and Mighty Fu Casino were about 63% of total Social Casino bookings.
Left a summary P&L table with arrows, below it a framed panel with two bar charts (UA Spend and DTC Revenues, 2H25, 1H26 and 2H26); right side four bullet points.
Reported revenue US$352.8m (+2.5%); total revenue including the iLottery share of NPI JV US$457.2m (+3.4%); profit US$122.6m (-6.2%) and margin 26.8% (-2.8 pts). Excluding White Label, total revenue grew 10%. Content revenue grew 17% and iSlots market share rose about 3.9 pts to 8%. Total iLottery revenue grew 17%, with Michigan and Massachusetts launched in July, and Aristocrat holds 69% of US gross wager. Platforms declined on the White Label exit and softer CXS performance.
Left a summary P&L table and a green-headed bar chart panel for Content, iLottery and Platforms (2H25, 1H26, 2H26 in US$m); right a column of bullets grouped under Content, iLottery and Platforms.
Operating cash flow of $1,889.1m (2025: $1,933.7m), from EBITDA of $2,638.7m less working capital (265.1), interest and tax (612.9) plus other movements 128.4. Net capital expenditure was (436.8); acquisitions and divestments (112.5) reflect Awager and Gaming Analytics. Dividends and cash returned were (1,930.1), made up of $603 million of dividends and $1.3 billion of on-market share buy-backs. Net decrease in cash was (846.3) versus a 302.1 increase.
Left a cash flow table in A$ million with 2026, 2025 and change columns and subtotal lines; right four bullet explanations.
Investment in Design & Development, Gaming Operations capex and user acquisition drives growth and free cash flow, which funds on-market buy-backs, dividends and strategic M&A, supported by a strong balance sheet. Stacked bars show dividends plus buy-backs of about 0.7, 0.8, 1.3, 1.4 and 1.9 ($bn) for FY22 to FY26. FY26 is 0.6 dividends and 1.3 buy-backs. Cumulative returns since FY22 are about $6.1bn (about $2.3bn dividends, about $3.8bn buy-backs).
Left a flow diagram from investment box through free cash flow to capital returns and inorganic growth boxes; right a framed stacked column chart for FY22 to FY26 with cumulative totals.
Investment spend by half (A$m) was 759, 762, 792, 774, 770 and 800 from 1H24 to 2H26, split into D&D expense, UA and Capex. 2H26 was D&D 403, UA 142 and Capex 255. Total spend as a percentage of revenue ranged 24% to 27% and was 26% in 2H26. D&D expense by half in 1H25 to 2H26 was 402, 398, 407 and 403, split into Product and Technology, with constant-currency growth of +4%, +1%, +7% and +10%.
Two framed panels: a stacked column chart of six half-years with a percentage row beneath, and a second dashed panel with a four-half D&D stacked chart and a growth row.
Group Segment Profit Margin rose from 43.1% in FY22 to 51.5% in FY26, and EBITA margin from 28.6% to 36.7%. Segment margins FY22 to FY26: Aristocrat Gaming 53.2% to 54.9% (+1.7 pts), Product Madness 33.0% to 48.2% (+15.2 pts) and Aristocrat Interactive 26.0% to 26.8% (+0.8 pts). A scale graphic shows balancing short-term priorities (productivity, tactical, cost reduction, maintaining) against long-term ones (embedded process, strategic, sustainable investment, innovating).
Left a two-line chart of margins over five years with three segment cards below; right a balance-scale diagram with paired short-term and long-term labels.
Aristocrat expects to deliver NPATA growth over the full year to 30 September 2027 on a constant currency basis. Gaming expects momentum with continued revenue and market share growth; Product Madness expects continued share growth with an increasing contribution from DTC; Interactive expects accelerating performance toward the FY29 US$1 billion revenue target through scaling of Content and iLottery.
Three large outlined circles with logos and short text, each with a coloured base bar and a game character peeking out at the bottom.
Section divider for the concluding remarks of the Full Year 2026 Results presentation.
Navy divider with white title and teal subtitle on the left and a wolf photograph in a circle on the right.
Repeats the five summary messages from page 2: strong FY26 result, product leadership driving share gains, Interactive momentum and the US$1 billion FY29 target, continued capital returns with a $100 million cost savings program in FY27, and confidence in the FY27 outlook.
Identical five-card row to page 2 with colourful icons above bold headings and short paragraphs.
Question and answer divider for the Full Year 2026 Results.
Navy divider with a large "Q&A" title and teal subtitle on the left and a flying cartoon bull with a raised fist on the right.
Section divider introducing the appendices of the Full Year 2026 Results presentation.
Navy divider with white title and teal subtitle on the left and a carved tiki mask illustration on the right.
Group performance table in A$ million: segment revenue Gaming 4,020.7, Product Madness 1,562.1, Interactive 509.6, total 6,092.4; segment profit total 3,138.0; EBITA 2,236.1; NPATA 1,578.5. A reconciliation bridges statutory profit after tax of 1,371.4 to reported NPATA 1,499.5 and normalised NPATA 1,578.5. A significant items table includes Light & Wonder litigation settlement proceeds of 138.7 before tax and a net gain on the sale of Big Fish assets of 68.9. A foreign exchange table shows A$ to USD of 0.6949 at 30 Sep 2026 and a 2026 average of 0.6933.
Three zones: a large group performance table on the left, reconciliation and significant items tables on the right, and a foreign exchange rate strip at lower left. Footnotes at the right bottom.
Normalised results include EBITDA 2,638.7 with a 43.3% margin, EBITA 2,236.1 with a 36.7% margin, EPS fully diluted 238.3c and EPSA 259.3c. Capital management shows D&D investment $810m, UA investment US$210m (19.4% of Product Madness revenue) and total capex $457m. Total debt was $1,509m, net debt $1,135m, net debt to EBITDA 0.4x (0.2x in 2025), liquidity $1.5bn and cash returned $1,930m. An EBITDA reconciliation runs from profit before tax 2,103.9 through EBIT 2,071.1 to EBITDA 2,638.7.
Left a normalised results table; right an EBITDA reconciliation table above a capital management and balance sheet table.
Summary of performance for Gaming (A$m), North America (US$m) and Rest of World (A$m). Gaming revenue 4,020.7, EBITDA 2,527.0, profit 2,208.2 and margin 54.9%. North America revenue 2,201.1 and profit 1,267.1; Rest of World revenue 844.2 and profit 379.0. Gaming Operations units total 81,678 (51,590 Class III Premium, 30,088 Class II) at US$53.93 per day. Outright sales units total 44,661 (North America 26,923; Rest of World 17,738), with ASP of US$21,772 in North America and A$25,649 in ANZ.
Single wide table with three grouped column pairs for 2026 and 2025, with section headers for Gaming Operations and Outright Sales & Other.
Total Product Madness (US$m): bookings 1,075.3, revenue 1,081.4, EBITDA 523.4, profit 520.9 and margin 48.2%. UA spend was 209.7 (19.4% of revenue) and DTC revenue 290.8 (27.0% of Social Casino revenue). Bookings by game: Lightning Link 355.4, Cashman Casino 268.4, Heart of Vegas 178.5, Big Fish Casino 134.7, Jackpot Magic Slots 81.0, Mighty Fu Casino 49.5. Period-end DAU was 1.2 million and ABPDAU US$2.36. The slide notes that figures exclude Plarium following its divestment.
Two side-by-side tables: summary of performance with operational metrics and DTC on the left, bookings by genre and game plus active users on the right.
Interactive (US$m): reported revenue 352.8, total revenue including share of NPI JV 457.2, EBITDA 128.1, profit 122.6 and margin 26.8% of total revenue. Revenue by line: Content 108.6, iLottery 75.2 and Platforms 169.0, plus iLottery share of NPI JV revenue 104.4. Profit comprises 63.6 excluding the JV and 59.0 share of NPI JV profit.
Two compact tables side by side divided by a dashed vertical line, with footnotes at the bottom and large white space beneath.
Defines gaming terms such as Adjacencies, ANZ, ASP, CDS, COAM, Class II and Class III, EGM, FPD, Gaming Operations, GGR, Outright Sales and VGT/VLT, and mobile gaming terms such as ABPDAU, Bookings, DAU, Direct to Consumer, IDFA, Live Ops, LTV, Social Casino, Social Casual and UA.
Two columns of term-and-definition tables under Gaming and Mobile Gaming headings, with ruled rows.
Defines online real money gaming terms such as B2B, B2C, CXS, iGaming, iLottery, NPI JV (NeoPollard Interactive Joint Venture), OSB, PAM, RMG and White Label. The financial terms include EBITA, EBITDA, EPSA, NPAT, NPATA, D&D, ESP, PCP and Recurring Revenue.
Two columns of definition tables: Online Real Money Gaming on the left and Financial & Other on the right.
Standard disclaimer covering forward-looking statements, non-IFRS financial information (unaudited and not reviewed by the independent auditor), and that the document is not investment advice. Contact details are given for Investors (General Manager, Investor Relations) and Media (AIX advisory).
Three columns of dense legal text with a contact panel in the right column.
Closing slide showing four white logos in a row: Aristocrat, Aristocrat Gaming, Product Madness and Aristocrat Interactive. It contains no other text.
Plain navy background with the four logos centred in a horizontal line and decorative gradient rings at the left and right edges.
Pertanyaan umum tentang slide ini dan konten presentasi yang mendasarinya.
It is Aristocrat Leisure's English-language "Full Year 2026 Results – Investor Presentation", lodged with the ASX on 12 November 2026. The cover is dated 12 November 2026 and all slide text is in English.
The first slide to show a currency, page 2, uses US$ for the Interactive revenue target. Page 3 states that all figures are in AUD (Australian dollars) unless otherwise stated. Group tables are in A$ million, while Product Madness, Interactive and North America Gaming are shown in US$ where labelled, for example US$1,076.8m Social Casino revenue and US$2,201.1m North America Gaming revenue.
The slides present FY26 as the twelve months ended 30 September 2026, with the prior year (FY25) ending 30 September 2025. The outlook refers to the full year to 30 September 2027. Half-year labels such as 1H26 and 2H26 are used in the charts, and the final dividend is for the half-year ended 30 September 2026.
In constant currency, revenue was up 4%, EBITA up 8%, NPATA up 10% and EPSA up 13%. In A$ millions, normalised segment revenue was 6,092.4 and NPATA was 1,578.5. Reported-currency revenue fell 3.2%, and the slides show reported and constant-currency variances side by side. About $1.9bn was returned to shareholders.
Aristocrat Gaming revenue grew 9% in constant currency with a 54.9% profit margin, Product Madness revenue grew 2% with a 48.4% Social Casino margin and 24% Social Slots share, and Aristocrat Interactive revenue grew 3% with a 26.8% margin and 69% US iLottery share.
Aristocrat expects NPATA growth over the full year to 30 September 2027 on a constant currency basis. The deck also cites a $100 million cost savings program in FY27 and a US$1 billion Interactive revenue target by FY29, which includes Interactive's share of NPI JV revenue.
FY26 returns were about $1.9bn, made up of $603 million of dividends and $1.3 billion of on-market buy-backs, and cumulative returns since FY22 are about $6.1bn. The framework slide shows investment in D&D, Gaming Operations capex and user acquisition funding free cash flow, which supports buy-backs, dividends and strategic M&A.
Yes. The appendix (pages 22 to 28) has the full group P&L, a reconciliation of statutory profit to normalised NPATA, an EBITDA reconciliation, net debt, segment tables for Gaming, Product Madness and Interactive, and a two-page glossary. Some footnotes on earlier slides are small print and may be hard to read at low resolution.

Create Your Own Slides
Turn your ideas into professional presentations in seconds with 2slides AI.
Referensikan desain profesional, pilih gaya Anda, dan hasilkan slide dengan rendering teks sempurna. Didukung oleh Nano Banana—mulai buat presentasi Anda sekarang.
Agen AI Anda untuk slide. Hemat waktu, bersinar lebih cepat dengan pembuatan presentasi yang cerdas.


© 2026 2slides. Hak cipta dilindungi.