
Bagian dari Contoh presentasi investor · Contoh presentasi investor India
Adani Power Investor Presentation November 2026 - the 36-page USD edition of Adani Power Ltd's updated investor presentation (BSE: 533096 / NSE: ADANIPOWER), filed with BSE and NSE on 17 November 2026 (an INR edition was filed the same day). It profiles India's largest private thermal power producer: the India power-demand backdrop, the Adani portfolio, APL's 18,330 MW operating fleet and 42,050 MW target capacity, six investment highlights, capital structure and credit ratings, ESG, governance and historical financials in US$.
Menggunakan sampul presentasi ini sebagai referensi gaya untuk slide yang dibuat dari konten Anda sendiri. Atau pilih halaman mana pun di bawah untuk memakai tata letaknya sebagai referensi.
Navigasi Cepat
Tag
Bagikan slide
Adani Power Investor Presentation November 2026 - the 36-page USD edition of Adani Power Ltd's updated investor presentation (BSE: 533096 / NSE: ADANIPOWER), filed with BSE and NSE on 17 November 2026 (an INR edition was filed the same day). It profiles India's largest private thermal power producer: the India power-demand backdrop, the Adani portfolio, APL's 18,330 MW operating fleet and 42,050 MW target capacity, six investment highlights, capital structure and credit ratings, ESG, governance and historical financials in US$.
Tampilan detail setiap halaman slide, termasuk tata letak, konten utama dan elemen visual.
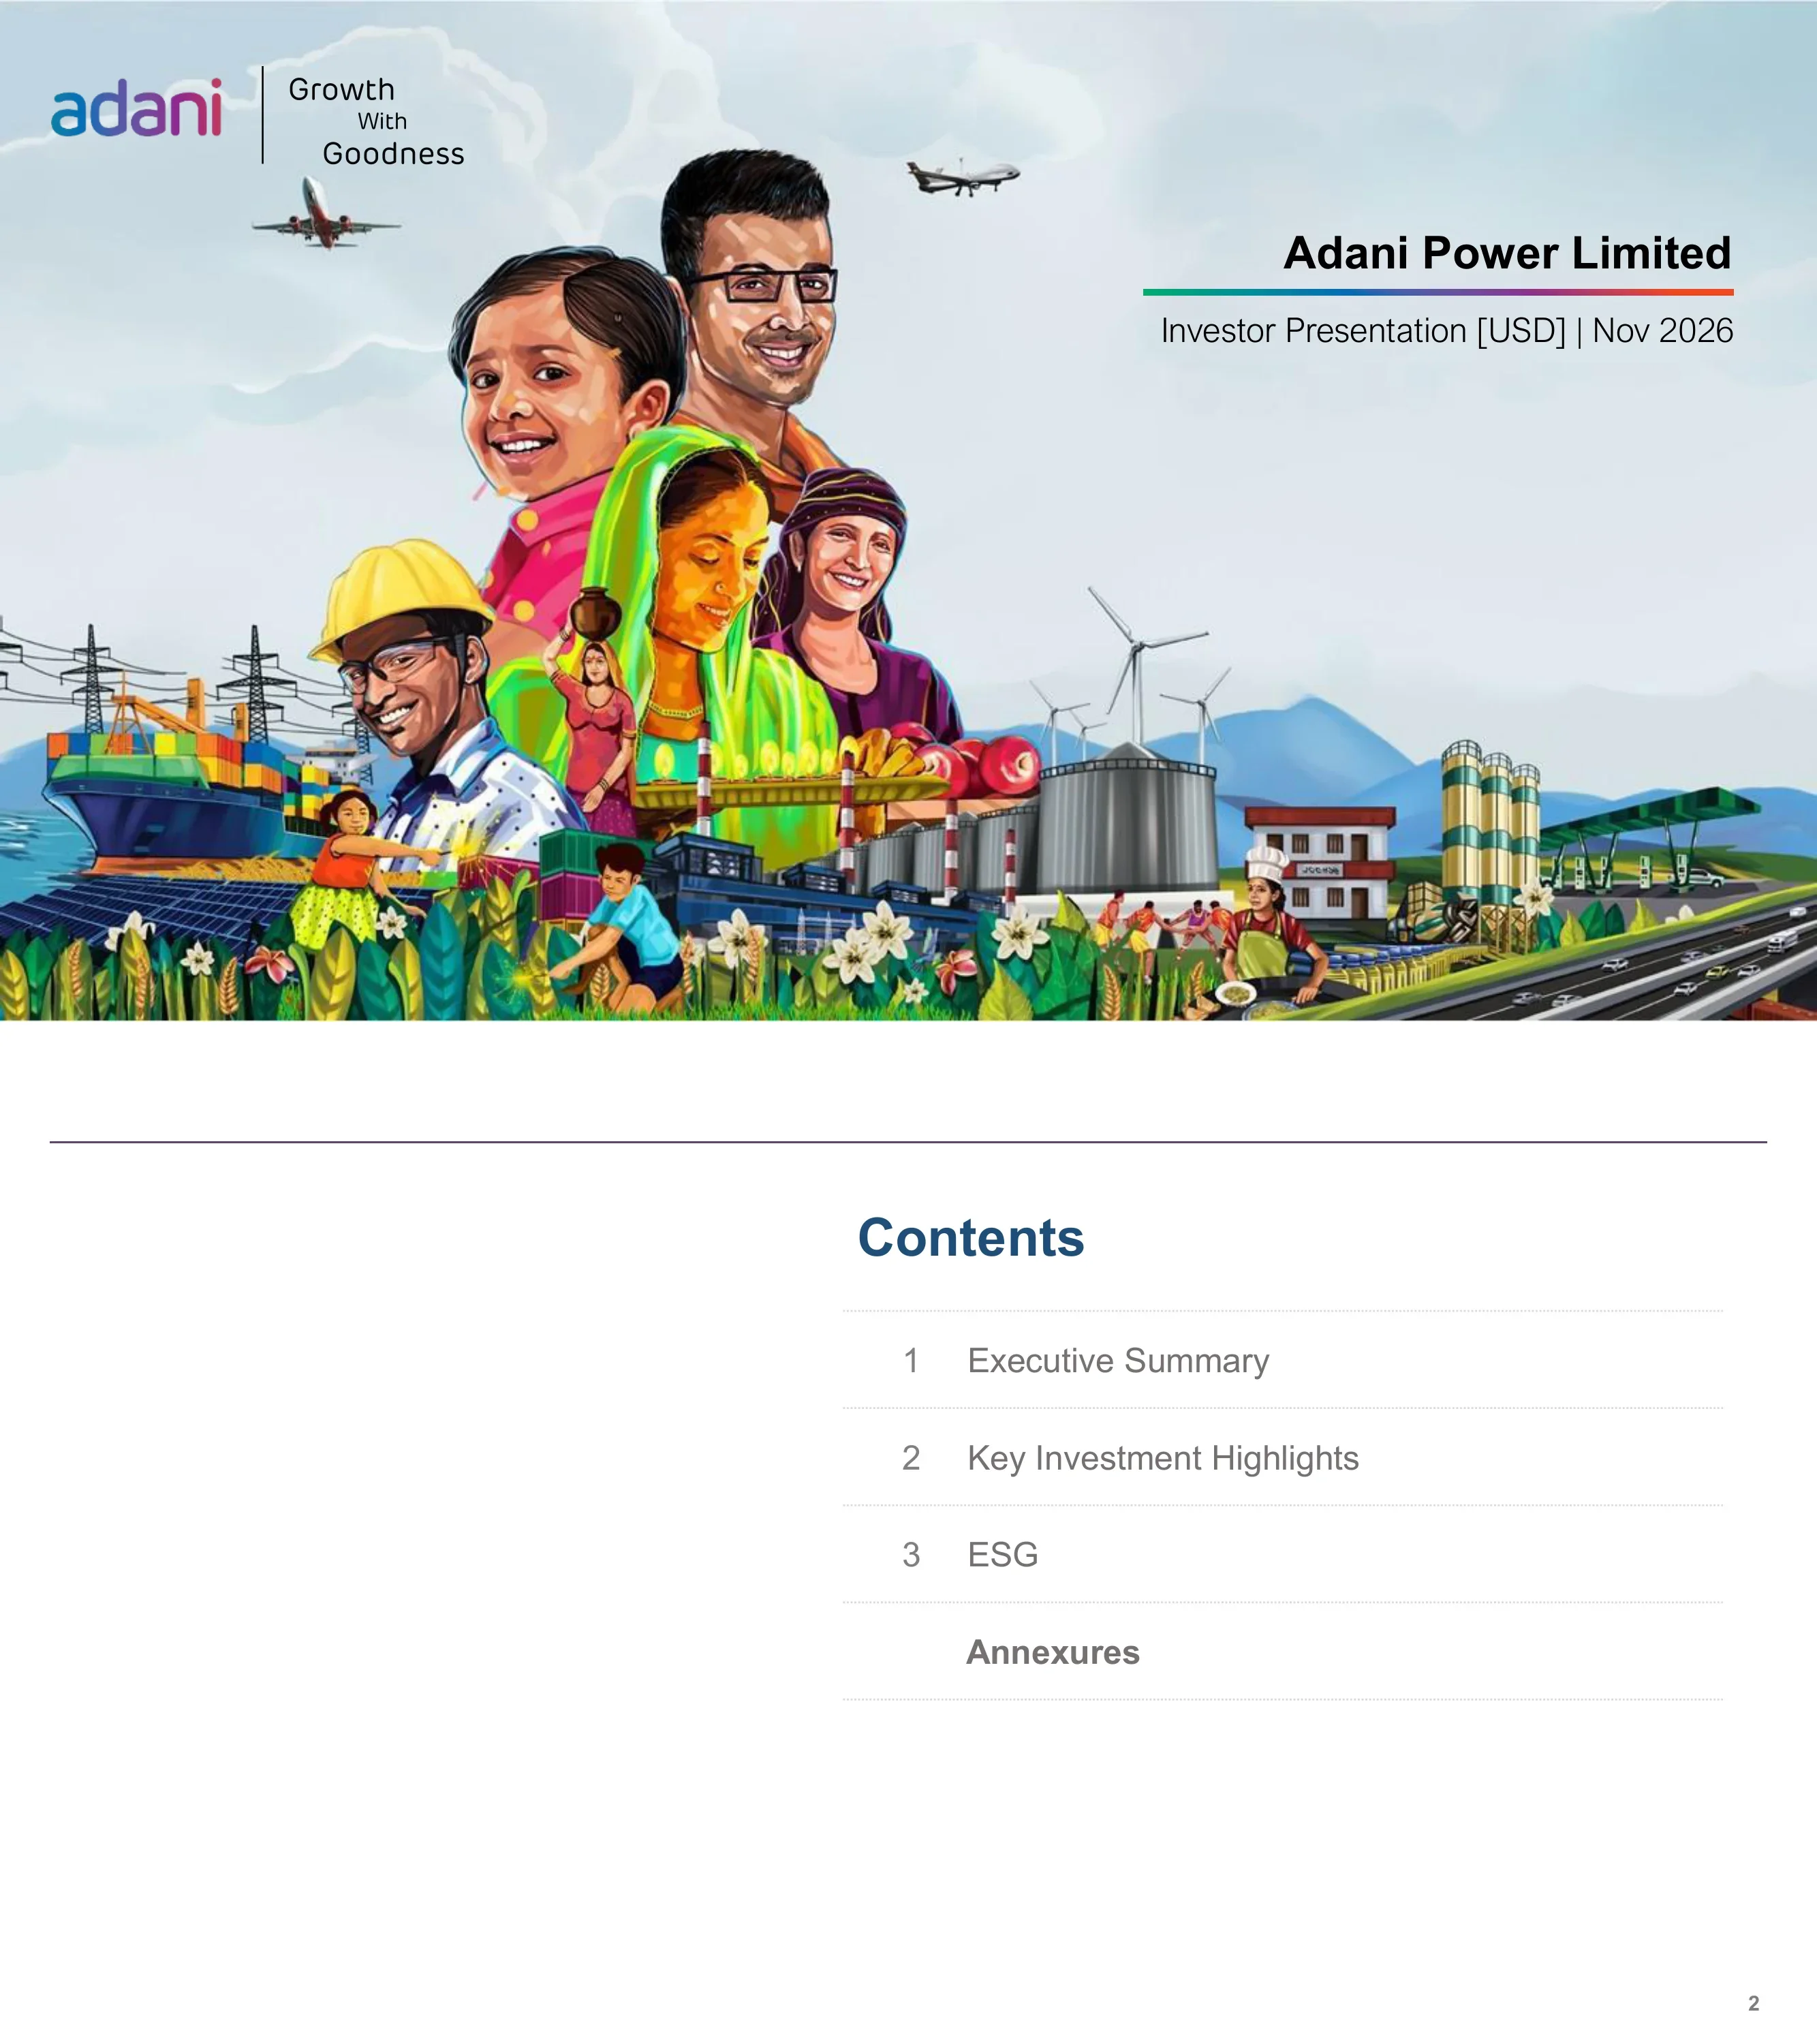
Cover slide reading 'Adani Power Limited - Investor Presentation [USD] | Nov 2026' with the adani logo and the 'Growth With Goodness' tagline.
Full-bleed illustrated artwork with title block and gradient rule at the right, logo and tagline at top left
Agenda listing 1 Executive Summary, 2 Key Investment Highlights, 3 ESG, and Annexures.
Minimal right-aligned numbered list with dotted separators on a white background
Section divider slide for '1 Executive Summary'.
Large light-grey section number above a bold grey title, right-aligned on white
States India's real GDP grew 7.1% in FY25 and is estimated at 7.8% in FY26, with a target of ~$35 Tn GDP by 2047. Panels cover the fastest-growing economy and consumer base, air-travel and logistics gaps, electricity consumption, a decarbonisation and CAD table in USD b, UPI at 242 bn transactions in FY26 and the $1.2 bn India AI Mission.
Key-highlights column on the left; 2x4 grid of titled chart/table panels with takeaway captions on the right
Indian installed capacity is shown at 344 GW (FY18), 532 GW (FY26) and 1,000 GW (FY32E), with a $500 Bn+ investment opportunity by FY32. Adani Power's baseload row shows 10.4, 18.1 and 42.1 GW (FY18, FY26, FY32E) and a $20 Bn+ investment plan by FY32.
Left: sector facts and mini bar charts per segment; right: Adani business logos with CAGR, multiple-vs-industry tags and investment plan; closing banner
Organisation chart of the Adani portfolio showing listed companies such as AGEL, APL (74.96%), AESL, ATGL, APSEZ, Ambuja Cements and NDTV with promoter holding percentages. Banner reads 'A multi-decade story of high growth centered around infrastructure & utility core'.
Column-based org chart by category (Flagship, Energy & Utility, Transport & Logistics, Primary Industry, Other) with a highlighted unlisted-businesses box and long footnotes
APL shows 18,330 MW installed capacity across 13 assets, 23,720 MW locked-in and a 45 GW target. H1 FY27 revenue is $4,129 Mn (+27% YoY), EBITDA $1,799 Mn and PAT $1,250 Mn; FY26 revenue is $6,553 Mn, EBITDA $2,653 Mn and PAT $1,469 Mn. Net debt of $4,820 Mn gives 1.91x net debt to continuing EBITDA (Sep'26 TTM).
Left: India map with plant callouts and capacity equation legend; right: two columns of KPI tiles (asset details, H1 FY27 vs FY26 financials)
Summary of six numbered highlights under 'Inbuilt, Irreplicable Structural Advantages drive APL as the Best Power Generation Play in India', including an 18.33 GW portfolio across 9 states, 90%+ plant availability, a 40% EBITDA margin and 100% BTG ordering for 23.7 GW of projects. Side callouts say APL is a market leader for baseload power.
Six numbered navy label boxes at left with bullet panels, two callout boxes at right
Section divider slide for '2 Key Investment Highlights'.
Large light-grey numeral above a bold grey title, right-aligned
Shows a per-capita electricity consumption table by state against an India average of 1,460 kWh per person, and a Vision 2047 demand view of 6,400 BU energy, 708 GW peak and 2,100 GW installed capacity. Thermal PPA bids: 30 GW of coal allocations, 22.2 GW awarded by State Discoms of which 15.3 GW to APL, with a state table totalling 22,240 MW awarded and 15,265 MW to APL.
Three columns: state consumption table with bullets; demand/renewables panels with two pie charts; thermal PPA KPIs and state table
Capacity build-up bars: 10,840 MW executed organic, 7,450 MW inorganic, 18,330 MW current operating, 23,720 MW ongoing organic expansion and 42,050 MW target. Plant cards for Mundra (4,620 MW), Tiroda (3,300 MW), Kawai (1,320 MW) and Godda (1,600 MW) list PPA tie-ups, fuel and COD dates, plus 1,600 MW under development.
Left: capacity bridge columns; right: four plant photo cards with specification rows
Banner reads 7,450 MW of inorganic thermal capacity: 4,370 MW of rapidly turned-around assets (Udupi, Raipur, Raigarh, Mahan) and 3,080 MW of recent additions (Korba, Mutiara, Dahanu, Butibori, Churk). Each plant card shows MW, PPA tie-up, FSA volume and COD; several carry 3,200 MW or 2,920 MW under development.
Nine plant photo cards in two groups under a navy banner, with under-development boxes beneath
Three case studies: Mahan Energen (1,200 MW acquired March '22 for $330 Mn, cumulative EBITDA $852 Mn), Raipur plant (1,370 MW, $468 Mn acquisition cost, cumulative EBITDA $1,347 Mn) and Raigarh plant (600 MW, $160 Mn, cumulative EBITDA $535 Mn). Targets are 4,400 MW by 2030, 4,570 MW by 2031 and 3,800 MW by 2031 respectively.
Three equal columns, each with KPI tile cluster, plant photo and a 'turnaround story' bullet box
Covers 8 states and 13 thermal plants with 7,400 MW subcritical, 9,290 MW supercritical and 1,600 MW ultra-supercritical capacity. FY26 plant availability is 88% and continuing EBITDA margin is 40%; the closing banner credits AI-enabled O&M driven by AIMSL.
Top: control-room photo beside navy bullet panel; bottom: three flow blocks (scale, availability, margin) linked by chevrons
Left chart compares state merit-order variable-charge ranges with APL's variable charge under PPAs (for example Gujarat 7.28 high, 1.09 low and APL 6.06). Right chart shows bilateral, exchange and APL volumes (BU) with average tariffs (Rs./kWh) for 2019-20 to 2025-26; the 2025-26 bilateral tariff is as of Jan 2026.
Two halves each with chart on top and two label-plus-bullet rows beneath
Six numbered advantages include entry into commercial mining with 14 MTPA capacity, handling approx. 74 MTPA coal and 22 MTPA fly ash, and more than 18,500 rake equivalents of fuel handled annually. A map marks APL plants, mines, imported-coal ports and PPA counterparty states.
Left: six chevron rows with icons and numbers; right: annotated India map with legend
Strategic advantages tiles show 60% brownfield, 70% near-pithead, 100% land available and 100% BTG ordering, with 22.4 GW of BTG sets ordered in advance. The project table lists 12 projects with an organic total of 23,720 MW, 100% land and equipment, 87% environmental clearance and 14,640 MW of PPAs signed.
Left: KPI tiles and three text boxes on derisked execution; right: checkmark matrix by project
Tie-up chart runs from 18,330 MW installed to a 42,050 MW target, with 14,640 MW of new PPAs and 9,080 MW tie-ups in progress. Upcoming long-term PPA bids total 16,660 MW across Uttar Pradesh, Gujarat, West Bengal, Rajasthan and Andhra Pradesh; states have awarded 20.9 GW of PPAs from FY 2024-25 onwards, of which APL has won 13.9 GW.
Left: two stacked bridge charts (tie-up status, capacity expansion timeline); right: bid table and demand-outlook box
States $76.3 Bn cumulative capex by the Adani Portfolio during FY20-FY26, with yearly bars labelled 3, 5, 13, 12, 8, 15 and 20 (In USD Bn). Also covers institutionalised project execution, risk mitigation across execution, time and cost, credit and liquidity, and an integrated vendor ecosystem.
Left: activity / performance / risk-mitigation matrix with three photos; right: capex bar chart and two-column vendor ecosystem panel
Nine-box grid under Execution Assurance, Fuel Assurance and Finance Assurance. Points include 22.4 GW BTG advance booking, APL developing four coal mines with 14 MTPA capacity, 95% capacity under PPAs with two-part availability-based tariff, and AA rating by four leading domestic rating agencies.
3x3 card grid with navy column headers and bullet text
Headline: 'Secure Business Model with 90%+ Capacity Tied-up in Long Term Contracts'. Existing capacity is 95% tied up under PPAs with 5% supplying short-term demand; 14.6 GW of PPAs tied up by APL with 16+ GW of bids ongoing. First-year capacity charges under recent PPAs are shown as Rs 2.89/kWh (FY 2020-21), Rs 3.60-3.73/kWh (FY 2024-25) and Rs 4.11-4.30/kWh (FY 2025-26 onwards).
Left KPI tiles, centre three bullet panels, right tariff list, flow strip of three boxes at the bottom
FY26 FFO walk (In USD Mn) goes from EBITDA 2,653 less finance cost (372) with tax paid 12 to FFO 2,293; FFO plus cash balances is 3,259 versus 3,252 in FY25. The debt maturity profile spans FY27 to FY36 and is covered by FFO and cash; text cites ability to fund $21 Bn capex over the next 7 years and $16 Bn aggregate FFO.
Left: FFO waterfall and FFO+cash stacked bars; centre: debt maturity bars on shaded envelope; right: bullet panel
Rating track record table (March 2023, March 2025, November 2026) shows CareEdge, India Ratings and ICRA at AA+/Stable and Crisil at AA/Stable in November 2026, a 9-notch upgrade over 7 years. Net debt to continuing EBITDA fell from 9.75x (FY19) to 1.91x (Sep'26 TTM); net debt is $4,820 Mn versus $6,644 Mn in FY19.
Top-left rating-record badge and table; right rating highlights and KPI tiles; bottom combo chart
Three growth tracks: base load expansion to 45 GW by FY 2031-32 (23.7 GW ongoing at an estimated Rs 2 Trillion capex, plus 3 GW further additions), 5,000 MW hydro in Bhutan with two projects totalling 1,340 MW at 49:51 APL:DGPC, and nuclear via Adani Atomic Energy Ltd. targeting 10 GW by 2035.
Three stacked text cards at left with matching line-art illustrations on the right
Section divider slide for '3 ESG'.
Large light-grey numeral above bold grey title, right-aligned
Targets include reducing GHG emission intensity to 0.84 tCO2e/MWh by FY27 (FY26 average 0.86), 100% Single-use-Plastic-Free certification and zero health and safety related injuries. Ratings cited: 71/100 in S&P Global CSA (sector average 41/100), NSRA ESG rating 66, Sustainalytics 31.7, FTSE Russell 4.3/5.0 and CareEdge 80/100. A green 'Updated' tag marks the slide.
Four columns: material topic, targets, initiatives and achievements, UN SDG icon grid
Governance slide with a committee matrix, stats (40% of the board comprised of only Independent Directors, 100% of statutory committees chaired by Independent Directors), four independent directors and four non-independent directors including Chairman Gautam Adani. A box lists pathways to strengthen corporate governance.
Left: committee checkmark matrix, stats and governance box; right: grid of director portraits with experience and skills
Closing 'Thank You' slide concluding the main body before the annexures.
Single bold navy title on a white background, bottom-right
Divider slide titled 'Annexures' introducing the appendix.
Bold navy title at bottom-right under a header rule
Table of operating metrics and P&L from FY22 to H1 FY27 in USD Mn, for example revenue from operations 6,142 (FY26) and 4,031 (H1 FY27), EBITDA 2,653 and 1,799, and PAT 1,469 and 1,250. Side tiles highlight 18,330 MW operating capacity, 44% EBITDA margin, and 3Y CAGRs of 15% (EBITDA) and 3% (PAT).
Left: dense financial table with CAGR column; right: Q2 FY27 insight KPIs
Balance sheet from 31 Mar 2022 to 31 Sep 2026 in USD Mn, with total assets of 16,112 (Mar 2026) and 17,318 (Sep 2026), total equity of 7,519 and 8,200. Side KPIs: $15,977 Mn fixed assets incl. CWIP, $1,676 Mn cash, RoA 19.1%, RoCE 21.7% and RoE 26.5% (Sep '26 TTM).
Left: assets and liabilities table with ratio rows; right: Q2 FY27 insight KPIs
Charts show installed capacity (222 GW coal and 25 GW gas in 2024-25 versus 84 and 17 in 2009-10), 2024-25 coal consumption of 1,270 MT (83% domestic) and gas consumption of 71,314 MMSCM (50% imports). Reserves: 437 Billion Tonnes of coal and 1,094 Billion Cubic Meters of gas; the banner says coal anchors baseload power.
Top: three chart panels; middle: four numbered reason rows with icons; bottom banner
Operating capacity of 14 assets and 18,330 MW plus locked-in capacity of 13 projects and 23,720 MW equals target capacity of 18 assets and 42,050 MW. Operating mix is 59% organic and 41% inorganic with 95% PPA tie-ups; locked-in capacity is 100% organic with 62% PPA tie-ups; ongoing thermal PPA bids are 16+ GW.
Three columns joined by plus and equals signs, each with stacked horizontal percentage bars for asset type, technology and PPA status
Photo gallery of Mahan Phase-II (2 x 800 MW), Raipur Phase-II (2 x 800 MW), Raigarh Phase-II (2 x 800 MW) and Korba Phase-II (2 x 660 MW), each with three construction images such as boiler structures, a control room and chimney wind shield.
Four columns with navy project headers and three captioned photos each
Legal disclaimer stating the presentation contains forward-looking statements, does not constitute an offer of securities, and that APL makes no representation on accuracy; securities may not be offered in the United States without registration.
Single page of justified paragraph text under a header rule
Final 'Thank You' closing slide.
Single bold navy title on a white background, bottom-right
Pertanyaan umum tentang slide ini dan konten presentasi yang mendasarinya.
It is the 36-page investor presentation of Adani Power Ltd (BSE: 533096 / NSE: ADANIPOWER), filed with BSE and NSE on 17 November 2026. This is the USD edition; an INR version was filed the same day. It covers India's power-sector opportunity, APL's assets, investment highlights, capital structure, ESG and financials.
The deck shows 18,330 MW of installed capacity across 13 assets (slide 7), 23,720 MW of locked-in capacity and a 42,050 MW target; slide 7 also cites a 45 GW target. Slide 33 describes the operating portfolio as 14 assets, so asset counts differ between slides. Slide 24 targets 45 GW of base load capacity by FY 2031-32.
Slide 7 reports H1 FY27 revenue of $4,129 Mn, EBITDA of $1,799 Mn and PAT of $1,250 Mn, versus FY26 revenue of $6,553 Mn, EBITDA of $2,653 Mn and PAT of $1,469 Mn. Net debt is $4,820 Mn, or 1.91x continuing EBITDA (Sep'26 TTM). Slides 30 and 31 give multi-year P&L and balance sheet tables.
Slide 23 lists November 2026 ratings of AA+/Stable from CareEdge, India Ratings and ICRA, and AA/Stable from Crisil. It describes a 9-notch upgrade over the last 7 years, with coverage growing from one rating agency to four.
Yes. Slide 24 outlines entry into hydroelectric power in Bhutan (5,000 MW in partnership with DGPC, with agreements for two projects totalling 1,340 MW) and nuclear power through Adani Atomic Energy Ltd., targeting 10 GW by 2035.
Both were filed with the exchanges on 17 November 2026. The USD edition converts financial figures into US$ Mn or US$ Bn, using the INR/USD rates printed in the slide footnotes, while many tariff and capex items remain quoted in rupees. Use the USD edition for comparisons with international peers.
The deck is a useful layout reference: section dividers, KPI tiles, annotated maps, bridge and combo charts, financial tables, photo galleries and a director grid. The content is Adani Power's own filed material, so use it for study and design inspiration, and replace all company content, branding and figures in your own deck.
No. Slide 35 states that the presentation contains forward-looking statements, is not an offer or recommendation to buy or sell shares, and that past performance is not indicative of future results. Readers should consult the original exchange filing and make their own assessment.

Create Your Own Slides
Turn your ideas into professional presentations in seconds with 2slides AI.
Referensikan desain profesional, pilih gaya Anda, dan hasilkan slide dengan rendering teks sempurna. Didukung oleh Nano Banana—mulai buat presentasi Anda sekarang.
Agen AI Anda untuk slide. Hemat waktu, bersinar lebih cepat dengan pembuatan presentasi yang cerdas.


© 2026 2slides. Hak cipta dilindungi.