
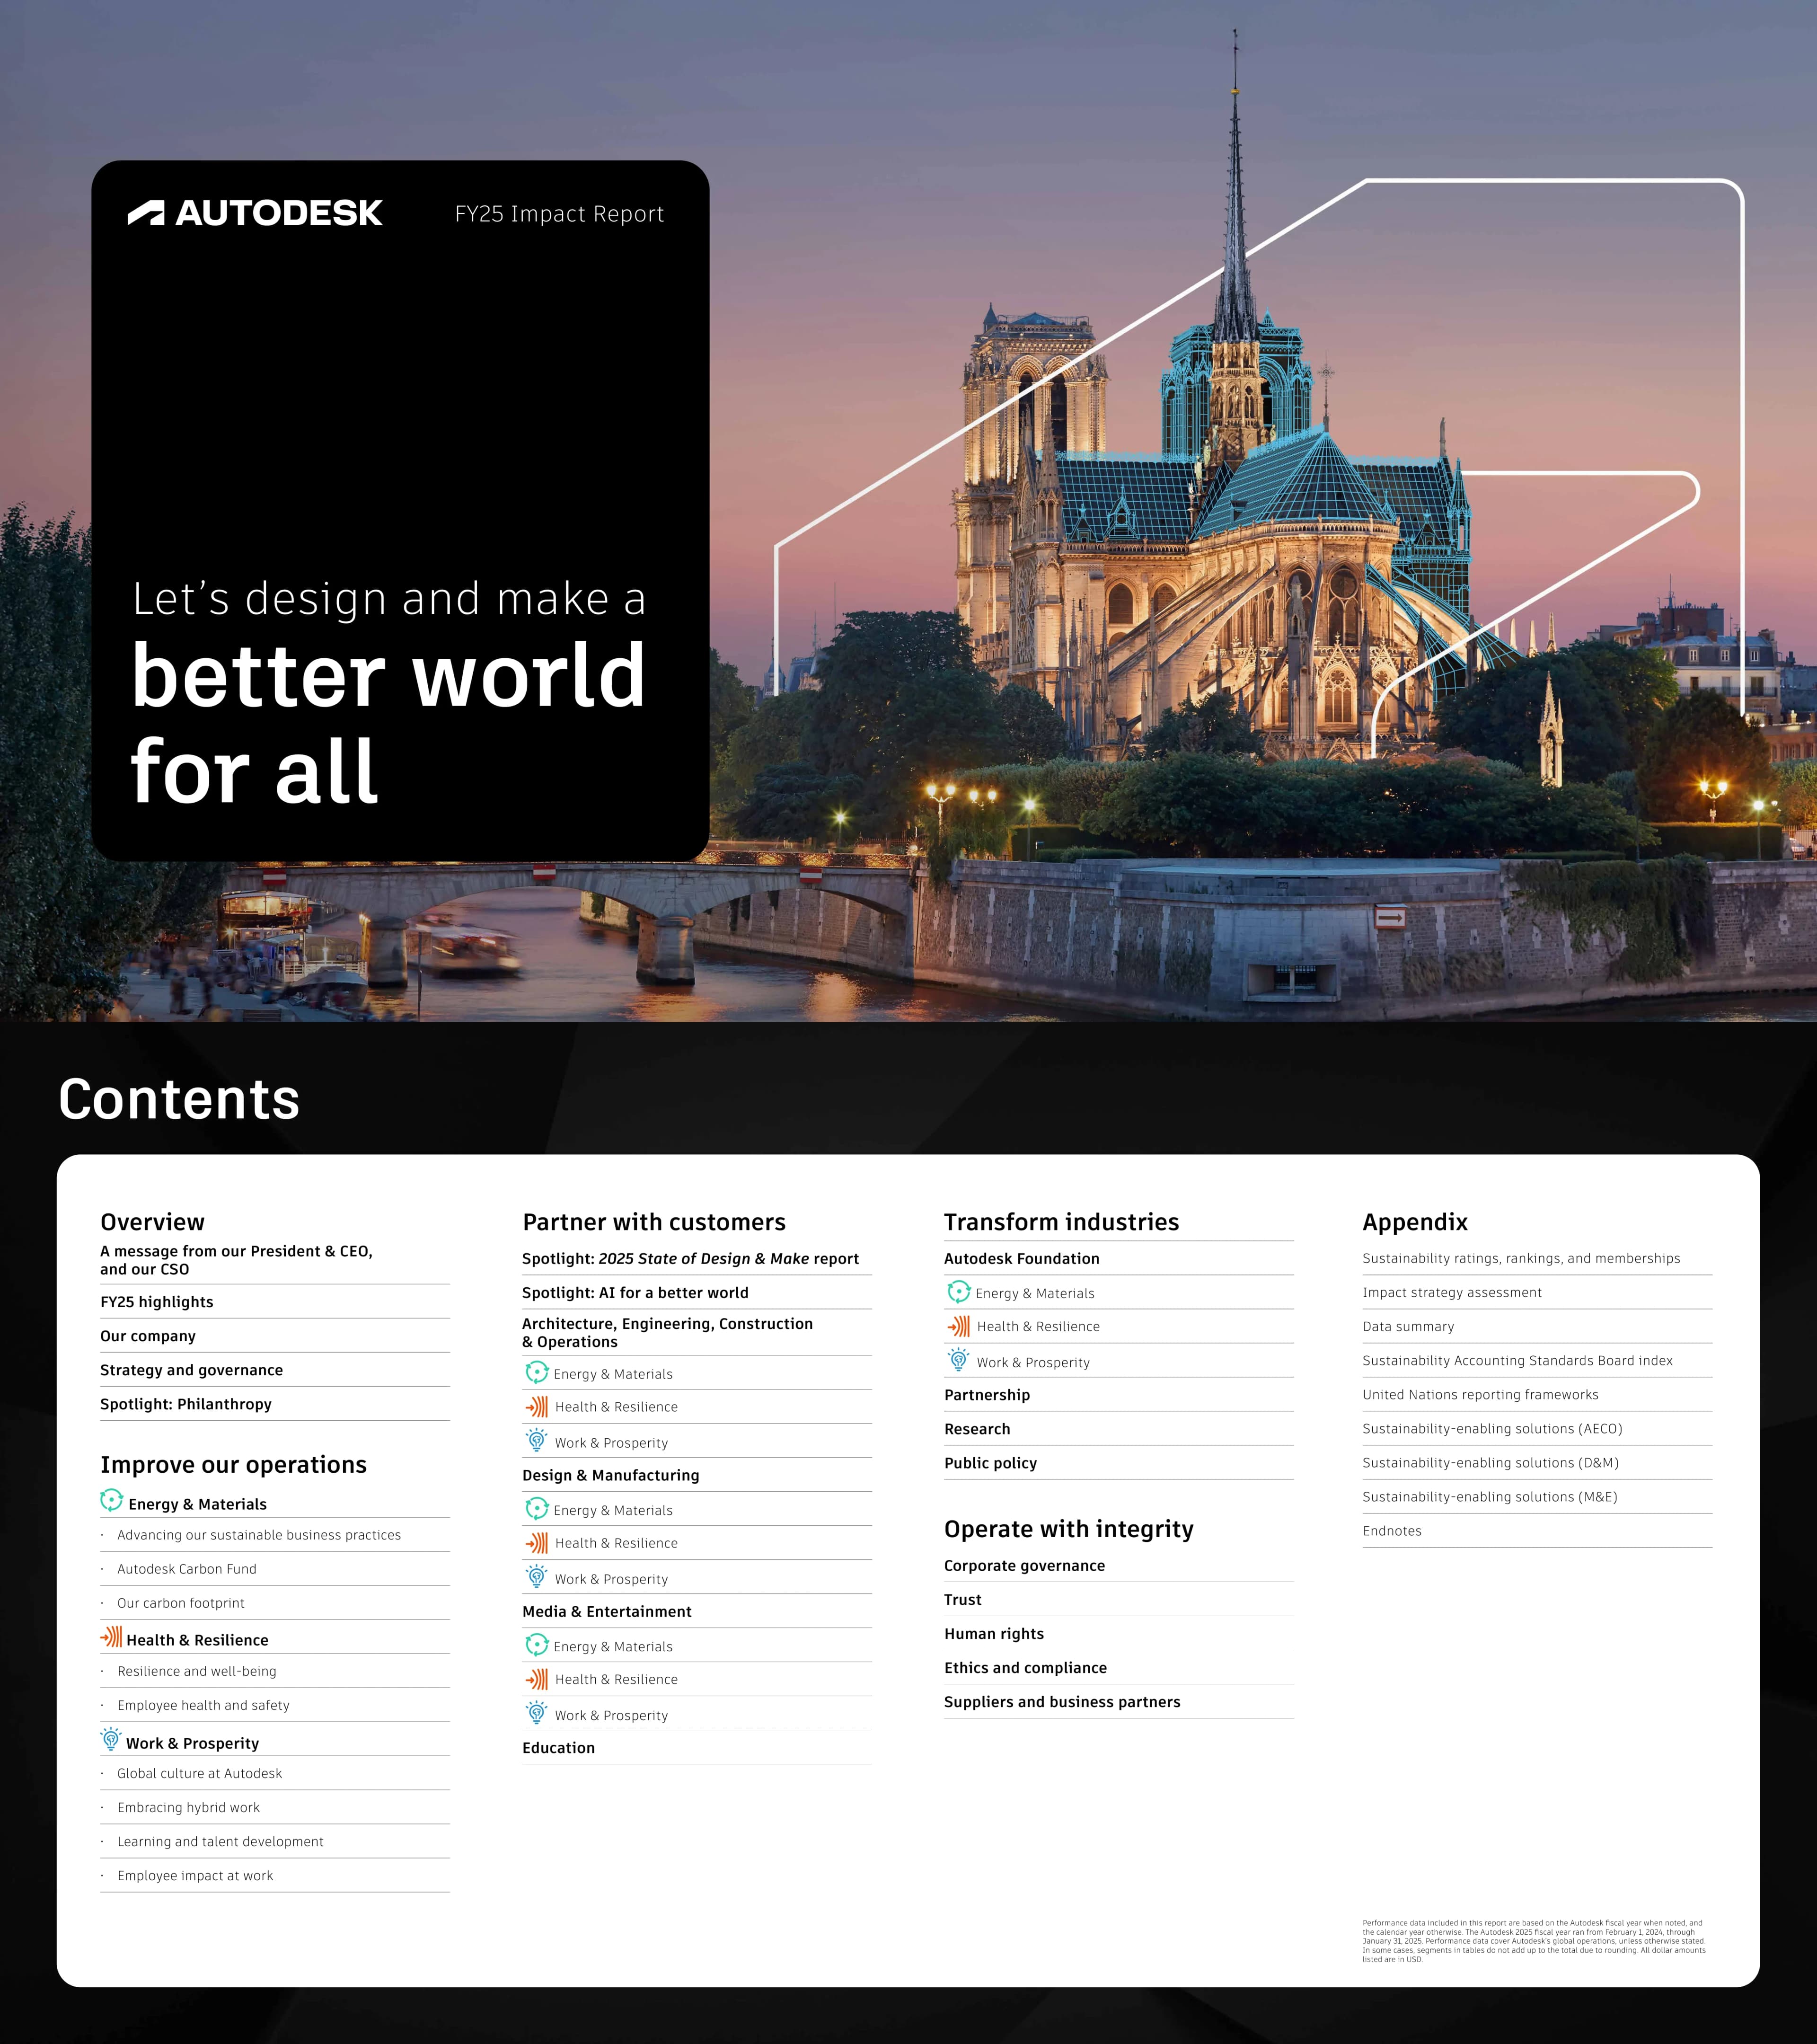
Autodesk FY25 Impact Report — Corporate Sustainability and ESG Annual Report covering environmental performance, social impact, governance, and philanthropy across Autodesk's global operations
Navigation rapide
Étiquettes
Partager les diapositives
Autodesk FY25 Impact Report — Corporate Sustainability and ESG Annual Report covering environmental performance, social impact, governance, and philanthropy across Autodesk's global operations
Vue détaillée de chaque page de diapositive, incluant la mise en page, le contenu clé et les éléments visuels.
Full-bleed cover page introducing the Autodesk FY25 Impact Report with the tagline 'Design and Make a Better World' over nature and technology imagery.
Full-bleed hero image with dark overlay, centered headline, top-left Autodesk logo, bottom report title and year
Executive letter from President and CEO Andrew Anagnost articulating how Autodesk integrates sustainability into its core business strategy.
Two-column layout with executive portrait photo left and letter text right, CEO signature, pull quote highlighted in Autodesk blue
Snapshot of Autodesk's business — 2D/3D design, engineering, and entertainment software serving AEC, D&M, and M&E markets with ~11,000 employees and 4M+ subscribers.
Icon-driven infographic grid with large numerical callouts, three industry sector columns (AEC, D&M, M&E), headline stats bar
Overview of Autodesk's ESG framework organized into four pillars: Improve Our Operations, Partner with Customers, Transform Industries, and Operate with Integrity.
Four-quadrant grid with icon, pillar name, and one-line description per quadrant; connecting visual to show integrated strategy
Summary scorecard comparing FY25 sustainability goals against actual performance across key KPIs for all four ESG pillars.
Table or scorecard layout with goal, status indicator (on track / achieved / in progress), and actual metric per row
High-level summary of Autodesk's FY25 environmental footprint including Scope 1, 2, and 3 GHG emissions, energy use, water withdrawal, and waste diversion data.
Dashboard-style layout with multiple data visualization tiles — bar charts, donut charts, and large headline figures per environmental category
Visual representation of Autodesk's science-based climate targets and the projected GHG emission reduction pathway through 2030 and beyond.
Full-width line chart showing historical emissions baseline and future reduction trajectory with labeled milestones and target years
Detailed analysis of Autodesk's energy consumption by source, highlighting the percentage from renewable energy and office energy consumption data.
Split layout with donut chart for renewable vs. non-renewable energy mix left, bar chart for office energy by region right
Water withdrawal volumes and waste diversion rates across Autodesk operations, demonstrating progress toward zero-waste and water stewardship goals.
Two-panel layout with water metrics left (total withdrawal, reduction %) and waste metrics right (diversion rate, landfill vs. recycled donut chart)
Full-page section opener for the 'Improve Our Operations' pillar featuring bold photography and white overlay typography.
Full-bleed section divider with dark photo overlay, large section title in white bold type, pillar icon or number indicator
Total Recordable Incident Rate (TRIR) and Days Away Restricted or Transferred (DART) rates for FY25, benchmarked against industry standards.
Data-focused layout with two large KPI callout boxes (TRIR and DART rates), supporting bar chart trend line, and H&S program description text
Overview of Autodesk's employee wellbeing programs covering mental health, financial wellness, and benefits designed to support a thriving workforce.
Icon-grid overview with three to four wellbeing program pillars, supporting photography, and short descriptive text per program category
Workforce composition data by gender and ethnicity broken down by region, providing transparency on representation across Autodesk's global employee base.
Data table with gender and ethnicity breakdown columns by geography, supplemented by percentage bar charts or donut charts
Description of Autodesk's pay equity methodology and FY25 results, demonstrating commitment to equitable compensation across gender and race/ethnicity.
Text-heavy methodology description on left with key result statistics highlighted in callout boxes on right; small supporting icons
Autodesk's 'Flex Forward' hybrid work principles enabling employee flexibility, with satisfaction data showing employee sentiment on the policy.
Split layout with policy principles list left and employee satisfaction score / survey data visualization right; workplace photography background
Overview of MacLearning platform and partnerships with LinkedIn Learning, Harvard Business Publishing, and O'Reilly benefiting 11,500+ employees.
Platform-centered layout with partner logos (LinkedIn, HBP, O'Reilly), stat callout for employees reached, and program description text blocks
Details on the Manager Essentials program reaching 190 managers globally, plus mentorship initiatives supporting leadership development.
Program highlight layout with 190 managers stat callout, program module description list, mentorship program summary, and manager photography
FY25 employee community impact data: 30,400 volunteer hours, $2.6M in employee giving, and 32% employee participation in giving programs.
Three large KPI callout boxes (volunteer hours, giving amount, participation rate) with supporting photography and program description text
Overview of Autodesk's pro bono services and tech community programs enabling nonprofits and social innovators to access design and engineering tools.
Program description layout with pro bono use-case examples, beneficiary organization logos or photos, and impact metrics
FY25 employee engagement score of 83 — top 10th percentile globally — and voluntary turnover rate of 8.3%, reflecting a highly engaged workforce.
Two main KPI callout boxes (engagement score 83, turnover 8.3%) with benchmark comparator bar, trend chart, and Gallup/benchmark reference
Full-page section opener for the 'Partner with Customers' pillar, showcasing Autodesk software in use across design and construction contexts.
Full-bleed section divider with software-in-use photography, dark overlay, large white section title, pillar icon
Key insights from Autodesk's survey of 3,000+ industry leaders on sustainability priorities, technology adoption, and the future of design and manufacturing.
Report cover thumbnail left, key findings as numbered or bulleted callouts right, with supporting data percentages highlighted in blue
Survey finding that 65% of industry leaders say AI is very or extremely important for achieving sustainability goals, with adoption trend data.
Large 65% headline stat centered, supporting bar chart of AI importance by sector, brief trend commentary text block
Data showing 44% of industrial machinery companies are already using AI, illustrating accelerating AI adoption in manufacturing sectors.
44% large callout stat with supporting donut or bar chart of AI adoption by manufacturing subsector, brief narrative text
Overview of Autodesk's Architecture, Engineering and Construction software portfolio including Forma, BIM 360, and Construction Cloud and their sustainability capabilities.
Three-column product grid (Forma, BIM 360, Construction Cloud) with product screenshot thumbnails, capability bullets, and sustainability feature highlights
Deep-dive on Autodesk Forma as an AI-powered tool for sustainable urban planning, enabling early-stage environmental analysis in architectural design.
Product spotlight with large Forma software screenshot, key feature callouts, sustainability metrics enabled by tool, customer quote or stat
Autodesk Insight enables architects and engineers to optimize building energy performance, daylighting, and sustainability scores during the design phase.
Product screenshot dominant with annotated energy analysis overlays, key metrics enabled (energy use intensity, daylighting %, sustainability score), feature list
Autodesk Construction Cloud reduces rework, enables digital twins, and improves project management to lower material waste and carbon on construction projects.
Product screenshot left with three to four benefit callout columns right (rework reduction, digital twin, waste metrics, cost savings), supporting data stats
Case study on how Autodesk tools were used for 3D scanning and digital reconstruction of Notre-Dame de Paris, enabling precise and sustainable restoration.
Full-bleed Notre-Dame photography with inset 3D scan/digital model screenshots, customer story headline, key tools used list, and project stats
Overview of Autodesk Fusion Industry Cloud as the integrated platform for product design and manufacturing, enabling sustainable and efficient production workflows.
Industry Cloud ecosystem diagram with Fusion at center, connected modules arranged radially, D&M sector stats, and product screenshot
Customer examples demonstrating how Autodesk Fusion is used for lightweight, sustainable product design — reducing material use and embodied carbon in manufactured goods.
Two to three customer example tiles with product photography, customer name/industry, sustainability outcome stat, and Fusion feature used
Additional D&M customer applications in automotive and consumer goods sectors demonstrating sustainability improvements enabled by Autodesk tools.
Split-page layout with automotive application left and consumer goods right, each with customer photo, stat callout, and product design output visual
Overview of how Autodesk's Media & Entertainment tools shift production to cloud-based workflows, reducing on-premise hardware energy consumption and travel-related emissions.
M&E sector header with cloud workflow diagram, energy reduction stat callout, product thumbnail (Maya, Arnold, Flow), and sector photography
Spotlight on z-emotion AI technology exploring emotional intelligence applications in media content creation and personalization.
Technology spotlight layout with conceptual AI/emotion visualization, technology description text, and use-case examples in media
Survey finding that 71% of M&E leaders believe AI will enhance rather than replace their industry, with implications for Autodesk's product strategy.
Large 71% stat callout centered, supporting sentiment data chart, brief narrative on AI opportunity in M&E, and product alignment note
Introduction to the Autodesk Education Ecosystem and its mission to prepare the next generation of designers, engineers, and makers with technology skills.
Ecosystem overview diagram with student photography, key program categories (K-12, higher ed, workforce), and headline impact stats
Tinkercad browser-based 3D design platform enables K-12 students to learn design thinking and 3D modeling without specialized hardware.
Product screenshot dominant with student user photography, key accessibility features highlighted, and student engagement statistics
Autodesk's combined soft-skills and technical curriculum framework equipping students with both professional competencies and design tool proficiency.
Dual-column layout with soft skills (mindset) left and technical skills (skillset) right, connecting framework diagram, and student outcome examples
Autodesk's partnership with WorldSkills prepares students and young professionals for global skills competitions in design and manufacturing categories.
WorldSkills logo prominent, competition photography, partnership scope description, countries and competitors reached stats
Launch of the Autodesk Certified Expert AI certification with 100+ certified professionals now credentialed in AI-powered manufacturing workflows.
Certification badge graphic prominent, 100+ professionals stat callout, certification pathway description, and manufacturing professional photography
Quantitative reach of the Autodesk for Education platform — number of students, educators, and institutions with access to Autodesk software.
Three-stat dashboard (students, educators, institutions) with large number callouts, supporting bar charts by region or year, and platform screenshot
Case studies from universities and vocational schools demonstrating how Autodesk software transforms design and engineering education outcomes.
Two-column case study layout with institution photo/logo, challenge description, Autodesk solution used, and quantified outcome
Access programs targeting underserved communities to ensure equitable access to Autodesk design tools and technology education regardless of economic background.
Program overview with access program icons, underserved community photography, equity metric callouts, and program description text blocks
Autodesk's partnerships with Historically Black Colleges and Universities (HBCUs) and community colleges to expand design technology access for underrepresented students.
Partner institution logos displayed, partnership scope description, student diversity stats, and campus photography
Youth-focused programs including makerspace initiatives and robotics clubs that introduce design and engineering concepts to younger students.
Program photography dominant with youth participants, makerspace/robotics setup visuals, program description tiles, and youth engagement stats
Programs supporting teachers and instructors with professional development training to effectively integrate Autodesk tools into their curricula.
Professional development program layout with educator photography, training module icons, completion rate stats, and testimonial quote
New online courses and certifications expand Autodesk's educational reach globally, enabling self-paced learning for design and engineering students worldwide.
Online learning platform screenshot with new course tiles, enrollment stats, certification pathway diagram, and global reach map
Collaboration with industry partners to co-develop curricula that align design and engineering education with real-world workplace skill requirements.
Partner company logos displayed with curriculum co-development diagram, skills alignment description, and industry-education bridge visual
World map visualization of the geographic extent of Autodesk's education programs, highlighting reach across all major regions and developing markets.
Full-width world map with region heat map or pin indicators, regional student count callouts, and total global reach headline stat
Autodesk-sponsored student competitions and innovation showcases recognize and amplify outstanding student projects using Autodesk design tools.
Competition photography with winning project visuals, competition name and scope, student winners' profiles, and prize or recognition stat
Structured career pathway programs connect Autodesk education completers with employment opportunities in AEC, D&M, and M&E industries.
Career pathway flow diagram from education to employment, industry sector destination icons, employer partner logos, and employment outcome stats
Quantitative summary of education program impact including total students served, course completion rates, and certification volumes across FY25.
Metrics dashboard with four to five KPI tiles (students served, completion rate, certifications issued, institutions partnered, educators trained)
First-person quotes from educators and students describing the impact of Autodesk education programs on their skills development and career trajectories.
Two to three testimonial cards with portrait photo, name, institution, quote text, and outcome description per card
Forward-looking summary of upcoming education initiatives, platform expansions, and partnership goals planned for the next one to three years.
Timeline or roadmap visual with future initiative milestones, brief description per initiative, and strategic education priority icons
Consolidated data table summarizing all key education program metrics for FY25, providing a single-page reference for education performance.
Summary data table with rows by program/initiative and columns for key metrics, with totals row and comparison to prior year column
Full-page section opener for the 'Transform Industries' pillar featuring impactful imagery of industry transformation and innovation.
Full-bleed section divider with dark photo overlay, large white section title, pillar icon or number indicator
Introduction to the Autodesk Foundation and its $14.5M in strategic philanthropy deployed in FY25 to advance sustainable design and economic opportunity.
Foundation logo and mission statement centered, $14.5M stat callout prominent, brief strategy description, and global reach teaser
Autodesk Foundation operates in 112 countries and has reached 15M+ individuals through grants, in-kind software, and capacity building programs.
World map with country coverage shading, 112 countries and 15M+ individuals headline stats, regional breakdown of grantee distribution
Autodesk Foundation grantees have collectively reduced 1.4M metric tons of CO2e and created or supported 170,000+ jobs through design-led innovation.
Two large impact KPI tiles (1.4M metric tons CO2e, 170,000+ jobs) with supporting grantee portfolio overview and impact pathway diagram
The Foundation's Energy & Materials portfolio alone reduced 880,000 metric tons of CO2e in 2024, representing a major portion of the overall climate impact.
880,000 metric ton headline stat with portfolio breakdown donut chart, top grantee examples, and energy/materials technology photography
Spotlight profiles of selected Autodesk Foundation grantee organizations with descriptions of their mission, funding received, and achieved outcomes.
Three to four grantee profile tiles with organization name, photo or logo, mission description, grant amount, and key impact metric per tile
$9.8M in Autodesk software donated in-kind to nonprofits, with 90% of Foundation portfolio organizations benefiting from access to design and engineering tools.
$9.8M headline stat and 90% coverage stat as dual callouts, grantee software use photography, donation program description
Autodesk's participation in COP29 and climate commitments made at the conference, reinforcing corporate climate action and industry collaboration.
COP29 branding with Autodesk participation context, climate commitment highlights, conference photography or logo, and policy engagement description
Autodesk's membership in the First Movers Coalition commits the company to purchasing clean industrial materials and supporting demand signals for green manufacturing.
First Movers Coalition logo, commitment description, purchasing pledge details, and coalition member partner logos shown together
Autodesk's partnership with LA28 to support sustainable venue design and construction for the 2028 Los Angeles Olympic Games using Autodesk tools.
LA28 logo and Olympics rings branding, venue design visualization, partnership scope description, and sustainability design goal callouts
Autodesk's High Performance Teams research initiative explores how collaborative team dynamics in design and construction influence project sustainability outcomes.
Research program description with HPT framework diagram, key findings callouts, research partner logos, and design team photography
Partnership with Cosmic Robotics advances space-grade manufacturing innovation, demonstrating Autodesk tools at the cutting edge of precision manufacturing.
Partnership spotlight with Cosmic Robotics branding, space manufacturing photography, technical application description, and innovation stat callout
Green Canopy NODE uses Autodesk tools for sustainable modular housing research, exploring how design software can advance affordable and low-carbon housing construction.
Green Canopy NODE project photography, modular housing visualization, Autodesk tools used, and sustainability outcome metrics per home built
Autodesk's advocacy activities for sustainable construction standards and climate-aligned public policy, including regulatory engagement and industry coalition leadership.
Policy engagement overview with advocacy focus areas list, coalition membership logos, policy geography map, and regulatory engagement stats
Full-page section opener for the 'Operate with Integrity' pillar featuring corporate governance and trust imagery.
Full-bleed section divider with dark photo overlay, large white section title, pillar icon or number indicator
Overview of Autodesk's Board of Directors composition, committee structure, and governance framework ensuring accountability and shareholder representation.
Board structure org chart with committee names, director count per committee, and governance principles summary text
Quantitative data on Autodesk Board of Directors diversity by gender, ethnicity, and independence, reflecting commitment to diverse and independent governance.
Board diversity donut charts (gender, ethnicity, independence) with percentage callouts and director names/bios listed below
Overview of Autodesk's cybersecurity posture, including frameworks adopted, certification status, and organizational structure for security governance.
Security framework icons (ISO, SOC, NIST), posture overview description, organizational security team structure, and certification badges
Description of Autodesk's cybersecurity tools, team capabilities, and incident response preparedness investments to protect customer and company data.
Investment category tiles (tools, team, incident response, training) with brief descriptions, investment trend line, and security metric callouts
Autodesk's privacy program covering GDPR and CCPA compliance, data minimization practices, and customer data protection commitments.
Compliance framework logos (GDPR, CCPA), privacy principle list, data minimization description, and privacy program team overview
Autodesk's published framework for ethical AI development and deployment, covering fairness, transparency, accountability, and human oversight principles.
AI principle pillars displayed as icon cards (fairness, transparency, accountability, safety, privacy), brief description per principle, and framework diagram
Autodesk's internal AI governance review processes, including bias detection methodologies and cross-functional review board oversight of AI product features.
AI governance process flow diagram, review board structure description, bias detection methodology overview, and governance metric callouts
Autodesk's human rights policy and supply chain due diligence procedures aligned with international human rights standards and responsible sourcing principles.
Policy statement summary, due diligence process steps, international standard references (UN Guiding Principles), and supply chain scope description
Overview of Autodesk's Code of Conduct, ethics training completion rates, and compliance program designed to foster a culture of integrity.
Code of Conduct cover thumbnail, training completion rate callout, compliance program component list, and ethics hotline stats
Autodesk's supplier procurement standards requiring environmental and social responsibility commitments from all key suppliers in the value chain.
Supplier requirements framework with ESG criteria list, supplier onboarding flow, assessment methodology, and compliance rate callout
Autodesk's supplier diversity initiative tracking and growing spend with diverse-owned suppliers including minority, women, and veteran-owned businesses.
Diverse supplier spend stat callout, supplier category breakdown chart, diversity certification types accepted, and program description
Description of Autodesk's anti-corruption and anti-bribery policies aligned with the UK Bribery Act, US FCPA, and global compliance standards.
Policy summary with regulatory reference list (UK Bribery Act, FCPA), training completion stat, policy scope description, and compliance icon
Autodesk's whistleblower program and speak-up culture initiatives that provide confidential reporting channels and protect employees who raise concerns.
Reporting channel icons (hotline, web, email), speak-up culture principles, non-retaliation policy summary, and reports-received stat
Summary of Autodesk's regulatory compliance obligations across major jurisdictions, including environmental, labor, data privacy, and trade compliance areas.
Compliance domain tiles (environmental, labor, privacy, trade) with regulatory references per domain and compliance status indicators
Autodesk's third-party risk management framework for assessing and monitoring ESG and security risks in vendor and partner relationships.
Risk management process flow (identify, assess, monitor, remediate), vendor risk tier categories, assessment tool description, and risk stat callouts
Autodesk's data governance framework ensuring data quality, classification, access controls, and lifecycle management across the company.
Data governance framework diagram with classification tiers, access control description, lifecycle management flow, and data stewardship roles
Programs and commitments Autodesk makes to customers around data protection, product reliability, security transparency, and trust-building practices.
Customer trust commitment tiles (data protection, reliability SLAs, security transparency, support) with customer trust stat and testimonial quote
Overview of the external reporting frameworks Autodesk aligns to including GRI Standards, SASB, and TCFD, ensuring consistent and comparable ESG disclosure.
Framework logos (GRI, SASB, TCFD) with brief description per framework, alignment statement, and cross-reference table to appendix
Consolidated summary of key governance metrics and integrity program highlights from the Operate with Integrity section.
Summary KPI dashboard with governance metrics tiles, section highlights list, and forward-looking integrity commitment statement
Full-page appendix section opener introducing supplemental data tables, assurance statements, and index disclosures.
Full-bleed section divider with appendix title in bold, understated design with minimal photography and clean typographic treatment
Autodesk's FY25 third-party sustainability ratings: MSCI AAA rating, Bloomberg ESG score of 5.31/10, and CDP score of 8.
Three rating agency tiles (MSCI, Bloomberg, CDP) each with logo, score callout, and brief interpretation; arranged in a row or grid
Comprehensive GRI Standards disclosure index table mapping Autodesk's FY25 report content to specific GRI disclosure numbers and topics.
Multi-row index table with columns: GRI disclosure number, topic name, location in report (page reference), and omission notes if applicable
Detailed Scope 1, 2, and 3 GHG emissions data broken down by geographic region for FY25, with prior year comparisons.
Multi-row data table with region rows, Scope 1/2/3 columns, metric ton CO2e units, and prior year comparison column
Energy consumption data by source type (natural gas, electricity, renewable energy) broken down by geographic region for FY25.
Data table with energy source rows, regional columns, MWh/GJ units, renewable percentage summary row at bottom
Water withdrawal data by source and region for FY25, with year-over-year comparison and water stress area identification.
Data table with water source rows, region columns, cubic meter units, water-stress flagging column, and year-over-year column
Waste generation, diversion, and disposal data by waste type and region, including landfill, recycling, and composting volumes.
Data table with waste type rows (recycled, composted, landfill, hazardous), regional columns, metric ton units, and diversion rate summary
Detailed Scope 3 GHG emissions breakdown by category (business travel, employee commute, supply chain, product use) with methodology notes.
Scope 3 category table with category name, metric ton CO2e value, calculation methodology note, and data boundary description per row
Environmental intensity ratios (GHG per employee, energy per employee, water per employee) enabling comparability across years and peer benchmarking.
Intensity metrics table with metric name, numerator, denominator (employees/revenue), FY25 value, and prior year comparison
Consolidated environmental performance summary table spanning multiple years to enable trend analysis across all key environmental metrics.
Multi-year summary table with metrics as rows and fiscal years as columns, CAGR or trend direction indicator column at right
Detailed workforce headcount and percentage breakdown by gender across all geographic regions for FY25.
Data table with region rows, gender columns (male, female, non-binary/undisclosed), headcount and percentage values, and global totals row
Ethnicity data for Autodesk's US workforce broken down by role level (individual contributor, manager, director, VP+), enabling representation analysis.
Data table with ethnicity rows, role level columns, percentage values, year-over-year change column, and EEO-1 category footnote
New hire rates and voluntary/involuntary turnover rates by gender, age group, and region for FY25.
Two-section data table — new hire rates above and turnover rates below — with demographic breakdown columns and global rate summary
Full health and safety incident data including total recordable incidents, lost time incidents, fatalities, and near misses by region for FY25.
H&S incident data table with incident type rows, region columns, and rate per 200,000 hours worked normalization; fatalities row highlighted
Employee learning and development hours by program type, gender, and role level, demonstrating investment in workforce skill development.
Learning hours data table with program type rows, gender/role level columns, total hours and average hours per employee metrics
Consolidated multi-year social performance summary table covering workforce, H&S, giving, and learning metrics for trend analysis.
Multi-year summary table with social metrics as rows, fiscal year columns, and year-over-year change indicators
Detailed board composition table listing director names, tenure, committee memberships, independence status, and demographic information.
Director roster table with name, tenure, committee columns, independence flag, and gender/ethnicity demographic columns
CEO pay ratio data and executive compensation structure summary for FY25, disclosing the ratio of CEO to median employee compensation.
CEO pay ratio callout stat, compensation structure description, SEC-required disclosure format, and methodology note
Index of Autodesk's major corporate policies with publication dates, scope, and links or references to publicly available policy documents.
Policy index table with policy name, publication/revision date, scope coverage, and availability (public/internal) per row
Quantitative ethics and compliance metrics including Code of Conduct training completion rates, ethics hotline report volumes, and investigation outcomes.
Compliance metrics table with metric name, FY25 value, prior year value, and target/benchmark columns
Consolidated multi-year governance performance summary table covering board, compliance, and integrity metrics for FY25 trend analysis.
Multi-year summary table with governance metrics rows, fiscal year columns, and trend direction indicators
Independent third-party assurance statement verifying the accuracy and completeness of selected environmental and social data disclosed in the FY25 Impact Report.
Assurance provider name and logo, statement of scope and standards applied (ISAE 3000 or equivalent), conclusions paragraph, and assurance provider signature
Table mapping Autodesk's FY25 impact activities and metrics to the relevant United Nations Sustainable Development Goals (SDGs).
SDG icon grid with relevant SDG numbers shown, each linked to corresponding Autodesk program or data with brief description
Closing back cover page with the 'Design and Make a Better World' tagline, Autodesk website URL, and legal disclaimers for the report.
Full-bleed back cover with Autodesk logo, tagline centered, website URL, copyright line, and disclaimer text footer
Questions courantes sur cette diapositive et le contenu de présentation sous-jacent.
The Autodesk FY25 Impact Report is a 113-page corporate sustainability and ESG annual report covering Autodesk's environmental performance, social programs, governance practices, and philanthropic impact for fiscal year 2025. It is organized around four pillars: Improve Our Operations, Partner with Customers, Transform Industries, and Operate with Integrity.
The Autodesk FY25 Impact Report aligns to GRI Standards, SASB, and TCFD frameworks, and includes a UN SDG alignment table. Selected data is independently verified by a third-party assurance provider using ISAE 3000 or equivalent standards. A comprehensive GRI disclosure index is included in the appendix.
Autodesk received an MSCI ESG rating of AAA (the highest possible), a Bloomberg ESG score of 5.31/10, and a CDP score of 8 in FY25, reflecting strong performance across third-party sustainability assessment frameworks.
The report discloses Scope 1, 2, and 3 GHG emissions by region and category, energy consumption by source (including renewable energy percentage), water withdrawal by source and region, and waste generation and diversion rates — all with multi-year comparisons and intensity ratios per employee.
This 113-page template provides a complete structure for corporate ESG reporting including cover design, executive letter, company overview, KPI summary scorecard, environmental performance dashboards, workforce DEI data tables, governance disclosures, appendix data tables, assurance statements, and SDG alignment — making it an ideal reference for technology companies designing their own annual impact or sustainability report.
Social disclosures include global workforce demographics by gender and ethnicity, pay equity analysis, Total Recordable Incident Rate and DART health and safety data, employee engagement score (83, top 10th percentile globally), voluntary turnover (8.3%), learning hours by program type, 30,400 volunteer hours, $2.6M employee giving, and Manager Essentials program completion data for 190 managers.
The Autodesk Foundation is Autodesk's strategic philanthropy arm that deployed $14.5M in grants and $9.8M in in-kind software donations in FY25 across 112 countries, reaching 15M+ individuals. Its grantees collectively reduced 1.4M metric tons of CO2e and created or supported 170,000+ jobs, with the Energy and Materials portfolio alone accounting for 880,000 metric tons CO2e reduced.

Create Your Own Slides
Turn your ideas into professional presentations in seconds with 2slides AI.
Référencez des conceptions professionnelles, choisissez votre style et générez des diapositives avec un rendu de texte parfait. Alimenté par Nano Banana—commencez à créer votre présentation maintenant.
Votre Agent IA pour les diapositives. Gagnez du temps, brillez plus vite avec la création intelligente de présentations.




© 2026 2slides. Tous droits réservés.