
Kuulub kogumikku Investoresitluste näited
Quanta Computer Q3 2026 Earnings Presentation is the English-language "FY2026 Q3 Financial Results" deck dated 11 November 2026, filed on Taiwan's Market Observation Post System (MOPS) for the investor conference (法說會); a Chinese version also exists. It is a short six-slide financial deck: a cover, a safe harbor notice, three tables (3Q26 income statement, 9M26 income statement, balance sheet) and a Q&A contact slide. Amounts are in NT$ (New Taiwan dollars) millions, on a Taiwan IFRSs basis.
Kasutab selle esitluse kaanepilti stiilieeskujuna slaididele, mis luuakse sinu enda sisust. Või vali allpool mõni leht ja kasuta selle paigutust eeskujuna.
Kiirnavigatsioon
Sildid
Jaga slaide
Quanta Computer Q3 2026 Earnings Presentation is the English-language "FY2026 Q3 Financial Results" deck dated 11 November 2026, filed on Taiwan's Market Observation Post System (MOPS) for the investor conference (法說會); a Chinese version also exists. It is a short six-slide financial deck: a cover, a safe harbor notice, three tables (3Q26 income statement, 9M26 income statement, balance sheet) and a Q&A contact slide. Amounts are in NT$ (New Taiwan dollars) millions, on a Taiwan IFRSs basis.
Iga slaidilehe üksikasjalik vaade, sealhulgas paigutus, põhisisu ja visuaalsed elemendid.
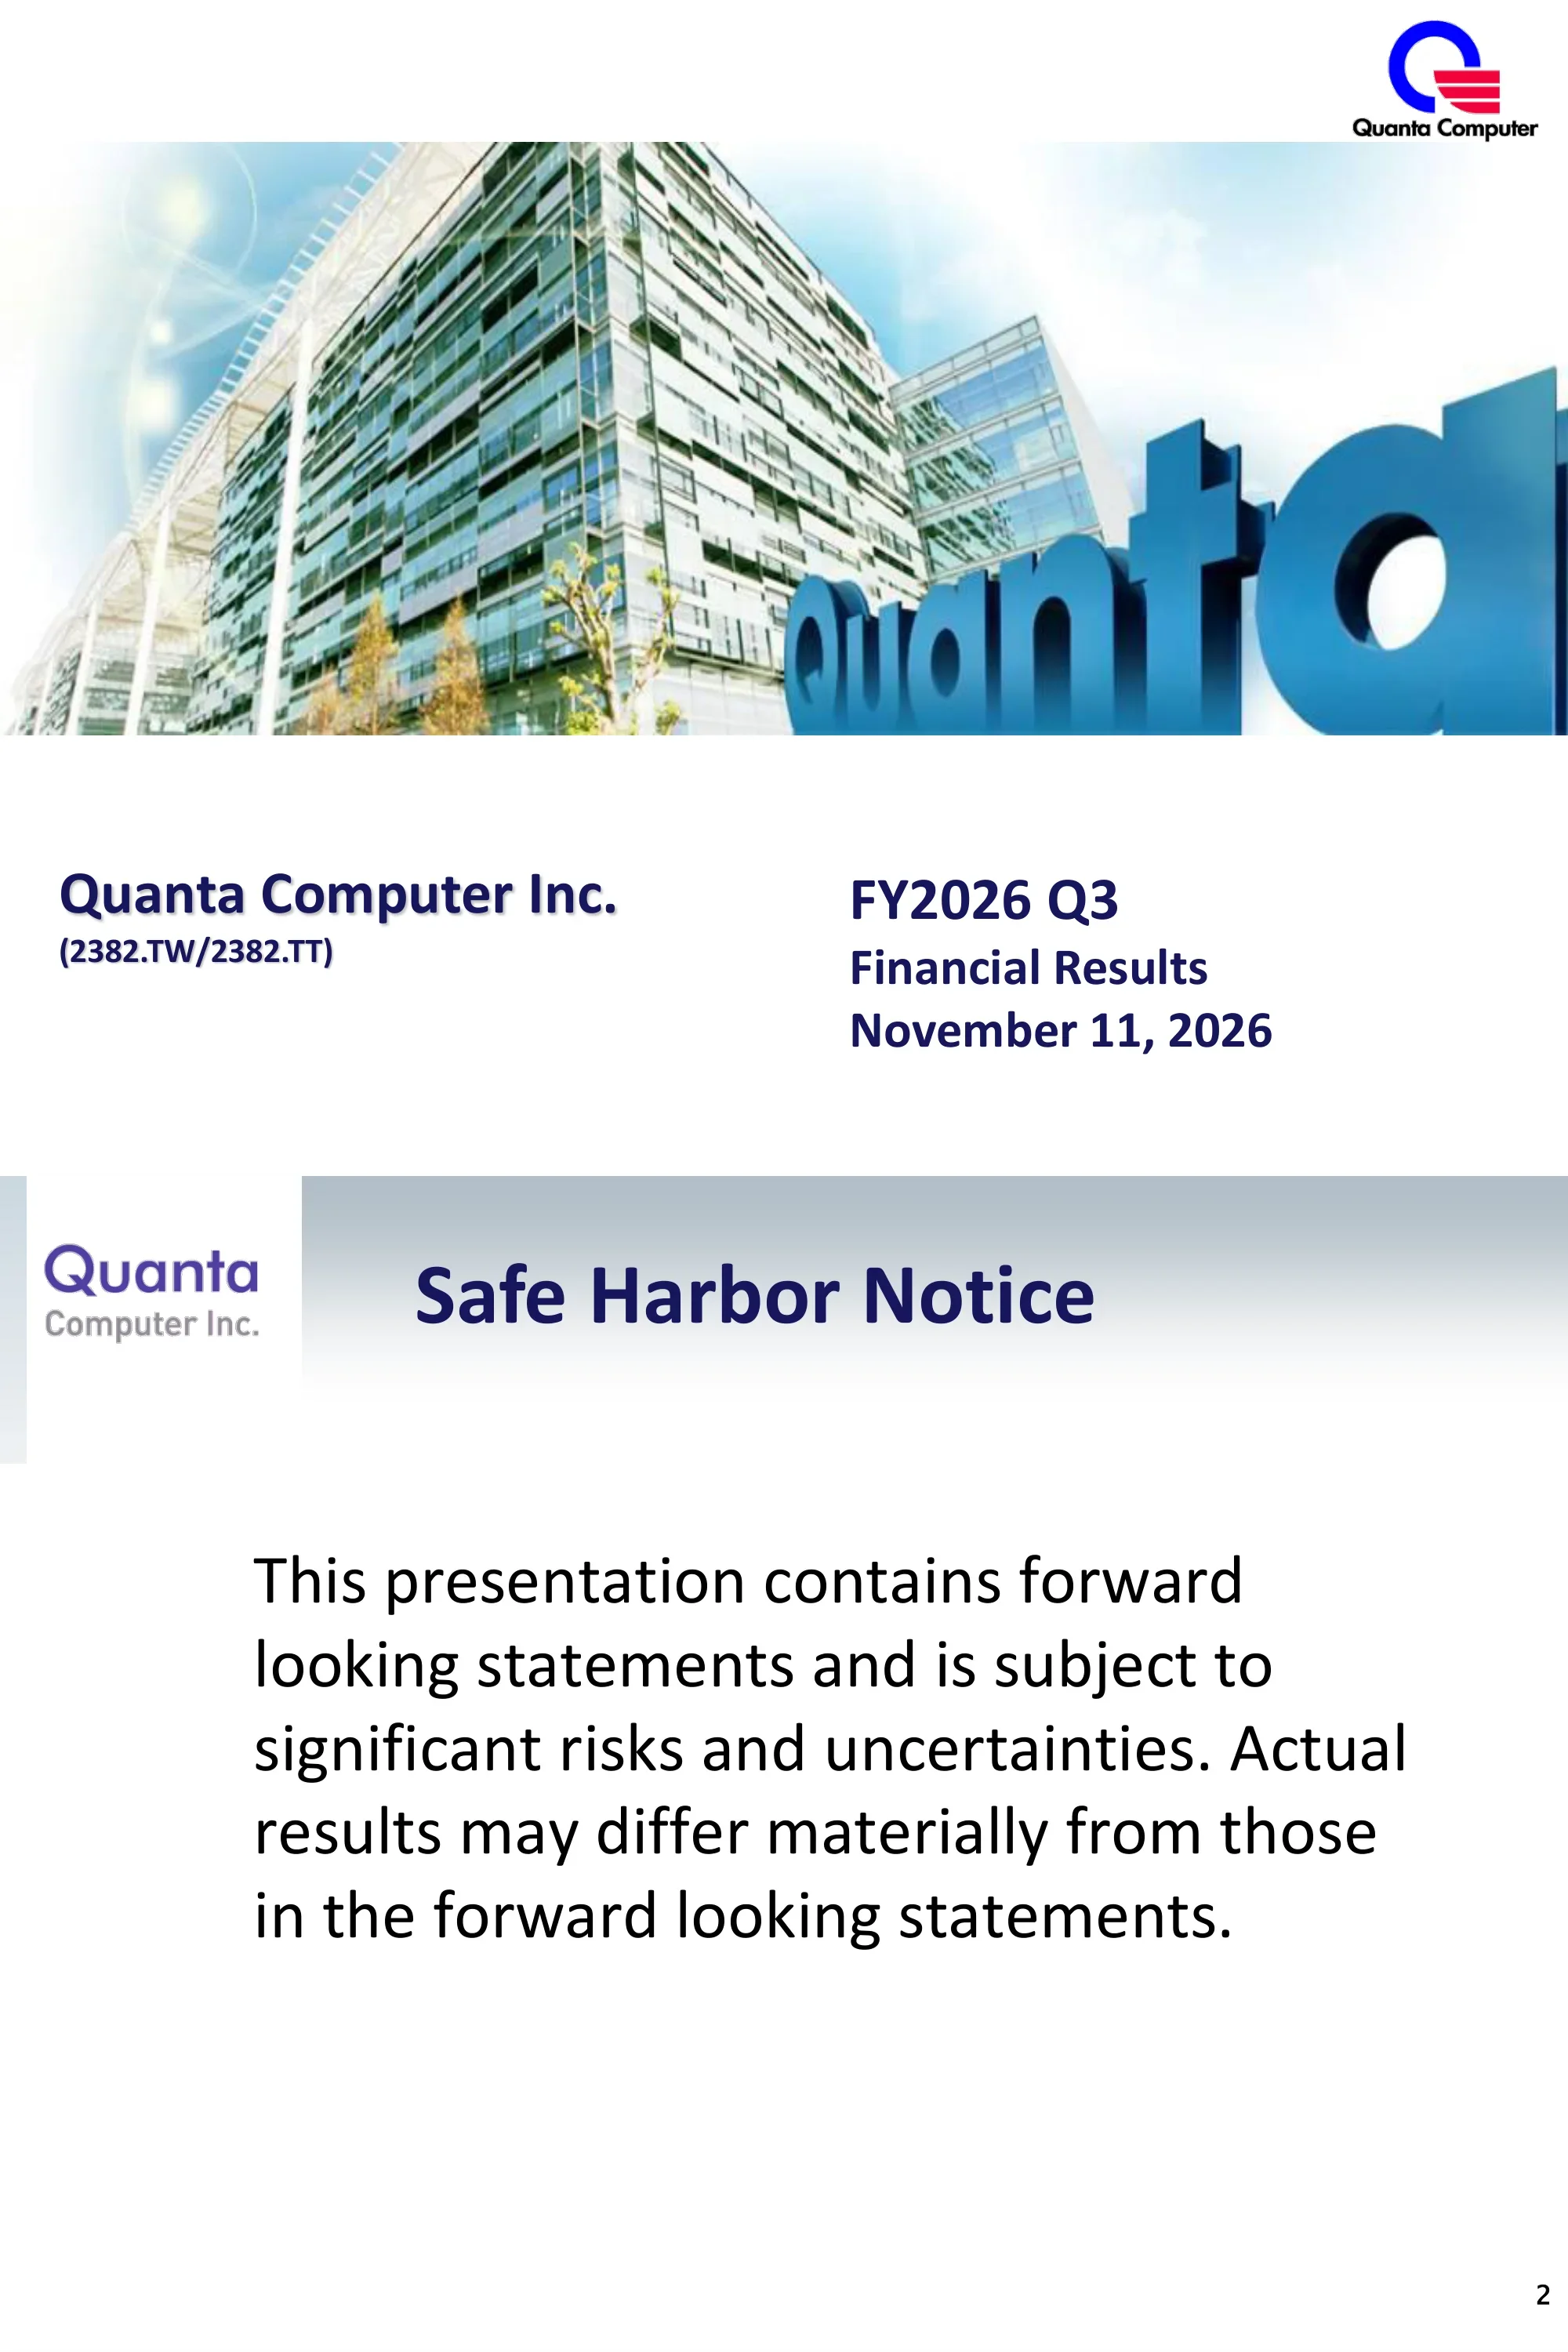
Cover slide for the Quanta Computer Inc. FY2026 Q3 financial results presentation, dated November 11, 2026. It carries the company name and its Taiwan stock codes, but no figures.
A wide photo banner of a glass office building with the large blue 3D Quanta wordmark across the middle, the logo at top right, and the company name on the lower left with the period and date on the lower right.
A single-paragraph notice stating that the presentation contains forward looking statements, is subject to significant risks and uncertainties, and that actual results may differ materially from those in the forward looking statements.
Standard content template with the logo at top left, a navy title on a grey gradient header, and one large block of body text on a white background.
Net sales were NT$1,115,545 million, up 7.6% from 2Q26 (NT$1,036,593 million) and up 125.2% from 3Q25 (NT$495,258 million). Gross profit was NT$53,024 million (4.75% margin), operating income NT$32,204 million (2.89%), pre-tax income NT$34,885 million (3.13%), and net income attributable to the parent NT$28,422 million (2.55%, down 0.8% QoQ, up 73.0% YoY). Basic EPS was NT$7.08 versus NT$7.43 in 2Q26 and NT$4.26 in 3Q25. Non-operating income was NT$2,681 million, made up of net interest of (2,294), foreign exchange of 3,903 and others of 1,073. Tax was (6,251). Footnotes say figures are Taiwan IFRSs based and give weighted average shares of 4,011,638 thousand for 3Q26 and 3,854,519 thousand for 2Q26 and 3Q25.
A full-width table with columns for 3Q26, 2Q26 and 3Q25, each with a margin percentage, plus shaded QoQ and YoY change columns; the non-operating breakdown is indented in italics, and two footnote bullets sit below.
For the first nine months of 2026, net sales were NT$2,961,358 million versus NT$1,485,052 million in 9M25, up 99.4%. Gross profit was NT$143,800 million (4.9% margin, up 33.2%), operating income NT$89,472 million (3.0%, up 41.2%), pre-tax income NT$95,983 million (3.2%, up 41.6%), and net income attributable to the parent NT$78,266 million (2.6%, up 48.3%). Basic EPS was NT$20.03 versus 13.7. Non-operating income was NT$6,511 million (net interest (6,062), foreign exchange 10,425, others 2,148) and tax was (17,255). Weighted average shares were 3,907,467 thousand for 9M26 and 3,854,519 thousand for 9M25.
Same table format as the previous slide but with only two periods (9M26 and 9M25), margin columns and a single shaded YoY column, followed by two footnote bullets.
Condensed balance sheet at 2026.09.30 versus 2026.06.30, in NT$ millions: cash and short-term investments 311,971 (from 327,205), A/R 931,786 (from 765,757), inventories 856,064 (from 790,184), total assets 2,306,025 (from 2,062,527). A/P was 1,264,874 (from 1,030,880), current liabilities 1,874,740 (from 1,705,318), total liabilities 1,949,456 (from 1,806,711), and shareholders' equity 344,162 (from 243,625). Footnotes say figures are Taiwan IFRSs based and equity excludes non-controlling interests.
A simple two-column table with line items on the left and two date columns on the right; subtotal rows (total assets, total liabilities) are in bold italics and the equity row is highlighted with a blue band.
Closing slide that opens the floor for questions and gives the company website, http://www.quantatw.com, and the investor relations email address, qci.invest@quantatw.com.
Mostly empty slide with the logo top left and a left-aligned Q&A heading followed by the website and a hyperlinked email in the middle of the page.
Levinud küsimused selle slaidi ja esitluse sisu kohta.
It is the English version of Quanta Computer's FY2026 Q3 Financial Results presentation dated 11 November 2026, filed on Taiwan's Market Observation Post System (MOPS) for the investor conference (法說會). A Chinese version also exists.
Six slides: a cover, a safe harbor notice, the 3Q26 income statement, the 9M26 income statement, a balance sheet and a Q&A slide. It contains financial tables only, with no segment, product or guidance commentary.
Net sales were NT$ (New Taiwan dollars) 1,115,545 million, up 7.6% quarter over quarter and 125.2% year over year. Net income attributable to the parent was NT$28,422 million, with basic EPS of NT$7.08.
Gross margin of 4.75%, operating margin of 2.89%, pre-tax margin of 3.13% and net margin of 2.55%, compared with 5.02%, 3.30%, 3.53% and 2.76% in 2Q26.
At 30 September 2026, total assets were NT$2,306,025 million, total liabilities NT$1,949,456 million and shareholders' equity NT$344,162 million (excluding non-controlling interests), versus NT$243,625 million of equity at 30 June 2026.
Every financial slide notes that the figures are Taiwan IFRSs based. Amounts are in NT$ millions unless stated otherwise.
Yes. For 9M26, net sales were NT$2,961,358 million (up 99.4% year over year), net income attributable to the parent was NT$78,266 million and basic EPS was NT$20.03.
It works as a minimal example: a logo-and-gradient header template, blue-banded financial tables with shaded change columns, short footnotes, and a plain closing slide with website and investor relations email.

Create Your Own Slides
Turn your ideas into professional presentations in seconds with 2slides AI.
Võta eeskuju professionaalsetest disainidest, vali oma stiil ja genereeri slaidid täiusliku tekstirenderdusega. Nano Banana jõul – alusta oma esitluse loomist kohe.
Sinu AI-agent slaidide loomiseks. Säästa aega ja sära kiiremini nutika esitluste loomisega.


© 2026 2slides. Kõik õigused kaitstud.