
Kuulub kogumikku Investoresitluste näited
Microsoft's first quarter fiscal year 2027 results presentation (October 28, 2026), a 21-slide earnings deck for the quarter ended September 30, 2026. It covers revenue of $92.3 billion up 19%, operating income of $45.9 billion up 21% at a 50% margin, net income of $36.6 billion and diluted EPS of $4.92 up 32%, Microsoft Cloud revenue of $63.9 billion up 30%, Azure growth of 48%, commercial remaining performance obligation of $677 billion up 73%, and capital expenditures up 30% to $45.2 billion with free cash flow of $18.6 billion. It is the first deck in this series to report Microsoft's two new segments, Agents and Infra and Devices and Consumer, and it closes with an eight-page appendix of product revenue and GAAP, OpenAI, constant-currency and cash-flow reconciliations.
Kasutab selle esitluse kaanepilti stiilieeskujuna slaididele, mis luuakse sinu enda sisust. Või vali allpool mõni leht ja kasuta selle paigutust eeskujuna.
Kiirnavigatsioon
Sildid
Jaga slaide
Microsoft's first quarter fiscal year 2027 results presentation (October 28, 2026), a 21-slide earnings deck for the quarter ended September 30, 2026. It covers revenue of $92.3 billion up 19%, operating income of $45.9 billion up 21% at a 50% margin, net income of $36.6 billion and diluted EPS of $4.92 up 32%, Microsoft Cloud revenue of $63.9 billion up 30%, Azure growth of 48%, commercial remaining performance obligation of $677 billion up 73%, and capital expenditures up 30% to $45.2 billion with free cash flow of $18.6 billion. It is the first deck in this series to report Microsoft's two new segments, Agents and Infra and Devices and Consumer, and it closes with an eight-page appendix of product revenue and GAAP, OpenAI, constant-currency and cash-flow reconciliations.
Iga slaidilehe üksikasjalik vaade, sealhulgas paigutus, põhisisu ja visuaalsed elemendid.
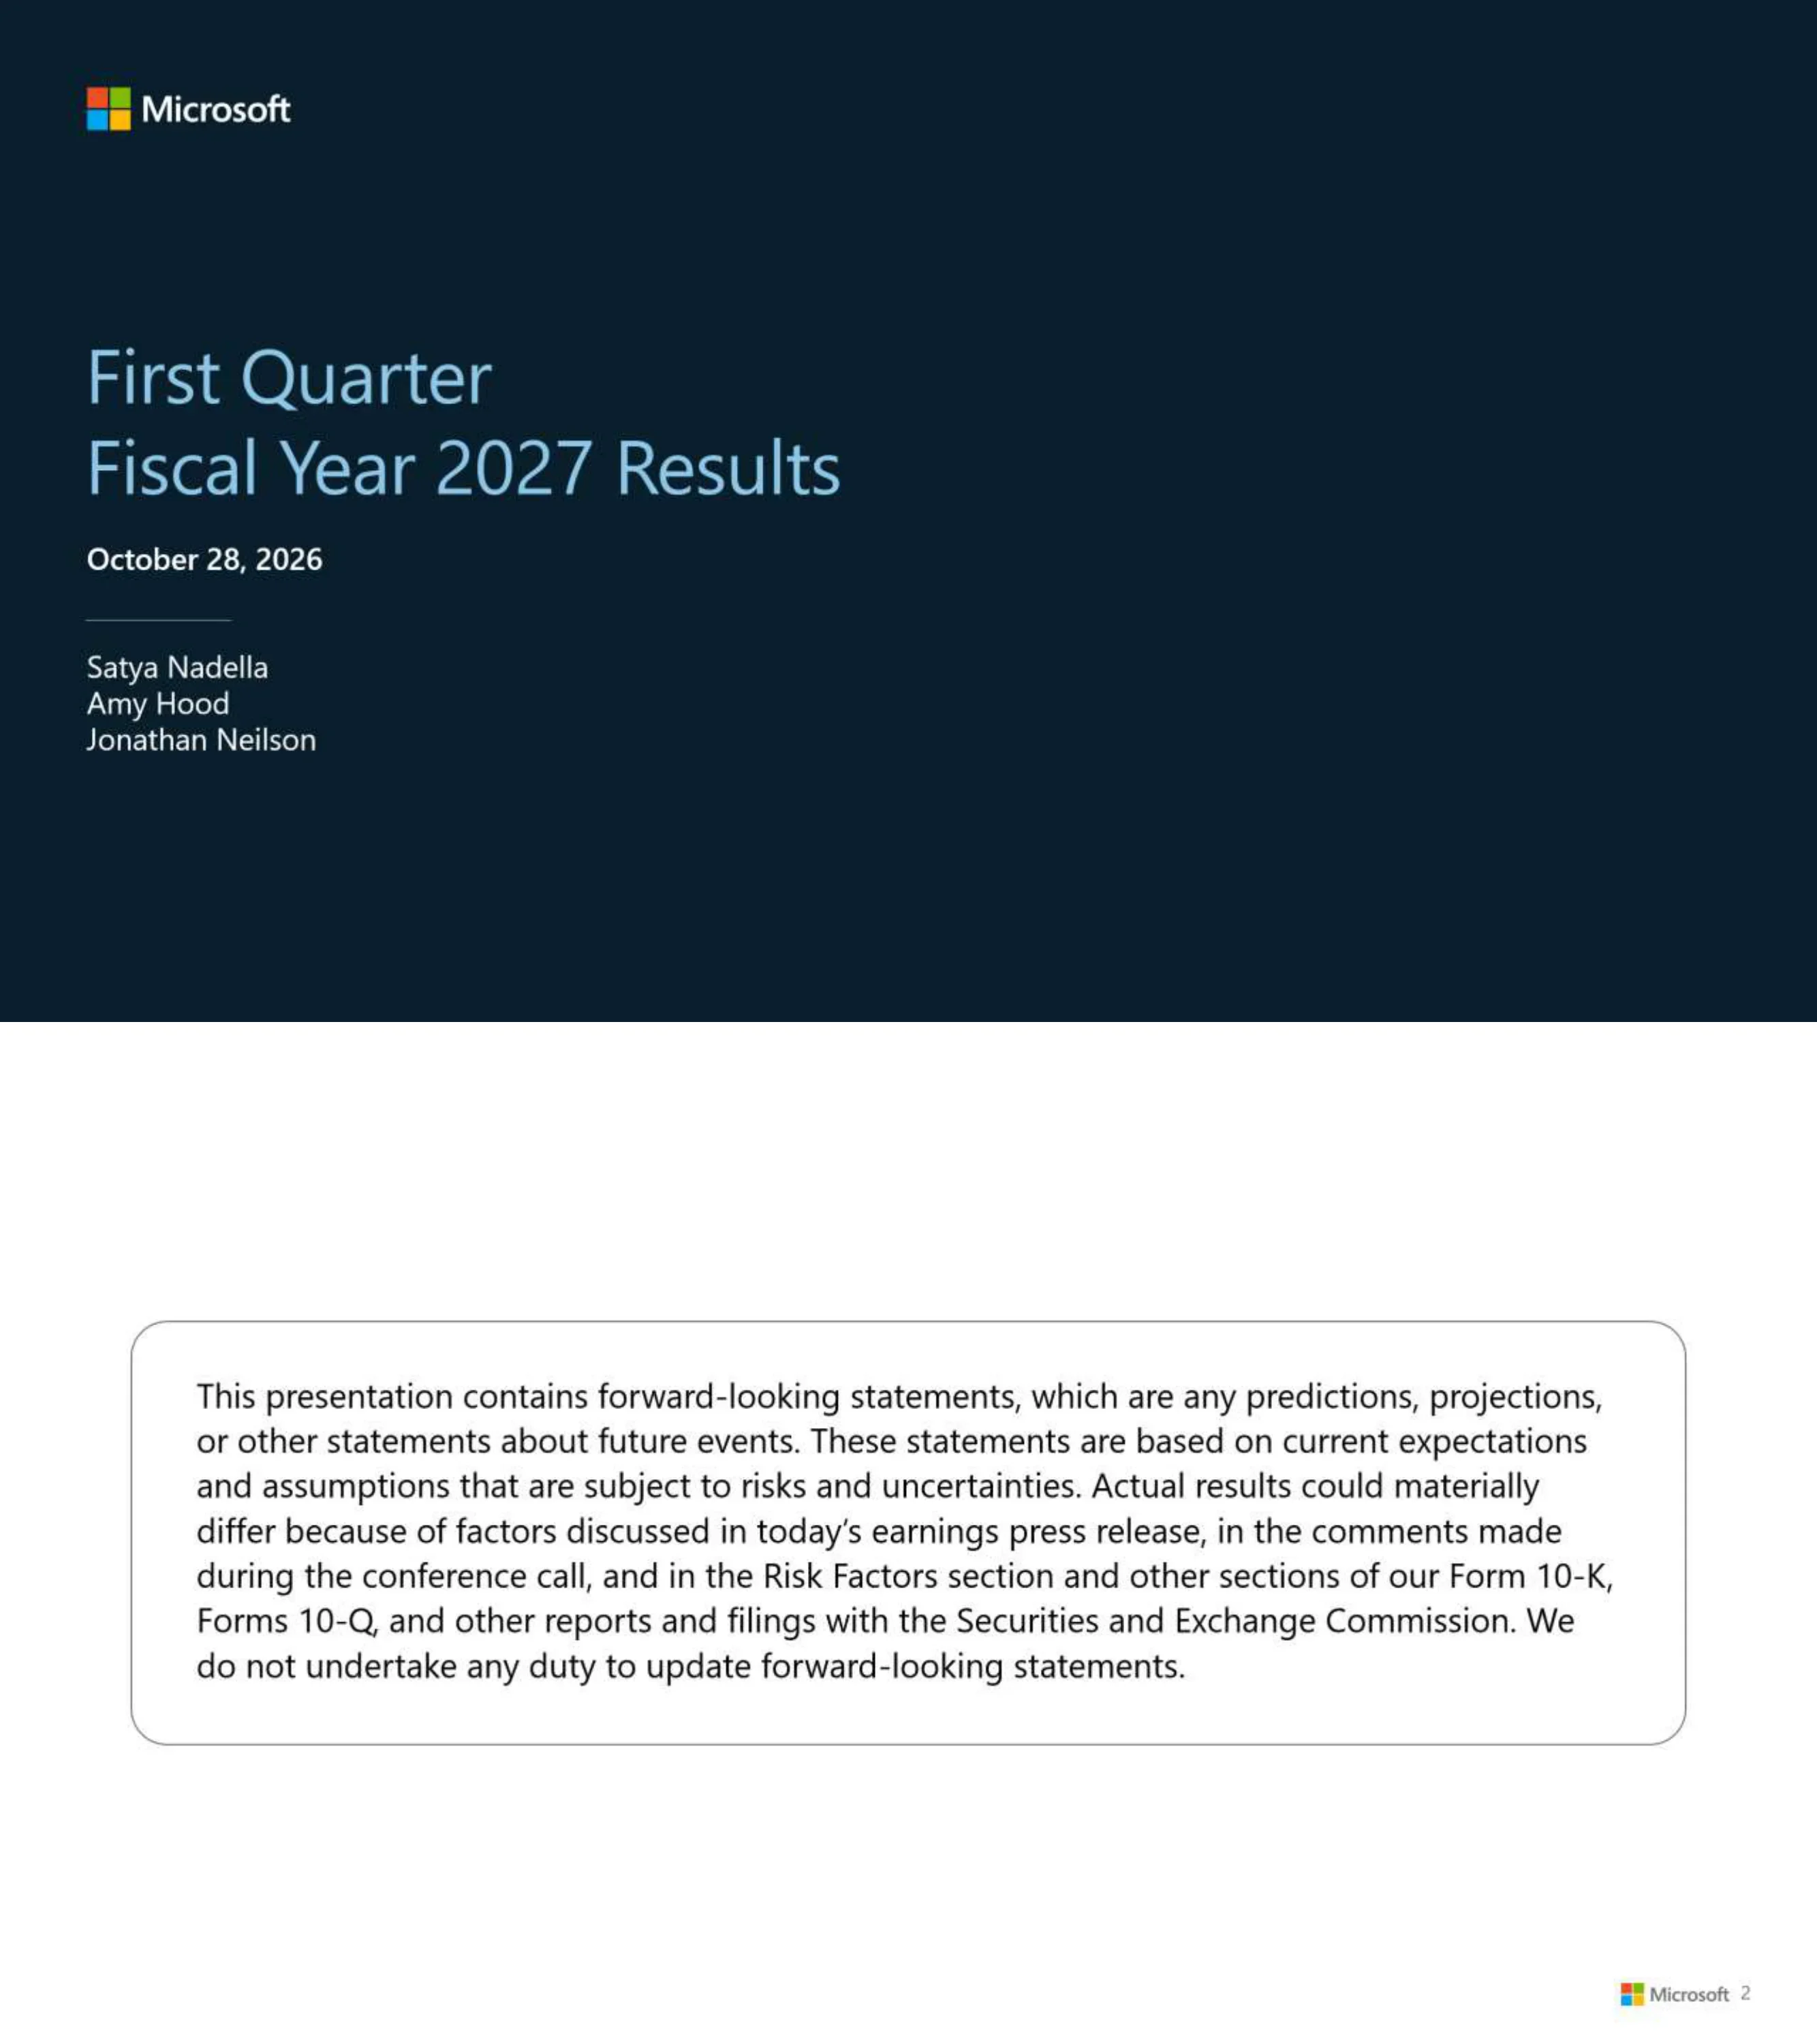
Cover slide titled 'First Quarter Fiscal Year 2027 Results', dated October 28, 2026, presented by Satya Nadella, Amy Hood and Jonathan Neilson.
Full-bleed near-black navy background, four-colour Microsoft logo top left, large light-blue two-line title left-aligned in the middle band, white date beneath, a short rule, then the three presenter names.
Safe-harbor notice: the presentation contains forward-looking statements based on current expectations and subject to risks and uncertainties; actual results could differ because of factors in the earnings press release, the conference call and the Risk Factors sections of Microsoft's Form 10-K, Forms 10-Q and other SEC filings. Microsoft does not undertake to update them.
White slide with a single rounded-corner outlined box centred on the page holding one paragraph of text; Microsoft logo and page number bottom right.
Three-part agenda: Financial Summary and Highlights; Segment Summary and Highlights; Appendix. Footnote: all growth comparisons relate to the corresponding period of the last fiscal year unless otherwise noted, and numbers may not foot due to rounding.
Wide rounded-corner box with a bold 'Agenda' label on the left, a thin vertical divider, and three agenda lines stacked on the right; italic footnote along the bottom.
The full quarter in one table ($ billions except per share), FY27 Q1 vs FY26 Q1: Agents and Infra $76.8 vs $61.7, up 25% (25% CC); Devices and Consumer $15.5 vs $16.0, down 3% ((3)% CC); revenue $92.3 vs $77.7, up 19%; cost of revenue $29.7 vs $24.0, up 24%; gross margin $62.6 vs $53.6, up 17%, gross margin percentage 68% vs 69%, down 1 point; operating expense $16.6 vs $15.7, up 6%; operating income $45.9 vs $38.0, up 21% (22% CC), operating income percentage 50% vs 49%, up 1 point; other income and expense $0.0 vs $(3.7); net income $36.6 vs $27.7, up 32% (33% CC); diluted EPS $4.92 vs $3.72, up 32% (33% CC). The commentary column notes revenue growth was driven by Agents and Infra, operating expenses rose on investment in R&D compute capacity and talent, total headcount decreased 2% year over year, operating margins rose slightly despite sales mix shift to Azure, other income and expense was $38 million against $(3.7) billion a year earlier that included losses on investments in OpenAI, and the effective tax rate was 20%.
Left two-thirds: a table under a 'GAAP and CC results' header with four columns (FY27 Q1, FY26 Q1, Growth, CC Growth), blue column headings, grouped rounded grey row bands, bold subtotal rows and italic percentage rows. Right third: a blue 'Summary of Results' heading over nine commentary bullets. Italic footnote pointing to the appendix for the constant-currency reconciliation.
Reconciles reported results to results excluding the impact from investments in OpenAI ($ billions). FY27 Q1: other income and expense $0.0 as reported, $(0.3) OpenAI impact, $(0.2) adjusted; net income $36.6 reported, $(0.2) impact, $36.4 adjusted; diluted EPS $4.92 reported, $(0.03) impact, $4.89 adjusted. FY26 Q1: other income $(3.7) reported, $4.1 impact, $0.4 adjusted; net income $27.7, $3.1, $30.8; EPS $3.72, $0.41, $4.13. Growth: net income and EPS up 32% on a GAAP basis and up 18% non-GAAP, with a net OpenAI impact of $(3.3) billion on net income and $(0.44) on EPS. Note that figures may not foot due to rounding.
Title and one-sentence explanation across the top, then a wide nine-column table grouped under FY27 Q1, FY26 Q1 and Growth headers (As Reported, Impact from OpenAI, As Adjusted for each year); three rows only, leaving the lower half of the slide empty.
Financial highlights. Cash returned to shareholders: $10.2 billion, with $7.3 billion in dividends and $2.9 billion in share repurchases. Capital expenditures including finance leases rose 30% to $45.2 billion, roughly three-quarters on short-lived assets, primarily CPUs and GPUs; cash paid for property and equipment was $39.4 billion, up 103%; finance leases were $7.4 billion. Cash flow from operations was $58.0 billion, up 29%, and free cash flow was $18.6 billion. A trended metrics table covers five quarters (FY26 Q1 to FY27 Q1): capex $34.9, $37.5, $31.9, $41.0, $45.2 billion; cash paid for PP&E $19.4, $29.9, $30.9, $35.8, $39.4 billion; finance leases $11.1, $6.7, $4.7, $5.6, $7.4 billion; short-lived asset mix ~half, ~2/3's, ~2/3's, ~2/3's, ~3/4's.
Upper half: blue 'Financial Highlights' heading with three bold sub-heads (Cash Returned to Shareholders, Capital Expenditures, Cash Flow) each followed by bullets. Lower half: a blue 'Trended Metrics' label beside a five-quarter table in a rounded grey band.
Segment results: revenue up 25% driven by Azure; cost of revenue up 35% on datacenter investment for Azure and Microsoft 365 cloud demand; gross margin dollars up 20% (21% CC); operating expenses up 10% on R&D compute capacity and talent; operating income up 24% (25% CC) with operating margins down slightly as sales mix shifted to Azure. A five-quarter stacked column chart ($ billions) shows revenue / operating income: FY26 Q1 $61.7 / $32.7; FY26 Q2 $64.4 / $33.2; FY26 Q3 $67.4 / $33.7; FY26 Q4 $74.6 / $36.7; FY27 Q1 $76.8 / $40.6, with GAAP / CC growth labels on each bar (FY27 Q1 revenue 25% / 25%, operating income 24% / 25%).
Title with a bold label and lighter segment name separated by a vertical bar; blue 'Segment Results' heading over five bullets; lower half is a rounded panel with a grey legend column on the left (Segment revenue and operating income trend, Revenue in bright blue, Operating income in navy) and five two-tone stacked columns on the right.
Commercial bookings decreased 12% (down 11% CC) against large Azure commitments in the prior year, partly offset by a large Azure commitment this quarter. Commercial remaining performance obligation was $677 billion, up 73%, with a weighted average duration of 2.3 years; roughly 30% will be recognized in the next 12 months (up 29%) and the remainder grew 98%. Microsoft Cloud revenue was $63.9 billion, up 30% (31% CC), and Microsoft Cloud gross margin percentage fell to 66% on mix shift to Azure. Trended metrics, FY26 Q1 to FY27 Q1: commercial bookings growth 112% / 111%, 230% / 228%, (4)% / (6)%, 10% / 11%, (12)% / (11)%; commercial RPO $392, $625, $627, $678, $677 billion; Microsoft Cloud revenue $49.1, $51.5, $54.5, $59.3, $63.9 billion; Microsoft Cloud revenue growth 26% / 25%, 26% / 24%, 29% / 25%, 27%, 30% / 31%; Microsoft Cloud gross margin 68%, 67%, 66%, 65%, 66%. Footnote: Microsoft Cloud includes Azure, Microsoft 365 commercial cloud and Industry solutions cloud.
Blue 'Business Highlights' heading with two bold sub-heads and bullets in the upper half; 'Trended Investor Metrics' five-quarter table in a rounded grey band in the lower half; italic footnotes.
Azure revenue grew 48% across all workloads. Microsoft 365 commercial cloud revenue grew 18% (19% CC) on an adjusted basis and 17% (18% CC) as reported, driven by higher revenue per user from Microsoft 365 Copilot, E5 and E7 upsell and usage-based services primarily in GitHub Copilot; commercial seats grew 5%. Microsoft 365 consumer cloud revenue grew 17% (16% CC) with subscribers up 7%. Productivity and server licensing revenue declined 3% (down 2% CC). Industry solutions cloud revenue grew 10% on Dynamics 365 and LinkedIn Talent Solutions. Frontier and support services revenue grew 4% (5% CC). Trended metrics FY26 Q1 to FY27 Q1: Azure growth 40% / 39%, 39% / 38%, 40% / 39%, 42%, 48%; Microsoft 365 commercial cloud growth 18% / 15%, 17% / 15%, 20% / 16%, 16% / 15%, 17% / 18%; commercial seat growth 7%, 7%, 6%, 7%, 5%; Microsoft 365 consumer cloud growth 26% / 25%, 29% / 27%, 33% / 29%, 24% / 22%, 17% / 16%; Industry solutions cloud growth 11% / 9%, 12% / 10%, 14% / 10%, 11% / 9%, 10%.
Dense text slide: five bold product sub-heads (Azure, Microsoft 365 Cloud, Productivity and Server Licensing, Industry Solutions, Frontier and Support Services) with bullets, then a five-row 'Trended Investor Metrics' table at the bottom.
Segment results: revenue declined 3% driven by Windows OEM and devices, partly offset by Search and advertising; cost of revenue declined 8% on lower amortization of Activision intangible assets; gross margin dollars relatively unchanged; operating expenses declined 3% driven by XBOX; operating income grew 2% (3% CC). Five-quarter stacked column chart ($ billions), revenue / operating income: FY26 Q1 $16.0 / $5.2; FY26 Q2 $16.8 / $5.1; FY26 Q3 $15.4 / $4.7; FY26 Q4 $15.4 / $3.9; FY27 Q1 $15.5 / $5.4, with FY27 Q1 revenue growth (3)% / (3)% and operating income growth 2% / 3%.
Same template as the Agents and Infra summary: segment results bullets above, rounded chart panel below with legend column on the left and five two-tone stacked columns on the right.
Search and advertising revenue excluding traffic acquisition costs grew 12% on higher rate and volume across LinkedIn, Edge and Bing. XBOX content and services revenue fell 2% (down 1% CC) on declines in third-party content and Game Pass, partly offset by first-party content; XBOX hardware revenue fell 14%. Windows OEM and devices revenue fell 22%, reflecting the prior-year benefit from Windows 10 end-of-support demand, OEM and channel inventory drawdowns and weaker PC demand. Trended metrics FY26 Q1 to FY27 Q1: search and advertising ex-TAC growth 16% / 15%, 13% / 12%, 14% / 11%, 13% / 12%, 12%; XBOX content and services growth 1% / 0%, (5)% / (6)%, (5)% / (7)%, (10)%, (2)% / (1)%; Windows OEM and devices growth 5%, (1)%, (2)% / (3)%, (7)% / (8)%, (22)%.
Blue 'Business Highlights' heading with three bold sub-heads (Search and Advertising, XBOX, Windows OEM and Devices) and bullets; three-row 'Trended Investor Metrics' table below; large white space between.
Section divider introducing the appendix of revenue detail and non-GAAP reconciliations.
Full-bleed dark navy background with the single word 'Appendix' in white, left-aligned and vertically centred.
Revenue by offering for the three months ended September 30 ($ millions), 2026 vs 2025: Azure $33,165 vs $22,384; Microsoft 365 cloud $27,778 vs $23,694; Productivity and server licensing $8,407 vs $8,678; Search and advertising $6,554 vs $5,942; XBOX $5,379 vs $5,508; Industry solutions $5,337 vs $4,894; Windows OEM and devices $3,551 vs $4,551; Frontier and support services $2,108 vs $2,022; total revenue $92,279 vs $77,673.
Plain ruled table with eight offering rows and a bold total, two year columns with blue year headers; the bottom half of the slide is empty.
Detailed reconciliation in $ millions for the three months ended September 30. 2026: other income and expense $38 reported, $(272) adjustment, $(234) adjusted; effective tax rate 20%, 0 pts, 20%; net income $36,629, $(207), $36,422; diluted EPS $4.92, $(0.03), $4.89. 2025: other income $(3,660), $4,061, $401; tax rate 19%, 1 pt, 20%; net income $27,747, $3,086, $30,833; EPS $3.72, $0.41, $4.13. Growth: net income and EPS up 32% GAAP, 33% constant currency, 18% non-GAAP and 19% non-GAAP constant currency. The adjustment is the impact from investments in OpenAI.
Wide ruled table with grouped headers for 2026, 2025 and Percentage Change Y/Y (GAAP, Constant Currency, Non-GAAP, Non-GAAP Constant Currency); bold row labels; italic explanatory footnote at the bottom.
Company-level constant-currency reconciliation ($ millions), 2026 vs 2025 as reported: revenue $92,279 vs $77,673, up 19%, currency impact $(309), 19% CC; cost of revenue $29,720 vs $24,043, up 24%, $(12) impact; gross margin $62,559 vs $53,630, up 17%, $(297); operating expenses $16,644 vs $15,669, up 6%, $0; operating income $45,915 vs $37,961, up 21%, $(297), 22% CC; net income $36,629 (adjusted $36,422) vs $27,747 (adjusted $30,833), up 32% GAAP and 18% non-GAAP, $(242) impact, 33% CC and 19% non-GAAP CC; diluted EPS $4.92 (adjusted $4.89) vs $3.72 ($4.13), $(0.03) impact, 33% / 19%.
Ruled reconciliation table with grouped headers (2026, 2025, two Percentage Change Y/Y blocks) and a Constant Currency Impact column in bold; long italic methodology footnote explaining constant currency.
Segment revenue in $ millions, 2026 vs 2025: Agents and Infra $76,795 vs $61,672, up 25%, currency impact $(290), 25% CC; Devices and Consumer $15,484 vs $16,001, down 3%, impact $(19), down 3% CC.
Two-row ruled table under a blue 'Segment Revenue' heading; most of the slide is white space above the standard constant-currency methodology footnote.
Three months ended September 30, 2026. Segment cost of revenue growth: Agents and Infra 35% GAAP, 0% currency impact, 35% CC; Devices and Consumer (8)%, 0%, (8)%. Segment gross margin growth: Agents and Infra 20% GAAP, 1% impact, 21% CC; Devices and Consumer 0%, 0%, 0%.
Two stacked small ruled tables, each under a blue heading (Segment Cost of Revenue, Segment Gross Margin), with three percentage columns; methodology footnote at the bottom.
Three months ended September 30, 2026. Segment operating expense growth: Agents and Infra 10% GAAP, 0% impact, 10% CC; Devices and Consumer (3)%, 0%, (3)%. Segment operating income growth: Agents and Infra 24% GAAP, 1% impact, 25% CC; Devices and Consumer 2%, 1%, 3%.
Same two-table layout as the previous slide, under blue headings Segment Operating Expense and Segment Operating Income.
GAAP growth, currency impact and constant-currency growth for twelve lines in the quarter ended September 30, 2026: commercial bookings (12)%, 1%, (11)%; commercial RPO 73%, 0%, 73%; Microsoft Cloud 30%, 1%, 31%; Azure 48%, 0%, 48%; Microsoft 365 commercial cloud 17%, 1%, 18%; Microsoft 365 consumer cloud 17%, (1)%, 16%; productivity and server licensing (3)%, 1%, (2)%; industry solutions cloud 10%, 0%, 10%; frontier and support services 4%, 1%, 5%; search and advertising ex-TAC 12%, 0%, 12%; XBOX content and services (2)%, 1%, (1)%; Windows OEM and devices (22)%, 0%, (22)%.
Single twelve-row ruled table under a blue 'Selected Product and Service Offerings' heading, three percentage columns; methodology footnote.
Free cash flow reconciliation ($ millions), 2026 vs 2025: net cash from operations $58,000 vs $45,057, up 29%; additions to property and equipment $(39,367) vs $(19,394), up 103%; free cash flow $18,633 vs $25,663, down 27%. Footnote explains free cash flow is a non-GAAP clarifying measure.
Three-row ruled table with bold operating cash flow and free cash flow rows, an indented capex row, and a percentage change column; the rest of the slide is white space.
End slide with the Microsoft logo and the line '© Copyright Microsoft Corporation. All rights reserved.'
Full-bleed dark navy background matching the cover, four-colour logo top left, copyright line bottom left.
Levinud küsimused selle slaidi ja esitluse sisu kohta.
The full 21-slide Microsoft FY27 Q1 results presentation as both PowerPoint and PDF, plus a page-by-page preview. The PowerPoint is the file Microsoft published on its investor relations site, not a conversion; the PDF was generated from it. Note that Microsoft's slides are embedded as images inside the PowerPoint, so it is best used as a visual reference rather than for editing individual text boxes.
Yes. It is the presentation Microsoft published for its first quarter of fiscal year 2027, presented on October 28, 2026 by Satya Nadella, Amy Hood and Jonathan Neilson. Microsoft's fiscal year starts in July, so FY27 Q1 is the quarter ended September 30, 2026 (July to September 2026), and it is compared with FY26 Q1.
Revenue $92.3 billion, up 19%; operating income $45.9 billion, up 21%, at a 50% operating margin; net income $36.6 billion and diluted EPS $4.92, both up 32%. Microsoft Cloud revenue was $63.9 billion, up 30%, Azure grew 48%, and commercial remaining performance obligation was $677 billion, up 73%.
This deck reports two segments, Agents and Infra ($76.8 billion revenue, up 25%) and Devices and Consumer ($15.5 billion, down 3%), instead of the three segments used in the FY26 Q4 deck. The segment trend charts on slides 7 and 10 show five quarters of history from FY26 Q1 on the new basis, so the trend is still comparable.
Much less than a year ago. In FY27 Q1 the OpenAI impact was $(0.2) billion on net income and $(0.03) on EPS, so adjusted EPS was $4.89. In FY26 Q1 it was a $3.1 billion drag, which is why GAAP net income and EPS grew 32% while non-GAAP growth was 18%. Slides 5 and 14 carry the reconciliation.
Capital spending. Cash flow from operations rose 29% to $58.0 billion, but cash paid for property and equipment rose 103% to $39.4 billion, so free cash flow fell 27% to $18.6 billion. Including finance leases, capital expenditures were $45.2 billion, up 30%, with roughly three-quarters going to short-lived assets, primarily CPUs and GPUs.
Yes, as a structural model. The sequence works for any multi-segment company: a full P&L table with commentary beside it, one slide isolating an unusual item, a cash and capital highlights slide with a trended table, then two slides per segment (overview with a trend chart, highlights with product metrics), and reconciliations in the appendix.
Restraint. Tables carry the figures and bullets carry the reasons, side by side. The only chart type is a two-tone stacked column (bright blue revenue over navy operating income) used identically for both segments, every growth figure is paired as GAAP % / CC %, and the dark navy cover, divider and closing slides frame an otherwise white deck with blue headings.
Original PowerPoint published by Microsoft with its FY27 Q1 earnings release on October 28, 2026.

Create Your Own Slides
Turn your ideas into professional presentations in seconds with 2slides AI.
Võta eeskuju professionaalsetest disainidest, vali oma stiil ja genereeri slaidid täiusliku tekstirenderdusega. Nano Banana jõul – alusta oma esitluse loomist kohe.
Sinu AI-agent slaidide loomiseks. Säästa aega ja sära kiiremini nutika esitluste loomisega.


© 2026 2slides. Kõik õigused kaitstud.