
Intuit Investor Day 2026 — Intuit's 168-slide investor day presentation (September 17, 2026) covering company growth strategy, AI and technology, the Global Business Solutions and Consumer platforms, FY27 guidance and long-term financial targets.
Kiirnavigatsioon
Sildid
Jaga slaide
Intuit Investor Day 2026 — Intuit's 168-slide investor day presentation (September 17, 2026) covering company growth strategy, AI and technology, the Global Business Solutions and Consumer platforms, FY27 guidance and long-term financial targets.
Iga slaidilehe üksikasjalik vaade, sealhulgas paigutus, põhisisu ja visuaalsed elemendid.
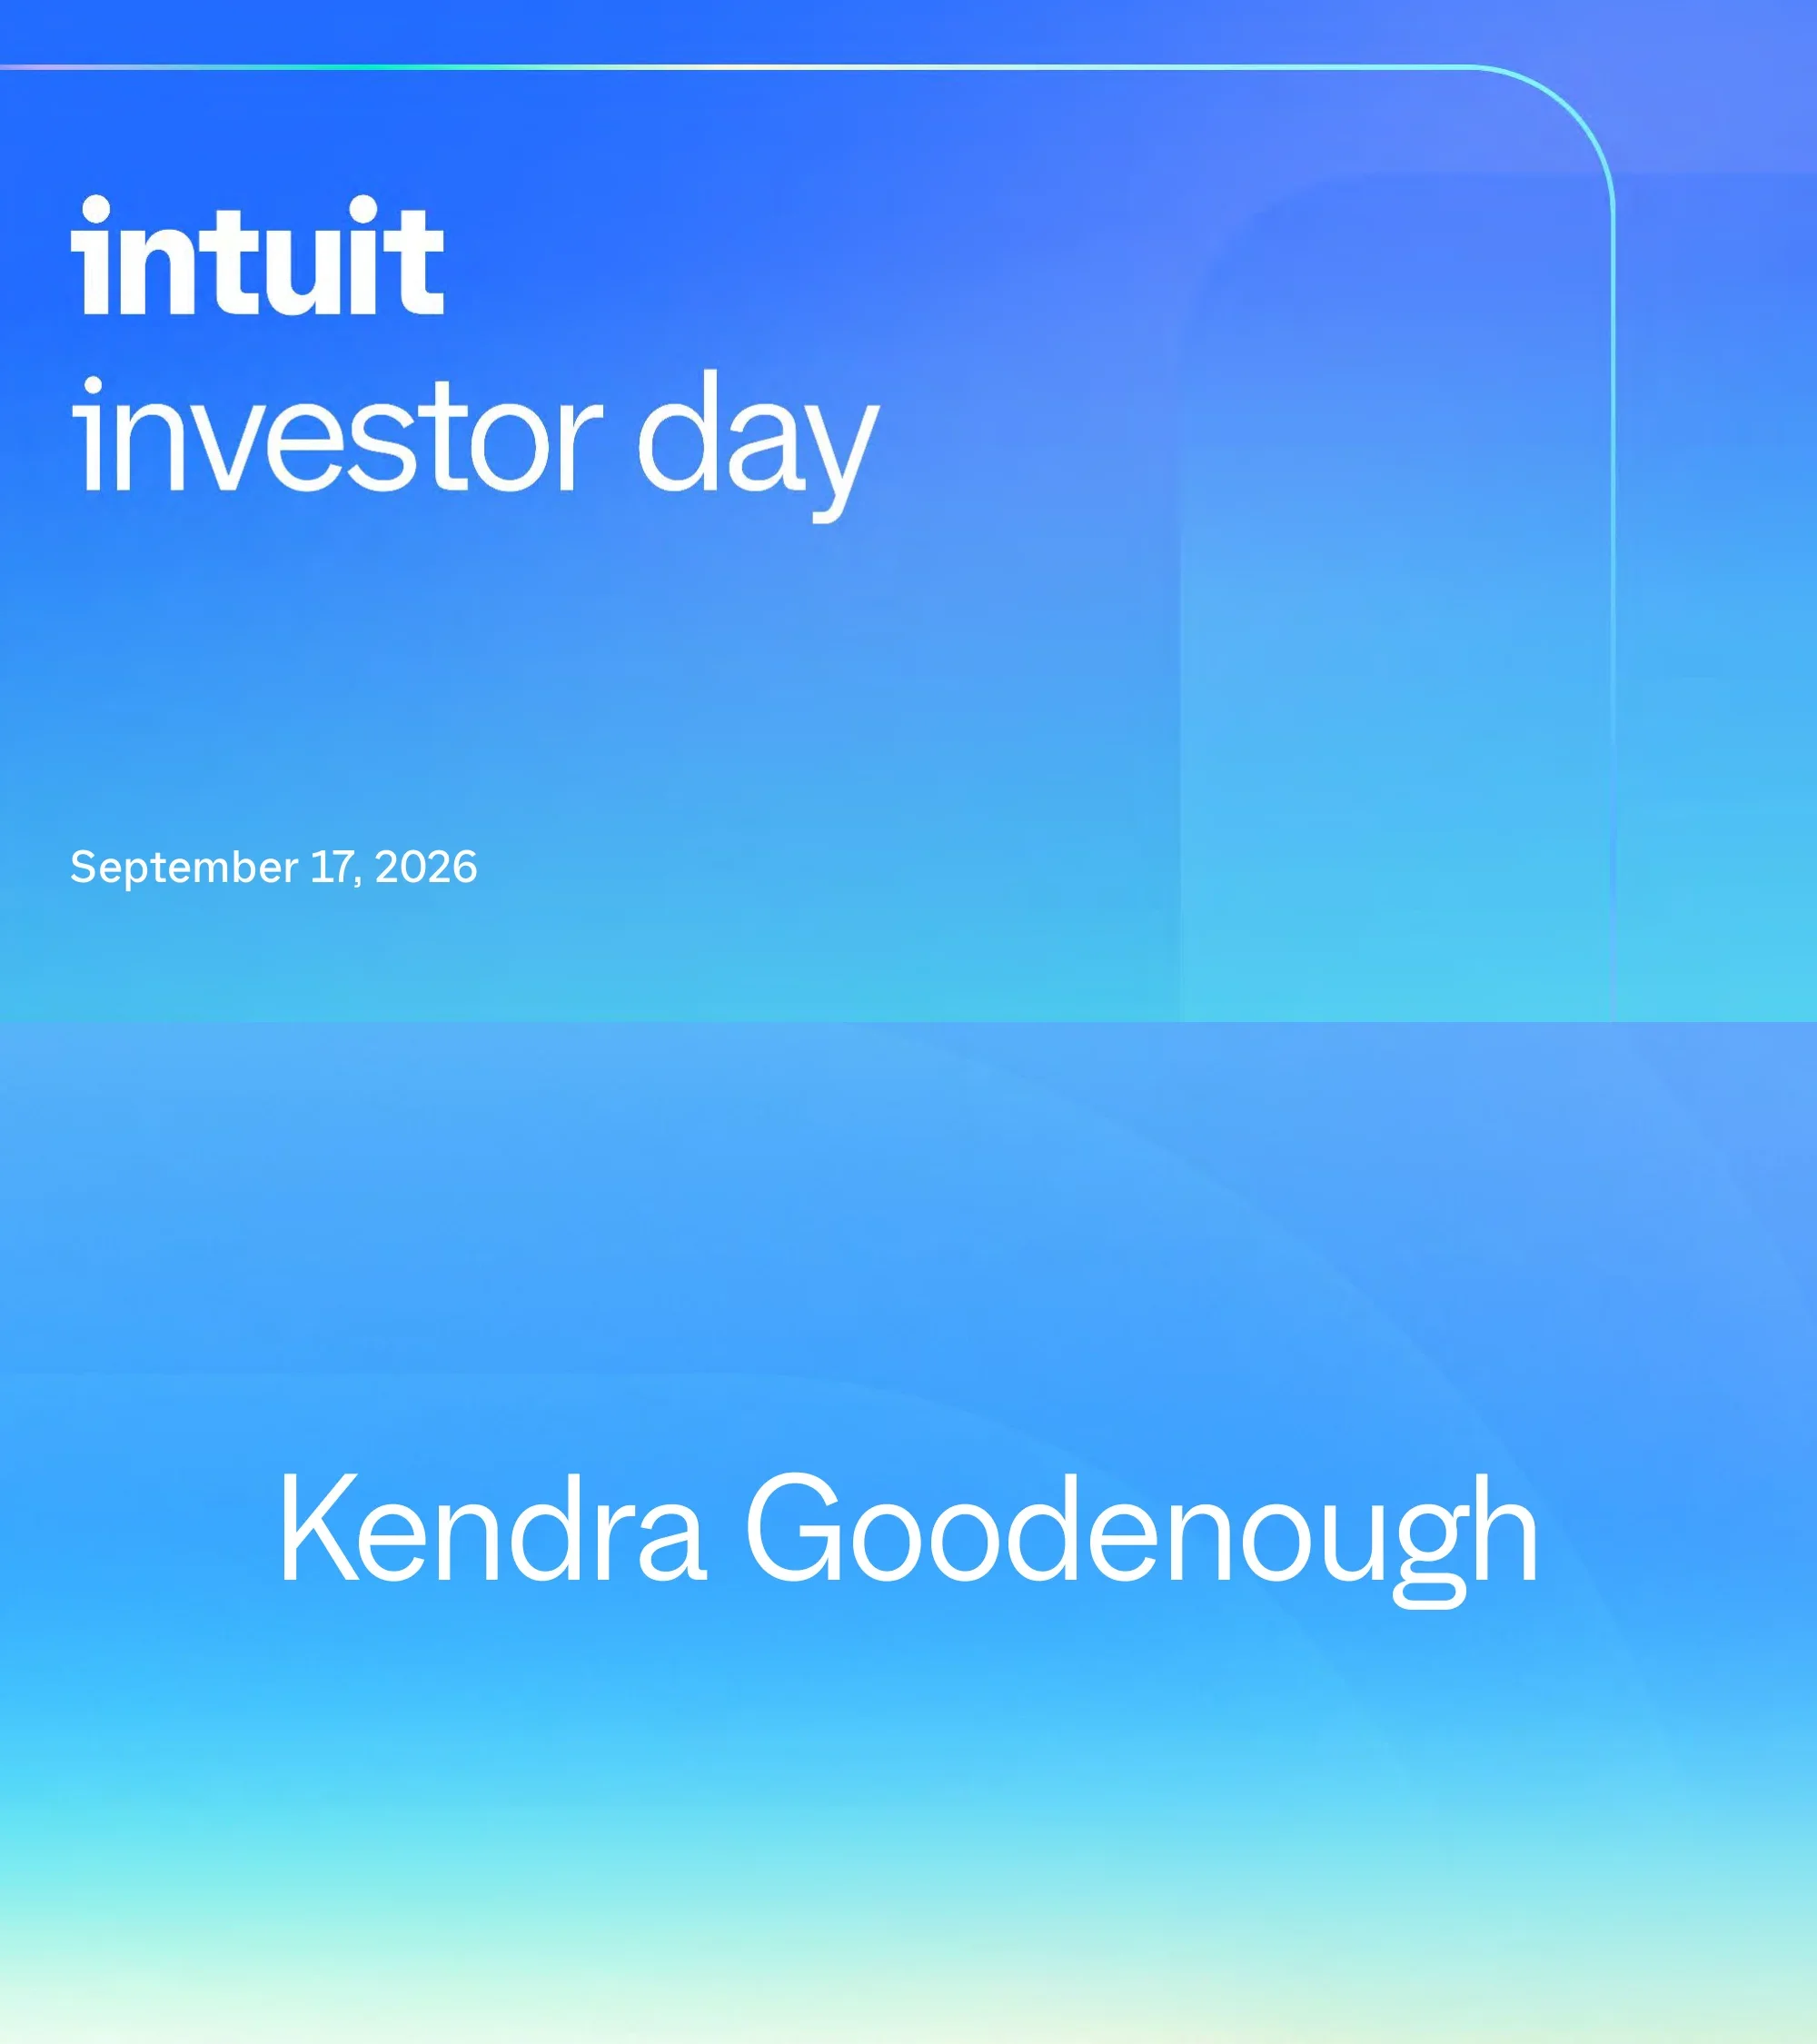
Cover slide for Intuit Investor Day, dated September 17, 2026.
Full-bleed blue gradient background; large white 'intuit' wordmark and 'investor day' title top-left, date bottom-left, with a faint rounded outline shape to the right.
Speaker walk-on slide introducing Kendra Goodenough (VP, Investor Relations per agenda) for the Welcome segment.
Full-bleed blue-to-cyan gradient with speaker name centered in large white type.
Day agenda: Welcome (Kendra Goodenough, VP IR); Company Growth Strategy (Sasan Goodarzi, Chairman & CEO); Technology Fueling Our Innovation (Alex Balazs, EVP & CTO); Business Platform Growth Strategy (Ashley Still, David Hahn) with Business Platform Immersion (Arundhati Singh, Wyatt Jenkins); Break; Consumer Platform Growth Strategy (Mark Notarainni) with Consumer Platform Immersion (Nick Soukas); Financial Perspective (Sandeep Aujla, EVP & CFO); Break; Q&A and Wrap-up (Sasan Goodarzi and Sandeep Aujla).
Rounded translucent blue panel over gradient; 'Agenda' title top-left and two columns of session titles in light blue with speaker names/titles beneath, separated by thin rules.
Legal disclaimers: forward-looking statements, non-GAAP measures, and notice that effective August 1, 2026 Mailchimp is a separate reportable segment and share-based compensation is no longer excluded from non-GAAP measures; GBSG figures for FY23-FY26 revised to exclude Mailchimp. Also notes product screen images are simulated.
White background with three text-heavy sections, each with a medium heading and small-body paragraph.
Speaker walk-on slide for Sasan Goodarzi (Chairman and CEO) opening the Company Growth Strategy section.
Full-bleed blue-cyan gradient with centered speaker name in large white type.
FY26 results: 14% revenue growth, 20% operating income growth (23% non-GAAP), 20% EPS growth (25% non-GAAP).
Title on white; full-width blue band holding 'FY26 Results' label at left and three KPI cards: a highlighted gradient card (14% revenue growth) and two white cards (20% / 20%) with non-GAAP sub-figures.
Total revenue grew from $14.4B (FY23) to $16.3B, $18.8B and $21.4B (FY26), with Big Bet engines (Assisted Tax, Money, Mid-Market) a rising share. Big Bets are ~30% of total revenue, growing >30% YoY, >2x total company growth rate (compounded >30% annually since FY23 vs. 14% for total).
Two-column: left area chart of total revenue FY23-FY26 with blue shaded Big Bet share and data labels; right white card listing three FY26 outcome stats with explanations; footnote at bottom.
Deliver done-for-you experiences: Assisted Tax customers +38% to 13M, revenue +37% to $2.8B. Accelerate money benefits: Consumer Money revenue +26% to $0.6B, Business Money +31% to $1.8B. Fuel mid-market success: Mid-Market customers +28% to 449K, revenue +39% to $1.6B.
Large rounded blue gradient panel with 'FY26 Outcomes' pill; three rows (one per Big Bet) with label at left and two metric pairs (growth % + absolute value) to the right; footnotes below.
Assisted Tax customers +38%: >75% of new customers were TurboTax DIY upgraders; 15% growth in new-to-the-franchise customers. Mid-Market customers +28%: ~75% of new customers were upgraders or desktop migrators; >30% growth in new-to-the-franchise customers.
Blue gradient panel with two rows; each shows Big Bet label, headline growth %, and a connector line to an outlined box with two sub-stats.
Candid shortfall: TurboTax IRS e-file share -1pt YoY; TurboTax DIY tax e-file share -3pts YoY; Business Platform total online paid customers grew +4% (-2pts YoY).
Dark navy-to-blue rounded panel with three large metrics; a vertical divider separates the two TurboTax metrics from the Business Platform metric.
Progress Made: grew Big Bets 30%+, customer benefit drove ARPC growth, innovation fueled by AI strategy, delivered margin expansion and EPS growth. Progress Needed: scale Big Bets, accelerate new customer growth, monetize breakthrough adoption.
Two side-by-side rounded panels (bright blue 'Progress Made', dark navy 'Progress Needed'), each containing stacked outlined pill items.
Framing slide stating the two strategic priorities: scale Big Bets plus accelerate new customer growth.
Full-bleed blue gradient; two phrases in large white type left and right joined by a central plus sign.
Customer problems by segment. Consumer: make ends meet, maximize tax refund, save more, pay off debt, know where I stand, reduce payments. Business: get/grow/manage customers, get paid and pay bills, get capital, pay and manage workforce, access advice, be compliant, get work done. Accountant: grow advisory services, automate manual work, deliver differentiated client work, find/upskill talent, manage firm capacity, evolve business model.
Three equal columns with blue headers and accent lines, each a ruled list of problem statements.
Intuit's total addressable market is $300B+ with only 7% penetration.
Title upper-left; large soft-blue circle at right with '$300B+ Total addressable market', small wedge slice pointing to '7% Penetration' label at left.
TAM split: Business $186B (Small Business $97B, Mid-Market $89B) and Consumer $142B.
Build of prior slide: title upper-left, circle now rendered as two-segment pie (blue Business, cyan Consumer) with sub-segment labels inside.
Mission statement slide: Powering Prosperity Around the World.
Full-bleed photo of a smiling woman in front of a house with dark overlay; large white mission text centered with small 'intuit Mission' label.
The platform serves Consumer, Small Business, Mid-Market and Accountant segments, promising more money, no work, complete confidence.
Centered semicircular arch diagram with four segment labels on a blue ring and three value statements inside.
Introduces the concept 'Financial System of Intelligence'.
White background with a single wide blue-to-cyan pill containing the phrase in white.
40+ years of secure data. Scale: 82M consumers, 10M businesses, 650K accountants. Richness: 70K data points per consumer, 625K per business, 307 industries.
Two stat groups across the top (Scale of customers / Richness of data) with small captions; below, a glowing outlined card with the 'Trusted proprietary data' layer title and description.
Financial expertise: 1 platform, 74 financial domains, 100+ workflows. Industry expertise: serves 99% of industries (307 industries, 1.5M professional services, 1M construction, 0.6M retail), $3T+ invoices, bills and payroll.
Build: stats row on top; highlight card for the new layer stacked above a faded 'Trusted proprietary data' card; background cloud of pill tags for domains and industries.
Agentic orchestration: 60+ LLMs agents can leverage, 100+ Intuit AI skills for agentic workflows. Human intelligence: 17K AI-powered tax experts, 650K accountants.
Build: stats row with two groups; highlighted 'Domain-specific AI+HI' card atop two faded stacked layer cards.
The three layers (trusted proprietary data, deep financial and industry expertise, domain-specific AI+HI) combine into the Financial System of Intelligence.
Two-tone headline; large glowing blue card with sparkle icon and title, containing three stacked horizontal bars for the layers.
Same stack, now branded 'intuit intelligence' in place of 'Financial System of Intelligence'.
Identical to page 22 with the card title swapped to the intuit intelligence wordmark.
Product demo intro: TurboTax DIY experience automatically pulling numbers from a W-2 (wages, withholding, Social Security, Medicare amounts). Screen images are simulated.
Full-bleed photo of a hand holding a phone showing the W-2 import screen; title in white at left.
Product demo intro: TurboTax expert-assist laptop screen ('Welcome back, Sergio') showing a customer's uploaded documents and a final-review flag for a partial RSU basis. Screen images simulated.
Full-bleed photo of laptop in use; title at left in white.
Product demo intro: QuickBooks dashboard ('Good morning, Susie') with AI prompt bar, customer funnel (estimates, proposals, projects, invoices), P&L and expenses widgets. Screen images simulated.
Full-bleed photo of desktop monitor showing dashboard; title at left.
Product demo intro: Intuit Intelligence mobile screen creating a revenue forecast based on QuickBooks data (projected $142,958.53 revenue over the next 12 months). Screen images simulated.
Full-bleed photo of phone in hand showing forecast chart; title at left.
Product demo intro: Agent Studio laptop screen building an agent workflow (read and extract contracts, look up retainage terms, fetch bills). In private pilot with select IAS and IES customers; additional fees may apply.
Full-bleed photo of laptop showing node-based agent builder; title at left; disclaimer footer.
Repeat of the intuit intelligence three-layer stack after the demo videos.
Same as page 23.
Repeat of the two strategic priorities framing from page 12.
Same as page 12: gradient background, two phrases joined by a plus sign.
Three Big Bets: 1) Deliver done-for-you experiences, 2) Accelerate money benefits, 3) Fuel success for mid-market businesses.
Left-anchored partial circle arc with three numbered items arranged along its curve in blue text.
Three pillars: broaden front doors to accelerate new-to-the-franchise growth; win priority cohorts with product innovation; grow lifetime value through platform adoption, consumption and upgrades.
Centered title with three stacked full-width outlined rounded boxes containing blue text.
Speaker walk-on slide for Alex Balazs (EVP and CTO) opening Technology Fueling Our Innovation.
Full-bleed gradient with centered name in large white type.
Three takeaways: differentiate with Intuit Intelligence (data, expertise, AI+HI advantage grows as AI improves); compound pace of innovation (AI increases velocity, quality, efficiency); scale Big Bets and accelerate new customer growth, on Intuit platforms and in frontier LLMs.
Blue gradient background; translucent rounded panel with three rows, bold label left and description right, separated by rules.
Repeat of the intuit intelligence three-layer stack as the CTO's framing.
Same as page 23.
Takeaway #1. Connected sources (books, transactions, payroll, tax, payments) flow into a Business Object Model (shared meaning, entity relationships, trusted definitions, provenance, permissions) creating persistent financial context. 15M customers filed taxes with zero manual data entry; $355B payroll processed annually for 18M US workers.
Takeaway pill and two-line title; three-stage left-to-right flow diagram with chevrons; blue bottom band with two big stats.
Takeaway #1. Tag grid of capabilities and industries (tax, payroll, bill pay, construction, healthcare, etc.); 74 financial domains, 100+ workflows, 307 industries.
Takeaway pill and two-line title; dense grid of rounded pill tags in varying blues; bottom blue band with three stats.
Takeaway #1. Customer workflow routed by intuit intelligence across 60+ LLMs, machine learning, deterministic code and human expertise to produce trusted financial outcome (accuracy, compliance).
Left-to-right flow: 'Customer workflow' -> blue chevron band with intuit intelligence and four stacked capability boxes -> 'Trusted financial outcome' with shield icon.
Tech strategy framed as two parts: compound the pace of innovation, plus scale Big Bets and accelerate new customer growth.
Full-bleed photo of smiling employees with dark overlay; outlined rounded box containing two phrases joined by a plus.
Takeaway #2. Decide what we build (PRDs for humans -> specs for agents; mockups -> prototypes), build it (writing code -> directing agents; multi-model), ship and learn (quarterly releases -> continuous learning). 40% increase in coding velocity; 31% decline in change-failure rate; 70% of merged PRs AI-assisted; 2X overall PDLC velocity target by end of FY27.
Left text list of three stages with from/to shifts; right circular cycle diagram (AI-powered Product Development); bottom blue band with four stats.
Takeaway #3. Six phone screens: QuickBooks (answers to action), TurboTax (taxes done in minutes), Credit Karma (personalized insights), Intuit Enterprise Suite (AI for complex businesses), and ChatGPT and Claude (financial work from new front doors). Some features beta/not GA.
Six column headers with short descriptions above a row of six phone screen mockups, product logos beneath each; disclaimer footer.
Demo callouts: acquires data from permissioned sources (brokerage account, 1099-INT, 1099-B) and orchestrates work across the return (matching transactions, adjusting ESPP cost basis).
Darkened full-bleed photo of phone in hand; blue product pill top-left; two callout labels on left with connector lines to UI points.
Demo callouts: deterministic tax and compliance engine (running 137 checks) and persistent customer financial graph (cross-referencing last year's return, W-2 checks).
Same demo format: dark photo, phone UI, two left callouts with leader lines.
Demo callouts: tax returns done for you in minutes (federal refund $1,606, state $1,139) and generative AI explains the outcome (refund explanation).
Same demo format with phone showing green 'return 100% done' card.
Demo callouts: persistent financial and operating context and forward-looking financial intelligence (revenue forecast from QuickBooks data).
Dark photo with phone showing forecast chart; blue 'Business Intelligence' pill; two callouts.
Demo callouts: AI grounded in authoritative records (scenario for hiring 2 sales reps, net income impact) and industry benchmarks.
Same format; phone shows KPI scenario table comparing baseline vs +2 sales reps.
Demo callouts: reusable skills for recurring analysis and reruns with latest financial information (scheduled monthly actuals vs forecast report email).
Same format; phone shows scheduled report confirmation card.
Demo callouts: create agents using natural language and capture firm expertise in reusable workflows (prompt to build a retainage agent for construction clients). Private pilot; fees may apply.
Dark photo of laptop; blue 'Agent Studio' pill; two callouts to prompt UI; disclaimer footer.
Demo callouts: access to Intuit financial capabilities and connected data; governed execution with review and controls (workflow nodes incl. flag retainage mismatch risk).
Same format; laptop shows node workflow builder.
Demo callouts: agents built once and deployed across clients; monitor performance across agents and clients (agent library with Retainage Agent, Cash Position Monitor, WIP Report Generator, etc.).
Same format; laptop shows agent library card grid.
Demo callouts: understands customer intent in business context and keeps persistent context across quote to cash (QuickBooks dashboard with customer funnel).
Dark photo of desktop monitor; blue 'Quote to Cash' pill; two callouts.
Demo callouts: orchestrates estimate and proposal generation (Magnolia Landscaping proposal) and applies financial and industry logic.
Same format; screen shows proposal document overlay with 'Creating estimate and proposal' status.
Demo callouts: executes the financial action and carries context forward into invoicing ('Creating and sending invoice').
Same format; screen shows invoice table overlay.
Takeaway #3. Intuit capabilities shown inside ChatGPT (TurboTax refund estimate $2,664), Claude (QuickBooks profit benchmark) and Perplexity (QuickBooks company finances).
Takeaway pill and title; three columns with ChatGPT, Claude and Perplexity logos over phone and desktop screen mockups.
Repeat of page 34's three technology takeaways closing the CTO section.
Same as page 34: blue gradient, translucent three-row panel.
Speaker walk-on slide for Ashley Still (EVP and GM, Small Business & Mid-Market Group) opening Business Platform Growth Strategy.
Full-bleed gradient with centered speaker name.
Four Business Platform takeaways: Scale Intuit Intelligence (grow consumption and engagement), Accelerate core customer growth (expand QuickBooks line-up), Embed Money experiences (payments, bill pay, capital, team management native to platform for higher ARPC), and Fuel Mid-Market success (industry editions, accountant network effect, upgrades).
Full-bleed blue gradient background; 'Key takeaways' header top-left; a rounded translucent panel with four rows, each pairing a bold takeaway label on the left with a one-line description on the right, separated by thin dividers.
GBS revenue grew 18% to $11.6B. Online Ecosystem revenue +23% to $8.6B; Total Online Paid customers +4% to 7.9M; Online Money Portfolio revenue +31% to $1.8B; Online Workforce revenue +17% to $1.8B; Mid-Market revenue +39% to $1.6B and Mid-Market customers +28% to 449K, roughly three-quarters from upgrades or DTM.
Dark photo background (smiling man holding mug and phone) on the right; left column stacks a large cyan 18% headline and three grouped KPI blocks (Online Ecosystem & Customer Growth, Money & Workforce Adoption, Mid-Market Expansion) with cyan percentages; footnotes at bottom.
Progress Made: grew Big Bets (Mid-Market and Money 30%+), customer benefit fueled up-market ARPC growth, innovation fueled by AI strategy. Progress Needed: accelerate customer growth and increase market share, scale Mid-Market through industry editions and accountants, scale Money and Workforce adoption powered by Intuit Intelligence.
Two side-by-side rounded cards: left bright blue 'Progress Made', right dark navy 'Progress Needed', each containing three outlined pill boxes with statements.
Transitional slide stating the two-part strategic thrust for the business platform: 'Scale our Big Bets' plus 'Accelerate new customer growth'.
Full blue gradient background with two large white phrases on left and right joined by a central plus sign.
Business platform TAM of $186B ($89B Mid-Market, $113B Money and Workforce) with 10M businesses and 650K accountants on the platform. Customer diversity spans industry, geography (US, CA, UK, AU, ROW), tax classification, employees (0 to 250+), business type and structure, and accountant firm size and services.
Left: semicircular arc diagram labeled Consumer / Small Business / Mid-Market / Accountant around 'Intuit Platform' (More money, No work, Complete confidence). Right: two-column grid of customer attribute labels. Bottom: blue band with $186B TAM and 10M businesses / 650K accountants.
Four strategic priorities: Scale Intuit Intelligence, Accelerate Core Customer Growth, Embed Money Experiences, Fuel Mid-Market Success, each with a short description. Footer: delivering customer benefit — improve cash flow, save money, save time, better insights, growth of business.
Four vertical photo panels of business owners side by side with cyan priority headings and short white descriptions overlaid at the bottom; title across the top; benefit strip at the base.
Three columns of customer problems: Consumer (make ends meet, maximize tax refund, save more, pay off debt, know where I stand, reduce payments), Business (get/grow customers, get paid and pay bills, get capital, pay workforce, access advice, be compliant, get work done), Accountant (grow advisory, automate manual work, differentiated client work, talent, capacity, evolve business model). Consumer column is greyed out to highlight Business and Accountant.
Three-column list layout with headers and underline accents; the Consumer column rendered faded while Business and Accountant columns are emphasized in white cards.
Running a business is manual and fragmented: 7–25 disconnected apps and 36% of owners' time goes to admin work. Accurately predicting costs and margins is the #1 operational challenge, and 49% of businesses say poor financial management holds them back.
'Customer Problems' tag top-left; headline and three stat groups with blue numbers on the left; large rounded photo of a business owner working on a laptop on the right.
650K accountants serve businesses and 65%+ of QuickBooks Online customers work with an accountant. Advisory offers ~3x revenue potential vs. bookkeeping and 87% of firms plan to expand advisory; 44% of solo/small firm owners plan to retire within 5 years and accounting firm M&A deals grew 8x since 2023.
'Customer Problems' tag; headline and three stat subsections (two stats each) on the left; rounded portrait photo of a smiling accountant on the right.
Platform diagram linking Businesses (accounting, business intelligence, money in, capital, money out, HCM, marketing) and Accountants (firm management, service delivery, client insights). Durable advantages: trusted financial intelligence and automation, complete money in/money out solution, and shared accountant/business data powering a network effect.
Large rounded glowing panel with Businesses and Accountants headers and capability pills, a loop icon between them, a 'Our durable advantage' three-column row, benefit strip, and an 'intuit intelligence' logo bar at the bottom; banking/lending disclaimers in footnotes.
Speaker introduction card for David Hahn.
Full blue-to-light gradient background with the speaker's name centered in large white type.
2.5M customers use Intuit Intelligence automations and insights monthly. >75% of Intuit Enterprise Suite customers engage monthly; ~30% reduction in manual work (13 hours saved per month); ~400M transactions monthly get AI-recommended categorization (90%+ of all); ~30% more accountant time on advisory; ~70% more confident books are right; ~60% understand cash flow faster.
Dark photo background (two people at a laptop) on right; left column with 'Takeaway #1' pill, title, large cyan 2.5M headline, 'Intuit Intelligence Impact' stat list, and 'Our Focus' statements; footnotes at bottom.
Intuit Intelligence is built on three layers: domain-specific AI+HI, deep financial and industry expertise, and trusted proprietary data.
Headline with blue emphasized words; a glowing rounded panel with the intuit intelligence logo on top and three stacked horizontal bars listing the layers.
Intuit Intelligence offers one end-to-end view of the business benchmarked against anonymized peers using 40+ years of data, what-if cash flow planning, and insights that turn into actions. FY26 proof points: 2x quarterly growth in chat conversations (Q4 vs Q3 FY26) and 1.6x higher chat engagement among new customers.
Left text column with blue lead-in, three bolded feature blurbs and two proof-point stats; right side shows a desktop dashboard mockup ('Good morning, Susie') with a phone mockup overlapping.
Agentic accounting, money in/out and team management are automated from day one, with intelligence improving with each job. FY26 proof points: 400M transactions monthly with AI categorization (90%+), ~30% more accountant advisory time, and $8.6B of bills ingested via AI in July 2026.
Left text column with feature blurbs and proof-point stats; right side a collage of product UI cards labeled Invoice Automation, Categorization, Payroll Automation and Bill Ingestion.
Multi-entity, multi-currency and dimensional reporting consolidate into one view, and agents automate month-end close, projects and money in/out, with customers able to build their own agents. >75% of IES customers use AI agents monthly, on average 11 days per month.
Left text column with two feature blurbs and two proof-point stats; right a large IES dashboard screenshot ('Good morning, Sofia').
Total Online Paid customers grew 4% to 7.9M; US QuickBooks Online Paid Core customers +4% to 5.3M; QuickBooks Online US retention 83%. Focus: expand the QuickBooks line-up to acquire businesses new to financial software and deliver innovation that converts and retains small businesses.
Dark photo background of a woman on her phone on the right; left column with 'Takeaway #2' pill, title, large cyan 4% stat, key outcomes and 'Our Focus' list; footnotes.
Total online customer base grew from 6.8M (FY23) to 7.3M (+6%), 7.7M (+5%) and 7.9M (+4%) in FY26; 3-year customer CAGR by ARPC band: 19% for >$1,000, 5% for $200–$1,000, -8% for <$200. ARPC grew to $1.1K (18% YoY, 16% 3-year CAGR) while customer growth decelerated 2 pts YoY (-6 pts since FY23).
Left text column explaining ARPC drivers and deceleration reasons; right a stacked bar chart of customer base by ARPC band for FY23–FY26 with a 3-year CAGR legend column.
Three segments: Non-Employer (39M businesses, 90%+ non-consumptive, <10% served) via QuickBooks Free; Small Business (8M, 55% on platform, 45% NTTF opportunity) via QuickBooks; Mid-Market (1.8M, 25% on Advanced/IES, 40% upgrade opportunity, ~35% NTTF) via QuickBooks Advanced and Intuit Enterprise Suite.
Three white cards in a row with segment name, business count, a segmented bar showing share breakdown and a strategy line; below, a blue band with product logos and positioning taglines (Simple/Frictionless, AI-powered done-for-you, AI-native industry-tailored).
QuickBooks Free converts through Get Organized, Get Paid (payments from first invoice) and Simplify Compliance. FY26 proof points: 20K QuickBooks Free-driven monetized and active customers in the first six months, and 10x higher upgrade likelihood for Month-1 bank connectors vs non-connectors.
Left text column with three feature blurbs and two stats; right a QuickBooks Free desktop screenshot ('Good morning, Maya!', $1,072) with overlapping phone mockup.
Two case studies: Michael Papesh (social media consultant) joined QB Free to send his first invoice, connected his bank and became monetized via QB Payments transaction fees; Taisha Rodriguez (photographer and healthcare consultant) outgrew Free and upgraded to QB Lite then Essentials. Each includes a customer quote.
Two side-by-side blue-bordered case study cards, each with a 'Case Study' tag, name and role, headshot photo, journey bullet list and quote.
Online Services revenue grew 24% to $3.6B; Online Money Portfolio revenue +31% to $1.8B; Online Workforce revenue +17% to $1.8B; Online Ecosystem ARPC +18% to $1.1K. Focus: embed payments, bill pay, capital and workforce natively and drive higher ARPC.
Dark photo background of a man working at a laptop; left column with 'Takeaway #3' pill, title, large cyan 24% stat, outcomes list and focus statements; footnotes.
Business Platform spans Money In (embedded payments, new front doors), Capital (lending, marketplace) and Money Out (credit card, bill pay, HCM). FY26 proof points: 27% YoY revenue growth from customers with 2+ offerings, $229B Business Money TPV (+30% YoY), $355B payroll processed annually (+6% YoY).
Large glowing rounded panel with 'Business Platform' header, three columns with descriptions and blue capability pills, and a proof-point stat row at the bottom.
A quarter of business spend runs on credit card; the card is underwritten on business performance and spend is auto-categorized. FY26 proof points (Mar–Jul 2026): 39% of cardholders also run Bill Pay or Payroll, 78% charged spend within 30 days, $100M cumulative spend in the last 5 months.
Left text column with feature blurbs and three stats; right a credit card management dashboard screenshot ('Hello Melissa') with an overlapping phone mockup.
Payroll runs at scale, Intuit Intelligence automates team management, and HCM (payroll, benefits, time, HR) deepens stickiness with nearly 2x increase in customers engaging HCM features in 3 months. Proof points: $355B payroll processed for 18M US workers, $28M revenue from AI-powered 1099 filings in TY25 (~80% YoY), 60% of Mid-Market payroll customers on HCM SKUs.
Left text column with three feature blurbs and stat row; right a payroll/team overview product screenshot ('Payroll in 5 days', 'Team Overview').
Bill Pay is the default AP workflow in QuickBooks Advanced and IES; AI bill ingestion converts vendor invoices to prefilled bills at 96% accuracy; capital is offered inside payroll and payments workflows. Proof points: $54B Bill Pay volume (+89% YoY), $7B loan volume (+75% YoY), 17% Bill Pay attach increase among QB Advanced customers, 60% faster revenue growth after accessing capital.
Left text column with three feature blurbs and a 2x2 stat grid; right a bills-list product screenshot with drag-and-drop upload callout.
Intuit Intelligence pre-drafts invoices and reminders; Buy Now, Pay Later via Affirm and upcoming Revenue Based Financing build credit into getting paid; invoicing and payments live inside leading AI assistants. Proof points: $2.7T invoices managed in QuickBooks, $170B US online payment volume (+19% YoY), 15% payments penetration (+1 pt), 80% MoM volume growth through AI platform partners.
Left text column with three feature blurbs and 2x2 stats; right two phone mockups showing Intuit Intelligence lead/invoice screens; Affirm disclosures in footnotes.
Three accelerators with FY26 proof points: The offering is complete (27% YoY revenue growth from customers with 2+ offerings), Adoption is built in ($229B Business Money TPV, +30% YoY), Embedded compounds into ARPC growth ($1.1K Online Ecosystem ARPC, +18% YoY).
Three-column table with a blue header bar (Accelerators | What We Built | FY26 Proof Points) and three rows separated by thin lines.
Speaker introduction card for Ashley Still.
Full blue gradient background with centered speaker name in large white type.
Mid-Market revenue grew 39% to $1.6B; $146M IES annualized revenue; Mid-Market customers +28% to 449K; >30% Mid-Market new-to-the-franchise customer growth; >2x uplift in IES average revenue per contract for upgraders; 9 pts higher Payments penetration for US QuickBooks Advanced vs other SKUs.
Dark photo background of a smiling man in a cap reviewing blueprints outdoors; left column with 'Takeaway #4' pill, title, large cyan 39% stat, outcomes list and focus statements; footnotes.
Line-up: QuickBooks Advanced (all-in-one platform), Intuit Enterprise Suite (AI-native industry-tailored ERP for the Mid-Market CFO), Intuit Accountant Suite (operating system for accounting firms). Levers: upgrades within base (1.8M Mid-Market businesses TAM, 715K using QBO Core & Desktop), win new customers (~25% of additions from NTTF, $30B TAM in top verticals), expand with Money ($29B TAM in Mid-Market Payments and Bill Pay).
Glowing rounded panel with Businesses/Accountants headers over a blue product-logo bar, product descriptors, and a 'Mid-Market Growth Opportunities' three-column stat section.
Payments, payroll, bill pay and capital run natively so every dollar lands in one set of books, and Intuit Intelligence scales with complexity. FY26 proof points: +9 pts payments penetration and +13 pts payroll penetration vs all other SKUs.
Left text column with two feature blurbs and two stats; right a QuickBooks Advanced project dashboard screenshot with bar charts.
IES provides multi-entity consolidation, dimensions and always-on audit, deep industry vertical data models, and agentic month-end close with customer-built agents. FY26 proof points: $146M annualized revenue, 2x ARPC uplift for upgraders, +22 pts payroll and +19 pts payments penetration vs other SKUs.
Left text column with three feature blurbs and 2x2 stats; right an IES 'Today's Brief' dashboard screenshot with charts.
Mid-Market businesses need industry capabilities (construction progress billing/job costing, non-profit grant/fund accounting, manufacturing multi-level BOM) and accountants specialize and recommend by vertical. ~$30B industry vertical opportunity within the $89B Mid-Market TAM; construction is in market, manufacturing and non-profit in pilot.
Two white cards (Mid-Market Businesses, Accountants) with blue headers; below a blue band stating the ~$30B opportunity and five industry icons (Construction, Manufacturing, Non-Profit, Field Services, Healthcare).
Construction edition includes job costing, project budgets, retainage and AIA-style billing, with tailored go-to-market (dedicated sellers, vertical campaigns). Since launch (Feb–Jul 2026 vs before): +19 pts incremental growth in QBO Advanced construction customer additions and 20% increase in new IES construction contracts.
Left text column with two feature blurbs and two stats; right a construction project dashboard screenshot with KPI tiles and bar charts.
Demand Engine: 2X growth in marketing-sourced IES sales qualified opportunities and 3X in marketing-sourced NTTF IES contracts. Sales: 3X Mid-Market sales productivity, 36% sales headcount growth, 40% growth in new Mid-Market Workforce customers. Customer Success: 53% growth in Payments and Bill Pay volume after onboarding, 72% adopt 4+ IES features within 90 days (all FY26 vs FY25).
Blue gradient background with a large white rounded panel split into three columns (Demand Engine, Sales, Customer Success), each with large blue stats stacked vertically.
Accountant-driven IES deals grew 5X (FY26 Q4 vs Q1), 25% of new IES deals are driven by accountants, and 70%+ of Mid-Market businesses work with an external accountant. Partnerships with Top 50 accounting firms shown via logos: Aprio, CitrinCooperman, Eide Bailly, Rehmann, Sorren.
Blue gradient background with two white rounded cards: left with three stacked stats, right with a vertical list of partner firm logos.
Accountants get benchmarks out of the box, service differentiation and advisory growth; businesses get domain-expert advice, industry-tailored service and less manual work. 650K accountants and 10M businesses connected via Intuit Intelligence.
Large glowing rounded panel with two columns (Accountants, Businesses) linked by a central loop icon, each listing three benefits above a large blue number; Intuit Intelligence logo at the bottom.
Intuit Intelligence closes books across a firm's client base per its playbook, firms ship branded experiences to clients, and the agnostic platform grows with them; includes a quote from Matthew May of Sorren. FY26 proof points: 150K accountants on Intuit Accountant Suite, 85% say one platform streamlined operations, ~30% more time on advisory.
Left text column with three feature blurbs, customer quote and three stats; right a wide Accountant Suite client-insights screenshot.
Case study of Agentic Books Close: an agent runs the close end to end following the firm's own SOPs, with the firm in control and learning with every close. Available in open beta at no charge; paid availability expected January 2027.
Large product UI screenshot of the close workflow across the center with left-side callout labels (Firm remains in control, Runs the firm's playbook, Learns with every close) connected by lines; case study text block on the right.
Speaker card for David Hahn returning to the stage (wrap-up of Business Platform section).
Full blue gradient background with centered speaker name in large white type; identical to page 67.
Repeat of the four Business Platform takeaways: Scale Intuit Intelligence, Accelerate core customer growth, Embed Money experiences, Fuel Mid-Market success, each with its description. Near-duplicate of page 57 used as the section recap.
Blue gradient background, 'Key takeaways' header, rounded glass panel with four label/description rows; same as page 57.
GBS segment long-term expectation: 10–15% compound annual revenue growth over the next three years. Volume, mix and price are all available growth levers, and Intuit is prudent in the contribution assumed from each.
Glowing rounded panel split into a left inner card with 'Long-term growth expectations' pill and large blue 10–15% figure, and a right text area on the foundations of growth.
Mailchimp focuses on high-value customers: +4.9 pts operating margin expansion in FY26, 9% YoY growth in high-value new bookings MRR (sales-assisted Mid-Market), 35% YoY growth in SMS paid customers (SMS customers spend 11% more), and 1% improvement in active high-value customer dollar churn YoY.
Left text column with a blue lead-in and four stat rows; right a Mailchimp SMS campaign UI screenshot with a phone preview.
Speaker introduction card for Mark Notarainni, opening the Consumer Platform section.
Full blue gradient background with centered speaker name in large white type.
Three Consumer takeaways: Scale the Consumer Platform (make Credit Karma the front door into Tax, Money and Personal Finance), Evolve the Tax Growth Model (rebuild the DIY funnel to regain IRS e-file share and expand lifetime value), Expand Assisted Tax (shift growth to new-to-the-franchise customers, monetize expert accountability, scale with AI & Human Intelligence).
Blue gradient background with 'Key takeaways' header and rounded glass panel containing three label/description rows.
Consumer Platform revenue grew 11% to $8.6B; platform customers +2% and ARPC +11%. TurboTax revenue +7%, IRS e-file share -1 pt, TurboTax Live revenue +37% and customers +38%; Credit Karma revenue +20% (18% 3-year CAGR), connected-account members +104%, Lightbox revenue +34%.
Dark photo background of a woman looking at her phone on the right; left column with 'FY26 Results' pill, title, large cyan 11% headline, and grouped KPIs for Platform Growth, Tax and Credit Karma; footnotes.
Progress Made: customers filing taxes via Credit Karma grew significantly while Personal Finance verticals scale; expert-led and local experiences contribute to Assisted share gain; meaningful tax monetization beyond filing (fast access to refunds). Progress Needed: increase cross-platform adoption, shift TurboTax Live growth toward new-to-the-franchise customers as DIY upgrades moderate, rebuild DIY funnel to regain IRS e-file share.
Two side-by-side rounded cards (blue 'Progress Made', navy 'Progress Needed') with three outlined statement pills each; same template as page 59.
Transitional slide repeating the strategic thrust 'Scale our Big Bets' plus 'Accelerate new customer growth', now for the Consumer Platform; duplicate of page 60.
Blue gradient background with two large white phrases joined by a central plus sign.
Eleven fragmented consumer needs across Tax, Money and Personal Finance (taxes, tax advice, money management, trading, P2P payments, banking, credit cards, loans, insurance, budgeting, credit score monitoring, plus financial planning). Costs of fragmentation: 7 hrs per week managing finances, up to 21 days to receive a tax refund, >$700 unrealized annual APR savings on auto loans, $12B in overdraft/NSF fees, $11K revolving debt for households with it.
Three category header tabs (Tax, Money, Personal Finance) over a grid of numbered hexagonal icon tiles; bottom blue band with five cost statistics.
US consumer tax industry returns ~160–167M (TY20–TY25E) with TurboTax e-files declining from 44M to 39M; TurboTax TY25 share: 56% of DIY e-files, 0.8% of Assisted e-files. ~1.8x YoY increase in Assisted Tax share, 76% TurboTax Online retention, >50% of TurboTax revenue from TurboTax Live (+11 pts), >75% of Live additions from DIY upgrades, -2% TurboTax unit decline in price-sensitive DIY segments.
Left headline, explanatory paragraph and five stat rows; right stacked bar chart of US tax returns by Assisted/DIY/Other for TY20–TY25E with TurboTax e-file counts below and share callouts on the right edge.
Same three-column customer problems grid as page 63, but now the Consumer Problems column (make ends meet, maximize tax refund, save more, pay off debt, know where I stand, reduce my payments) is highlighted and Business/Accountant columns are faded.
Three-column list layout with emphasis flipped: Consumer column active, other two greyed out.
Consumer vision statement: be the daily financial assistant that helps customers make smarter financial decisions and put more money in their pockets. Page text includes a 'Design WIP' marker.
Full-bleed photo of a couple looking at a laptop, darkened, with a small cyan 'Vision' label and large centered white statement.
Consumer TAM of $142B alongside $186B Business TAM ($97B Small Business, $89B Mid-Market). Intuit has 13% revenue share of the $47B Tax TAM (up 1 pt YoY; $37B Assisted Consumer and Business Tax TAM), 4% of the $61B Personal Finance TAM (12% share of combined credit card and personal loan originations), and <1% penetration of the $33B Money TAM.
Left headline, subtitle and three stat rows with explanations; right a large pie chart split into Business (blue) and Consumer (cyan) with sub-labels.
Platform built around financial moments by frequency: Daily (spend, save, move money – CK Money, Karma Intelligence), Weekly (check credit, track cash flow – credit monitoring, connected accounts, Paycheck Advance), Annual (file taxes, refunds, insurance – TurboTax), Periodically (new card, loan, home – Lightbox offers, Debt agent). Intuit Intelligence flywheel: richer data, personalization, engagement, monetization, better outcomes.
Left headline and flywheel bullet list; right a rising staircase of four stacked blue-to-cyan bands labeled Daily/Weekly/Annual/Periodically along a 'Value per interaction' diagonal arrow.
Three priorities: Scale the Consumer Platform (Credit Karma as front door), Evolve the Tax Growth Model (rebuild DIY funnel with stronger price benefit, ease and lifetime value), Expand Assisted Tax (new-to-the-franchise, expert accountability, AI & human intelligence). North star: put more money in our customers' pockets.
Three vertical portrait photo panels with cyan priority headings and white descriptions overlaid; title across top; north-star line at the bottom; mirrors page 62.
Six front doors across Tax, Money and Personal Finance (maximize tax refund, make ends meet, save more, pay off debt, know where I stand, reduce payments), each tied to a customer pain point: 49% rely on tax refunds to make ends meet, 400% APR on outside short-term loans, 50%+ can't cover a $1K emergency, 57% of CK active members carry revolving debt, 78% want all finances in one place, 60%+ of lower-income household income goes to essentials.
Headline and subtitle on top; three colored category tabs (Tax, Money, Personal Finance) over six phone mockups in a row; a blue band at the bottom with six large pain-point percentages under each phone labelled 'Key customer pain-points'.
Make Credit Karma the platform front door, expanding top of funnel into Tax, Money and Personal Finance. FY27 priorities: make Credit Karma the year-round financial home; turn financial context into proactive Tax engagement; use Money and Personal Finance (scale CK Money, expand Home and Insurance, debt management/refinancing) to deepen the relationship.
Takeaway #1 pill tag, large headline with subtitle; below a three-row table with blue priority names on the left and three bullet-like lines of detail on the right, separated by thin rules.
FY26 proof points: >50% YoY TurboTax unit growth from Credit Karma; >2x ARPC for joint TurboTax + Credit Karma customers vs single-product customers; 44% revenue growth in Insurance and Home.
Same header as prior slide; left column stacks three big blue stat callouts with descriptions; right side shows a large cropped phone mockup of the Credit Karma app with 'CK front door' tag and 'An offer curated just for you' caption.
From-to comparison of Legacy Model vs Consumer Platform across five categories: business model (seasonal tax-led to year-round platform), customer engagement (episodic to continuous with CK as front door), growth objective (maximize tax revenue per interaction to grow customers and lifetime value), monetization (direct transaction-based to diversified across Tax, Money, partner-powered Personal Finance), product (siloed to integrated, powered by Intuit Intelligence).
Centered two-line headline; three-column comparison table: category labels on white, 'From' legacy column on white, 'To' Consumer Platform column on a blue gradient panel with an angled edge.
Direct-to-consumer (TurboTax; revenue from customers, seasonal), Partner Paid (Credit Karma; revenue from FI partners, year-round, grows with engagement and conversion), and Interchange (CK Money; revenue from acquiring bank, daily cadence, grows with active spend and direct deposit).
Centered headline; one rounded card with glowing blue border containing three columns, each with a colored product pill, blue model name, description, tagline and revenue source / cadence / grows-with lines.
Platform customers 35.4M (FY24), 36.7M (FY25), 37.4M (FY26), +2%; ARPC $157, $178, $198, +11% in FY26; TurboTax e-files 40M, 40M, 39M against IRS e-files of 151M, 154M, 155M (TY23-TY25E).
Takeaway #1 tag and centered headline; three side-by-side blue bar charts (platform customers, ARPC, TurboTax share of IRS e-files) with growth callouts; dense footnotes at bottom.
Platform ARPC grew 11% YoY to $198. Consumer platform customers by ARPC band FY23-26 (35.5M, 35.4M, 36.7M, 37.4M) with 3-year CAGRs of +22% (>$200), +8% ($120-200), -11% ($20-120), -34% (<$20); low-end DIY pressure shifted mix while Assisted and CK monetization grew higher bands.
Left text column with blue lead stat and three explanatory paragraphs; right a stacked bar chart in four blue/teal shades by band, with CAGR labels on the right edge.
Rebuild the DIY funnel. Priorities: broaden the DIY line-up with Credit Karma Tax at $0 federal / $15 state; use DIY acquisition as an on-ramp to lifetime value (DIY upgrades drove >75% of Assisted growth); scale distribution via fintech/payroll embeds and AI-native surfaces.
Takeaway #2 tag, headline and subtitle; three-row priority table with blue headings left and detail lines right.
~80% customer incrementality from the Credit Karma Tax pilot in TY2025; 21% YoY unit growth from embedded payroll-provider tax partnerships; 34% of CK Tax Gen Z customers were new to Credit Karma; >60% of TurboTax defectors have a Credit Karma account.
Header with subtitle; 2x2 grid of big blue stats on the left; right shows two overlapping phone mockups (Credit Karma app showing $3,800 refund and a ChatGPT app screen) with Intuit Credit Karma and ChatGPT logos.
Three-tier tax line-up: Credit Karma Tax ($0 Fed, $15 State) for getting started; TurboTax DIY (Free, Deluxe, Premium) for growing needs; TurboTax Expert Assist (Basic/Deluxe/Premium with Sign & File, Full Service, Business Tax) for seeking confidence. $5B DIY TAM and $37B Assisted TAM (excludes $5B ProTax TAM).
Centered headline; TAM labels above spanning lines; three rounded white cards with blue gradient footer bands naming each product.
Product: $0 federal / $15 state with no interruptive upsells, built natively into Credit Karma with one-click start, optional expert final review and faster refunds. Evidence: ~3x greater share of net-new customers vs TurboTax Online overall; highest recommendation score of any TurboTax product, ~14 points higher than TurboTax overall.
Left text column in three blue-headed sections (The product, What it unlocks, Evidence it works); right a phone mockup of Credit Karma 'For you' screen with a large green '$0' file-taxes-free card and Credit Karma Tax tag.
Shift growth toward new-to-the-franchise customers and scale with AI & human intelligence. Priorities: unlock scale with AI and disruptive pricing (Sign & File, Full Service); expand local and omnichannel acquisition (location footprint +30%+, target CPA/tax-store switchers); deepen relationships beyond filing (pre-booking, mid-year check-ins, same-expert continuity).
Takeaway #3 tag, headline and subtitle; three-row priority table.
~1.8x YoY increase in Assisted Tax share; 36% YoY increase in Full Service conversion rate; ~25% of Full Service growth from the transparent $150 offer; ~40% of local-channel customers new to TurboTax. Sign & File currently available on a limited basis.
Header on left; 2x2 grid of big blue stats; right two phone mockups showing 'We're running 137 checks' with $4,100 refund, and 'Your return, signed by an expert who's accountable' with an expert photo and signature.
Evidence of traction vs next phase of execution for Consumer Platform (Money deepening engagement; expand Personal Finance inventory), Assisted Tax (local reaching new customers; scale local into more markets) and DIY Tax (early tests driving incremental customers, AI experiences delivering outcomes; rebuild funnel, grow e-file share).
Centered headline; blue gradient header bar with two column labels; three-row table with large blue row labels on the left.
Three consumer takeaways: Scale the Consumer Platform (Credit Karma as front door), Evolve the Tax Growth Model (rebuild DIY funnel to regain IRS e-file share), Expand Assisted Tax (new-to-the-franchise, expert accountability, AI & Human Intelligence).
Full blue gradient background; 'Key takeaways' heading top-left; translucent rounded panel with three rows, white titles left and descriptions right.
Consumer segment 4-8% compound annual revenue growth over the next three years, driven by increasing IRS e-file share, scaling Assisted Tax, and ARPC growth from personal finance and money; near term customer growth should outpace ARPC growth.
Headline top-left; a large rounded card with glowing border: left inner white panel with 'Long-term growth expectations' pill and big blue '4-8%', right list of growth drivers.
Speaker introduction slide showing only the name Sandeep Aujla, opening the financial section.
Full-bleed blue-to-light gradient background with the speaker name centered in large white type; no other elements.
Four takeaways: Scaling Proven Big Bets (>30% growth in FY26, 7% penetrated $300B+ TAM); Investing to Accelerate New Customer Growth; Expanding Margins (at least high-teens non-GAAP EPS growth); Returning Capital ($6.8B returned in FY26, dividend per share +15%, $7.9B authorization remaining).
Blue gradient background; 'Key takeaways' heading; frosted panel with four rows of title and description.
FY26: revenue +14% to $21.4B; Business Platform +18% to $11.6B (ex-Mailchimp); Consumer Platform +11% to $8.6B; operating margin 27.4% GAAP / 32.1% non-GAAP; operating income +20% GAAP / +23% non-GAAP; EPS +20% GAAP / +25% non-GAAP; FCF +42% to $8.6B; dividend per share +15%; $6.8B returned.
Centered headline; left column lists last year's objectives; right a white card titled 'FY26 outcomes' with Growth, Profitability and Capital allocation blocks of blue percentages; footnotes below.
Progress made: scaled Big Bets 30%+, margin expansion with lower SBC as % of revenue and EPS growth, $8.6B FCF with $6.8B returned. Progress needed: accelerate customer growth, drive ARPC growth through platform adoption, continue expanding margins while funding growth.
Centered headline; two large rounded panels side by side, bright blue 'Progress Made' and dark navy 'Progress Needed', each with three outlined pill boxes.
Five principles: double-digit organic revenue growth; grow operating income dollars faster than revenue; deploy capital to highest-return opportunities; maintain financial flexibility with an investment-grade balance sheet; return excess capital (grow dividend, repurchases at minimum offsetting SBC dilution).
Centered headline; five-row table with blue principle names left and descriptions right, separated by rules.
Business Platform $186B TAM ($97B small business, $89B mid-market) across Payments $38B, Capital $37B, Marketing $31B, Accounting DIY $31B, Workforce $26B, Accounting Assisted $12B, Bill Pay $10B, Banking $1B; Consumer Platform $142B TAM ($95B consumer finance, $47B tax) across Financial Products $61B, Money Management $33B, Consumer Tax $29B, Business Tax $13B, Accountant Services $5B, each against Intuit revenue.
Two-line headline; 'Intuit Platform' gradient band; two panels of grouped/stacked bar charts (Business Platform and Consumer Platform) with TAM totals as large blue numbers.
Total revenue $14.4B (FY23), $16.3B, $18.8B, $21.4B (FY26); Big Bets (Assisted Tax, Money, Mid-Market) are ~30% of total revenue, growing >30% YoY and compounding >30% annually since FY23, >2x the total company rate of 14%.
Centered headline; left an area/line chart of total revenue with the Big Bet share shaded in blue gradient; right a card of three stat callouts.
FY26 outcomes: Assisted Tax customers +38% to 13M and revenue +37% to $2.8B; Consumer Money revenue +26% to $0.6B; Business Money revenue +31% to $1.8B; Mid-Market customers +28% to 449K and revenue +39% to $1.6B.
Centered headline; large blue gradient rounded panel with three rows (done-for-you experiences, money benefits, mid-market) and two big white growth stats per row.
Where we must improve: TurboTax IRS e-file share -1 pt YoY, DIY Tax e-file share -3 pts YoY, Business Platform total online paid customer growth +4% (-2 pts YoY). Strategy: broaden front doors for new-to-the-franchise growth, win priority cohorts with product innovation, grow lifetime value through platform adoption.
Centered headline; wide dark navy-to-blue gradient panel; left three stat tiles, right three strategy statements separated by lines.
Business Platform online customers 6.8M, 7.3M, 7.7M, 7.9M (FY23-26) with FY26 ARPC $1,109 and band CAGRs +19% (>$1,000), +5%, -8% (<$200); Consumer Platform customers 35.5M to 37.4M with FY26 ARPC $198 and band CAGRs +22%, +8%, -11%, -34%.
Centered headline; two side-by-side white cards, each with a stacked bar chart by ARPC band and a blue caption below.
ARPC FY23-26: Mid-Market Ecosystem $3,140 to $4,038; Online Ecosystem $705 to $1,109; Desktop Ecosystem $1,594 to $3,154; TurboTax Live $180 to $221; TurboTax $97 to $130; Credit Karma $38 to $64; TurboTax + Credit Karma $148 to $198; ProTax $4,599 to $5,302; Mailchimp $1,298 to $1,278 (managed for profitability).
Centered headline; full-width data table with blue section header bars (Business Platform, Consumer Platform, Mailchimp), four year columns and a key-drivers column; dense footnotes.
Desktop fell from 15% of Business Platform customers in FY21 to 9% in FY26 (1.0M to 0.8M); enterprise mix rose from 18% to 35% and contributes 53% of Desktop Accounting revenue; QBO Advanced and IES address complex needs.
Left headline with three blue-headed explanation blocks; right stacked bar chart FY21-FY26 of enterprise vs non-enterprise desktop customers with percentage labels.
FY26: revenue $1.3B (-1% YoY), segment operating margin 47.5% (+4.9 pts), segment operating income $604M (+10%). FY27 priorities: dedicated accountability via standalone segment, monetize the base, expand margin and cash contribution.
Centered headline; two white cards side by side: 'FY26 results' with three big blue figures, 'FY27 priorities' with three blue-headed items.
Transition slide pairing the two strategic imperatives: scale our Big Bets plus accelerate new customer growth.
Full blue gradient background with two white phrases on the left and right joined by a central plus sign.
Section divider introducing the financial outcomes portion.
Full blue gradient background with a centered two-line white title.
Revenue $14.4B (FY23) to $21.4B (FY26), 14% CAGR, $7B added; operating margin GAAP 21.9% to 27.4% (+5.6 pts) and non-GAAP 26.4% to 32.1% (+5.7 pts); GAAP operating income compounded 23% and non-GAAP 22%.
Centered headline; two white cards: left bar chart of revenue with growth labels and highlighted FY26 bar, right dual line chart of GAAP and non-GAAP margin with FY26 highlighted.
FY26 % of revenue and long-term expectations: gross margin 80 (up over time), S&M 26 (flat to down), R&D 16 (flat to slightly down), G&A 8, SBC 10 (down to 8% by FY30), amortization 2, operating margin 27 GAAP / 32 non-GAAP; return to double-digit revenue growth.
Centered headline; P&L table with blue line-item labels, a FY26 % of revenue column and a long-term expectation text column.
Strong ROI on ~$110M FY26 token spend: ~4x realized return on AI developer tooling investment (including Claude investment introduced late FY26); 85K+ developer days saved and 40% faster coding velocity; $135M+ customer-service efficiencies; 95% of Consumer Platform AI-first support cases resolved without escalation (89% across expert platform).
Centered headline; left card 'How we drive value' with four blue-headed principles; right card with 2x2 big stat grid; full-width blue banner at bottom with the token spend message.
SBC as % of revenue: 11.9% (FY23), 11.9% (FY24), 10.5% (FY25), 9.6% today (FY26), 8.7% FY27 guide ($2,020M SBC over low-end revenue guide of $23,279M).
Centered headline; line chart with faded earlier years and highlighted FY26-FY27 segment with gradient fill and 'Today' / 'Guide' labels.
Non-GAAP EPS $9.81, $11.82, $14.87, $18.63 (FY23-26, +24% CAGR); GAAP EPS $8.42, $10.43, $13.67, $16.46 (+25% CAGR); diluted shares 283, 284, 283, 277M; FY26 EPS growth 20% GAAP and 25% non-GAAP.
Left headline with three short paragraphs; right stacked bar chart of GAAP and non-GAAP EPS with FY26 bar highlighted in a white card and CAGR callouts, share count row below.
FCF $4.8B, $4.6B, $6.1B, $8.6B (FY23-26, 22% CAGR); FY26 FCF margin 40% (+7 pts since FY23); $24B cumulative FCF FY23-26. FY26 reflects $1.2B deferred tax asset impact from R&D capitalization change.
Left headline with three large blue stats; right bar chart with FY26 highlighted and FCF % of revenue row beneath.
Three pillars: fund organic growth first (innovation and AI, platform expansion, customer acquisition); maintain financial flexibility (investment-grade balance sheet, selective capability M&A); return capital (dividends, share repurchases). Goal: compound earnings and FCF per share.
Centered headline; three outlined rounded cards in a row with blue titles and item lists; blue tagline beneath.
Capital returned $2.9B, $3.0B, $4.0B, $6.8B (FY23-26), 60%, 65%, 65%, 79% of FCF; ~$17B returned FY23-26 (~70% of FCF); dividend per share up 15% per year from $3.12 to $4.80; FY26 repurchases $5.5B, roughly twice FY25, with $7.9B authorization remaining.
Left headline with three paragraphs; right stacked bar chart of dividends and repurchases with FY26 highlighted and % of FCF row.
$5.5B FY26 repurchases representing 13M shares vs 3M net employee issuance; ending common shares fell 11M from 279M to 268M; diluted weighted-average shares down 2% from 283M to 277M.
Left headline with three blue stat callouts; right waterfall bar chart (FY23-FY25 bars, +3 issuance, -13 repurchases, FY26 268) inside a highlighted card.
Next year's objectives: scale Big Bets and accelerate new customer growth; expand operating margin as efficiencies and FY26 workforce-change savings offset investment; grow EPS above at least high-teens non-GAAP target; consistently return capital while keeping a strong balance sheet.
Centered headline; one glowing-border rounded card with 'Next year's objectives' pill and four ruled text lines.
FY27 guidance (millions): total revenue $23,279-$23,512 (+9-10%); Business Platform $13,068-$13,158 (+13-14%); Consumer Platform $8,955-$9,088 (+4-6%) incl. TurboTax $5,377-$5,453 (+2-3%), Credit Karma $2,919-$2,973 (+11-13%), ProTax $659-$662 (+2%); Mailchimp $1,256-$1,266 (-1% to 0%).
Centered headline; full-width blue header bar (Growth / FY27 Guidance) above a guidance table with highlighted total revenue row and indented sub-lines.
Operating income GAAP $7,408-$7,490 (+26-27%), non-GAAP $8,063-$8,145 (+17-18%); operating margin 32% GAAP (+440 bps), 35% non-GAAP (+260 bps); EPS GAAP $20.12-$20.36 (+22-24%), non-GAAP $22.88-$23.12 (+23-24%); Q1 FY27 dividend per share $1.38 (+15%).
Centered headline; guidance table with blue section bars for Profitability and Disciplined Capital Allocation, GAAP/non-GAAP sub-rows.
GAAP basis FY23-26 and FY27 guide: revenue 14.4 to 21.4 ($B, +14% CAGR) to $23.3-23.5B (+9-10%); operating margin 21.9% to 27.4% to 32% (+440 bps); operating income 3.1 to 5.9 ($B, +23% CAGR) to $7.4-7.5B (+26-27%); EPS $8.42 to $16.46 (+25% CAGR) to $20.12-20.36 (+22-24%).
Centered headline; one wide card with four small-multiple bar charts, faded historic bars and a solid blue FY27 guide bar with arrow and growth label.
Long-term expectations: Global Business Solutions segment 10-15% revenue CAGR over next three years; Consumer segment 4-8%; Intuit at least high-teens annual non-GAAP EPS growth.
Centered headline; glowing-border card with two white columns of big blue ranges and a solid blue highlighted tile on the right for 'High teens'.
New baseline KPIs: Mid-Market customers 449K (+28%), Mid-Market Ecosystem revenue $0.4B (+38%), IES annualized revenue $146M, Business Money TPV $66B (+32%), total online paid customers 7.9M (+4%), US QBO Core paid 5.3M (+4%), Online Ecosystem ARPC $1.1K (+18%); TurboTax Live customers 12.8M (+38%) and revenue $2.8B (+37%), Consumer Platform customers 37.4M (+2%), ARPC $198 (+11%), TurboTax IRS e-file share 24.9% (-1.0 pts).
Centered headline; two side-by-side panels with blue headers (Business Platform, Consumer Platform), each containing two metric tables with baseline and YoY columns.
Definitions for each disclosed metric, e.g. total online paid customers (worldwide Online ecosystem payers excluding Desktop and Mailchimp), Business Money TPV (QuickBooks Payments and Bill Pay volume incl. BNPL), TurboTax share of IRS e-files, TurboTax Live customer and revenue growth.
Left-aligned title; dense two-column definitions table with blue section bars for Business Platform and Consumer Platform.
Repeat of the four finance takeaways: Scaling Proven Big Bets (>30%, 7% penetrated $300B+ TAM), Investing to Accelerate New Customer Growth, Expanding Margins (at least high-teens non-GAAP EPS growth), Returning Capital ($6.8B in FY26, dividend +15%, $7.9B authorization remains).
Blue gradient background; 'Key takeaways' heading; frosted panel with four rows, identical to page 130.
Divider introducing the appendix.
Full blue gradient background with 'Appendix' in large white type, left-center.
Explains non-GAAP measures reconciled in Tables 1-3 and notes that beginning Q1 FY27 non-GAAP measures no longer exclude share-based compensation, with all periods recast; lists excluded items such as amortization, restructuring, deferred comp gains/losses, impairments and disposal gains/losses.
Title top-left; dense paragraphs and bulleted lists of legal/accounting text on the light gradient background.
Rationale for non-GAAP use and descriptions of excluded items: amortization of acquired technology and intangibles, restructuring charges, executive deferred compensation liabilities, goodwill impairment, disposals, professional fees for business combinations.
Title top-left; full-width paragraphs with italic item names.
Covers gains/losses on debt securities and deferred comp plan assets, income tax effects using a long-term non-GAAP tax rate of 24% for FY26 and FY27, discontinued operations, and reconciliation of forward-looking guidance.
Title top-left; paragraph text with italic item headings.
FY23-FY26 reconciliation from GAAP to non-GAAP operating income, margin, net income and EPS (e.g. FY26 GAAP EPS $16.46 vs non-GAAP $18.63; non-GAAP tax rate 24%), recast to include SBC.
Title across top; left a dense financial table with four fiscal-year columns; right explanatory notes [A]-[C].
Twelve months ending July 31, 2027: revenue $23,279-$23,512; GAAP operating income $7,408-$7,490 plus $655M adjustments to non-GAAP $8,063-$8,145; includes $2.0B SBC; adjustments are ~$483M intangibles amortization, ~$150M acquired technology, ~$22M restructuring.
Title top-left; small GAAP/adjustments/non-GAAP range table on left; explanatory text on right.
Operating cash flow $8,838M (FY26), $6,207M, $4,884M, $5,046M (FY23) less capex of $221M, $124M, $250M, $260M gives FCF of $8,617M, $6,083M, $4,634M, $4,786M.
Title top-left; compact four-column table on the left, definition paragraph on the right, much white space.
Safe-harbor disclaimer listing forward-looking topics (FY27 guidance, growth, AI efficiencies, tax rate, dividends and repurchases, SBC) and risk factors; refers to the FY26 Form 10-K and investors.intuit.com.
Title top-left; three dense paragraphs of legal text filling the slide.
Levinud küsimused selle slaidi ja esitluse sisu kohta.
It is the 168-slide deck Intuit presented at its investor day on September 17, 2026. It walks through CEO Sasan Goodarzi's growth strategy, CTO Alex Balazs's technology and AI section, deep dives on the Global Business Solutions and Consumer platforms, and CFO Sandeep Aujla's financial review with FY27 guidance, followed by a non-GAAP reconciliation appendix.
The deck reports FY26 revenue of $21.4B (+14%) and free cash flow of $8.6B, then gives FY27 guidance of $23.3–23.5B revenue (+9–10%) and non-GAAP EPS of $22.88–23.12. Long-term expectations are 10–15% revenue growth for Global Business Solutions, 4–8% for Consumer, and at least high-teens non-GAAP EPS growth.
Each speaker opens with a full-bleed name card, followed by key takeaways, results, a progress made vs. progress needed slide, TAM, strategic priorities, numbered takeaway sections with proof points, and a long-term outlook. That repeatable pattern adapts well to any company presenting several business units at an investor or capital markets day.
AI runs through the whole deck: Intuit Intelligence as a unified agentic platform, product demos (including Intuit Intelligence inside third-party AI assistants), 2.5M monthly Intuit Intelligence users in the business platform, 70% of merged pull requests being AI-assisted, and roughly $110M of FY26 token spend. It is a good reference for presenting AI strategy to investors with measurable proof points.
It uses Intuit's blue-to-cyan gradient palette on white and pale-blue backgrounds, thin sans-serif typography, rounded glowing cards, frosted-glass panels, pill-shaped 'Takeaway #N' tags and large light-weight stat callouts. Product slides pair dark lifestyle photos of phones and laptops with labeled callouts.
Yes. The gallery page offers the original PDF and a PPTX version converted from it, so you can study the layouts or adapt individual slides. The PPTX is a conversion of the PDF rather than Intuit's source file, so expect some elements to be flattened images.
It covers TurboTax (DIY and Assisted Tax), Credit Karma, QuickBooks and the Intuit Enterprise Suite for mid-market companies, Business Money products such as payments, payroll and bill pay, the accountant ecosystem, and Mailchimp, which becomes its own reportable segment from August 1, 2026.
Intuit publishes investor day materials, earnings releases and SEC filings on its investor relations site at investors.intuit.com. Figures in the deck include forward-looking statements and non-GAAP measures, which are reconciled in the appendix slides.
Official source for Intuit investor day materials, earnings releases and SEC filings

Create Your Own Slides
Turn your ideas into professional presentations in seconds with 2slides AI.
Võta eeskuju professionaalsetest disainidest, vali oma stiil ja genereeri slaidid täiusliku tekstirenderdusega. Nano Banana jõul – alusta oma esitluse loomist kohe.
Your AI Agent for slides. Save time, shine faster with intelligent presentation creation.




© 2026 2slides. All rights reserved.