
Kuulub kogumikku Investoresitluste näited · Jaapani investoriesitluste näited
Central Japan Railway (JR Central / JR東海) H1 FY2026 earnings presentation: the 21-page Japanese-language deck for the six months April–September 2026 (fiscal year ending March 2027), filed on TDnet (Tokyo Stock Exchange timely disclosure) on 29 October 2026. It covers higher revenue but lower profit, an upward revision to the full-year forecast, a raised dividend plus an additional buyback, a new growth strategy built on more Nozomi trains, Nozomi and Green Car surcharge increases and event-led demand creation, Tokaido Shinkansen traffic and inbound revenue, and progress on the Chuo Shinkansen maglev.
Kasutab selle esitluse kaanepilti stiilieeskujuna slaididele, mis luuakse sinu enda sisust. Või vali allpool mõni leht ja kasuta selle paigutust eeskujuna.
Kiirnavigatsioon
Sildid
Jaga slaide
Central Japan Railway (JR Central / JR東海) H1 FY2026 earnings presentation: the 21-page Japanese-language deck for the six months April–September 2026 (fiscal year ending March 2027), filed on TDnet (Tokyo Stock Exchange timely disclosure) on 29 October 2026. It covers higher revenue but lower profit, an upward revision to the full-year forecast, a raised dividend plus an additional buyback, a new growth strategy built on more Nozomi trains, Nozomi and Green Car surcharge increases and event-led demand creation, Tokaido Shinkansen traffic and inbound revenue, and progress on the Chuo Shinkansen maglev.
Iga slaidilehe üksikasjalik vaade, sealhulgas paigutus, põhisisu ja visuaalsed elemendid.
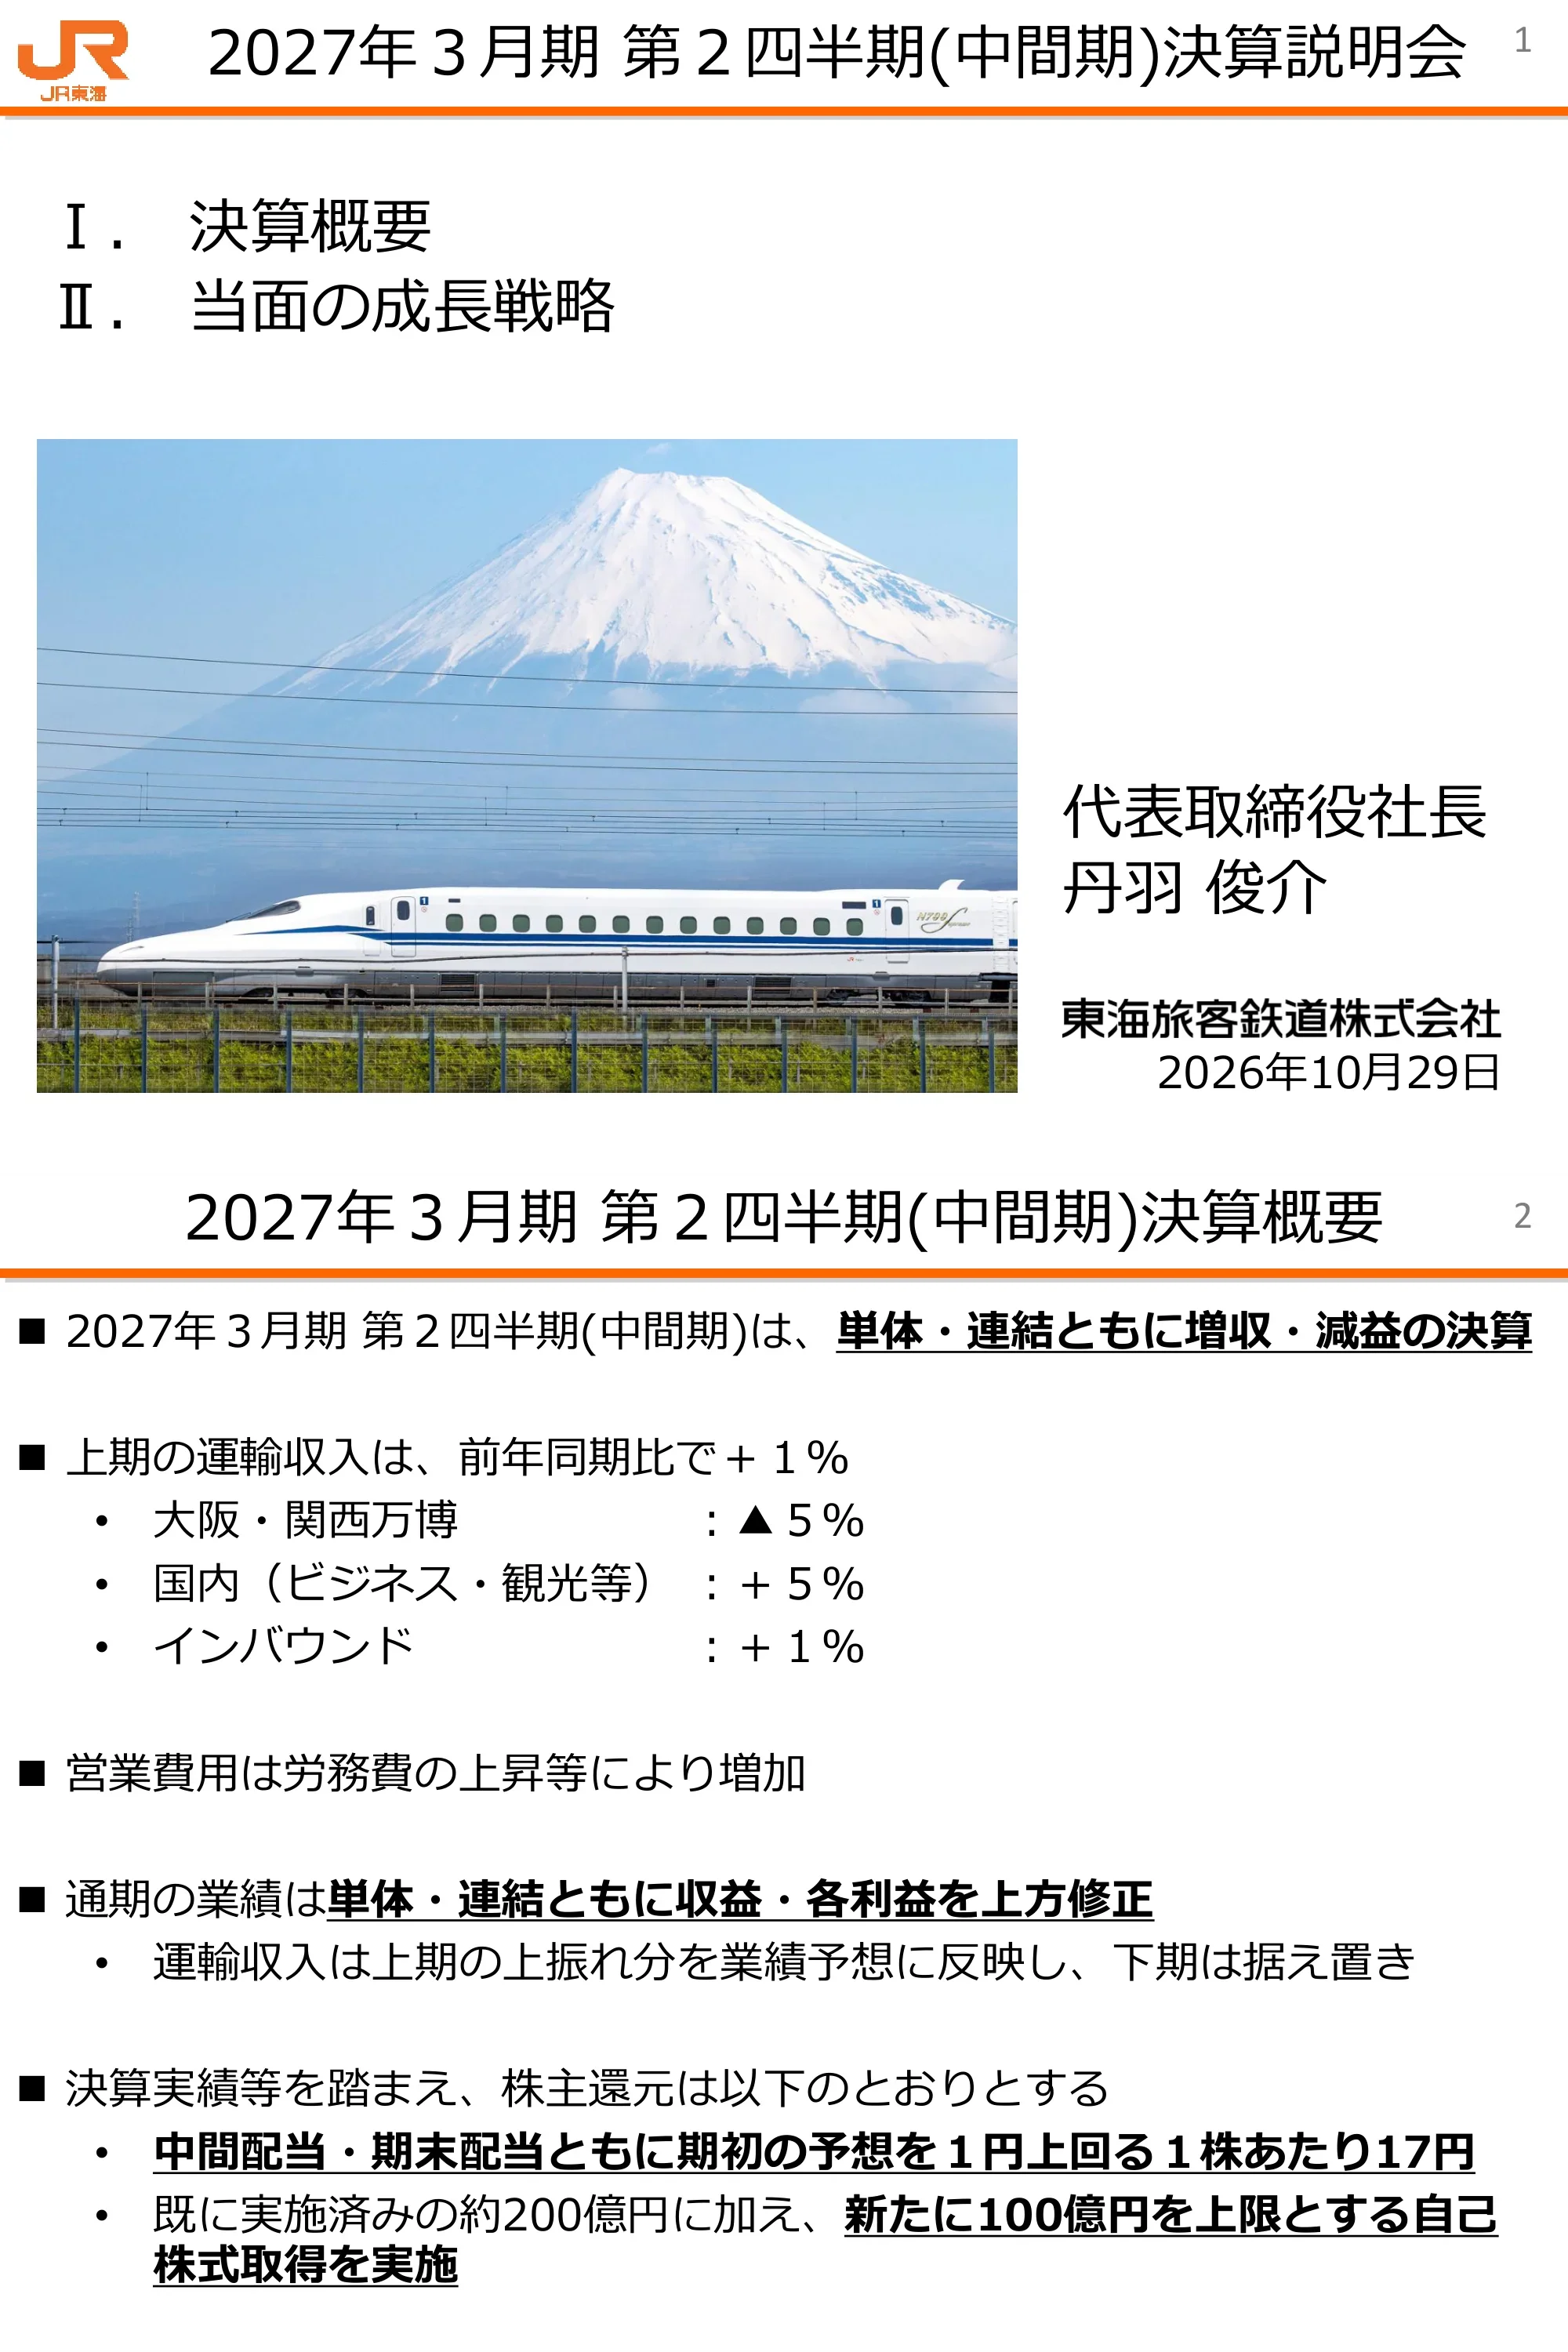
Title slide for the 2027年3月期 第2四半期(中間期)決算説明会 (results briefing for the first half of the fiscal year ending March 2027), listing Part I: Results overview and Part II: Near-term growth strategy, presented by Representative Director and President Shunsuke Niwa, Central Japan Railway Company, dated 29 October 2026.
JR Central orange logo top-left, large title with an orange rule beneath, two-item Roman-numeral agenda, large photo of an N700S Shinkansen passing Mount Fuji on the left, presenter name and company/date on the right.
Both non-consolidated and consolidated results show higher revenue but lower profit. H1 transportation revenue rose +1% year on year: Osaka-Kansai Expo effect −5%, domestic (business, tourism etc.) +5%, inbound +1%. Operating expenses rose mainly on higher labour costs. The full-year forecast is revised upward for revenue and every profit line at both levels; transportation revenue reflects the H1 upside, with H2 left unchanged. Shareholder returns: interim and year-end dividends each ¥17 per share, ¥1 above the initial forecast, and a new share buyback of up to ¥10 billion (100億円) on top of roughly ¥20 billion (約200億円) already executed.
Text-only summary with square bullets and sub-bullets; key conclusions in bold underlined text.
Context: the Tokaido Shinkansen is the core of JR Central's growth and has delivered high earnings power, but under the current fare-ceiling approval system based on the total-cost (総括原価) method, the company cannot revise its fare ceilings even when inflation raises costs. Response: dealing with inflation is made a management priority, pushing three self-executable revenue measures — ① service improvement (more Nozomi trains) as the foundation for ② fare and surcharge strategy (higher unit price) × ③ demand creation = revenue growth. The company will also keep lobbying for a system that lets inflation-driven costs be reflected in fares flexibly and for making Shinkansen non-reserved limited-express charges notification-based.
Two labelled text blocks (environment / response) above a rounded light-blue diagram box with three coloured boxes and red arrows, followed by a closing bullet.
JR Central has grown traffic by adding Nozomi trains at peak times. Since March 2026 the timetable allows up to 13 Nozomi trains per hour in some busy time slots, yet in peak seasons reserved seats still sell out in some hours. From the next timetable revision the company will increase the number of hours with 13 trains per hour and aims to raise this to 14 in future. Two stacked bar charts show the number of Nozomi trains that can be scheduled per hour, split into regular and extra (seasonal) trains, by Tokyo departure hour (06–21) and Tokyo arrival hour (08–23), with the 13-train slots outlined in blue.
Two bullets on top, two side-by-side stacked bar charts in the middle, two bullets at the bottom (one bold underlined).
The company will introduce higher-quality, more diverse services and price them accordingly. Revising the Nozomi and Green Car surcharges is expected to add around ¥50–60 billion (500〜600億円) a year. Nozomi surcharge: raised to the approved ceiling from July 2027, e.g. Tokyo–Shin-Osaka from ¥320 now to the ¥1,020 ceiling (+¥700), worth ¥35–40 billion (350〜400億円) a year. Green surcharge: revised alongside Green Car service upgrades from December 2027, worth ¥15–20 billion (150〜200億円) a year. Supreme Class (Cabin private rooms from October 2026 onward; Seat semi-private from within FY2027) will be priced to match the service and is expected to add about ¥10 billion (約100億円) a year over roughly 15 years.
Two headline bullets each followed by a four-column table (item / content / timing / annual revenue impact).
Since COVID-19 the company has created demand through partnerships with content holders, event attraction and inbound sales promotion. Beyond attracting already-decided events, it will add editions of large annual events along its lines and create new events with sponsors, aiming to generate passenger flows and Shinkansen usage. Events under preparation: a Tokyo food event also held in Kyoto (January 2027), a Kyushu logistics exhibition also held in Nagoya (June 2027), and new concerts along the line with major music labels and media (from December 2026 onward); illustrative revenue of tens of millions to several hundred million yen per event (数千万円〜数億円/回). A photo shows the dancyu Festival in Kyoto, scheduled for January 2027.
Bullet text on top, three-column table bottom-left, event photo with caption bottom-right.
Second section cover listing III. Transportation trends, IV. FY ending March 2027 Q2 (interim) results, V. FY ending March 2027 forecast, VI. Shareholder returns, VII. Status of the Chuo Shinkansen project; presented by Representative Director and Executive Vice President Ataru Kimura, Central Japan Railway Company, 29 October 2026.
Repeat of the cover template: logo, title, Roman-numeral agenda, large photo of the L0 series maglev train, presenter block bottom-right.
Tokyo-gate cross-section passenger volume versus FY2025, by month: April 103%, May 105%, June 96% (estimated 99% excluding natural-disaster impact), July 103%, August 101%, September 99%; Q1 101%, Q2 101%, H1 101%. Ridership was solid and H1 volume exceeded FY2025, when the Expo was held. Using the timetable with up to 13 Nozomi trains per hour on some time slots (set on 19 days in H1) captured strong demand, alongside the Oshi-Tabi campaign and private charter car packages.
Line chart with labelled data points across the top two-thirds, callout box on the June dip, quarter labels inside the chart, three bullets below.
Waterfall comparing H1 transportation revenue: FY2025 H1 ¥785.4 billion (7,854億円) to FY2026 H1 ¥794.5 billion (7,945億円), or 101% of FY2025. The +1% breaks down into Expo −5%, domestic (business, tourism etc.) +5% and inbound +1%.
Waterfall / bridge chart with two white total bars and coloured change blocks, two bullets beneath.
Estimated H1 inbound revenue was about ¥83 billion (約830億円), 106% of FY2025. Quarterly estimates (rounded down to ¥1 billion): FY2025 Q1 450, Q2 320, Q3 440, Q4 330; FY2026 Q1 490, Q2 340 (¥100 million). FY2025 H1 was about ¥78 billion; the Expo ran 13 April – 13 October 2025. The company runs campaigns such as Golden Route with the Shinkansen (launched March 2026) with local governments and promotes sales with travel agencies to capture foreign visitor demand.
Boxed headline, blue column chart with value labels and red brackets for half-year totals, bullet bottom-left, campaign visual bottom-right.
Usage by major corporate members of Express Reservation is trending upward. The line chart indexes average weekday usage of the top 200 EX corporate members (FY2023 Q1 = 100) from FY2023 Q1 through FY2026 Q2; values are plotted without data labels, rising from 100 to a peak near 145 in FY2025 Q3 and standing at roughly the high 130s in FY2026 Q2. The company is pursuing MICE attraction, more EX corporate members and the GreenEX service, which makes CO2 emissions effectively zero, to stimulate business demand.
Boxed headline, quarterly line chart with fiscal-year dividers, bullet at the bottom.
Units: ¥100 million (億円). Operating revenue 10,129 vs 9,822 (+307, 103.1%): transportation 8,217 (+95), merchandise and other 902 (+59, station shops and department stores), real estate 287 (+20, station commercial rents), other 723 (+131, rolling stock manufacturing). Operating expenses 5,658 (+376). Operating income 4,471 vs 4,540 (−68, 98.5%). Non-operating income 200 (+71, investment interest), expenses 412. Ordinary income 4,259 (+2, 100.1%). Extraordinary loss −48 (impairment on affiliate shares). Income taxes 1,288 (+54, start of the defence special corporate tax). Net income attributable to owners of parent 2,884 vs 2,981 (−96, 96.8%).
Full-width financial table with peach header row, FY2026 column outlined in red, change, ratio and explanation columns.
Units: ¥100 million. Operating revenue 8,329 vs 8,230 (+98, 101.2%), of which transportation revenue 7,945 (+90: Shinkansen +78, conventional lines +11). Operating expenses 4,114 (+206, 105.3%): personnel 968 (+45, base-pay rise), non-personnel 2,008 (+173) including energy 325 (+33, higher power prices), maintenance 686 (+78, higher labour rates) and general 996 (+60, systems and advertising); taxes 230; depreciation 907 (−14). Operating income 4,214 (−108, 97.5%). Ordinary income 3,981 (−40, 99.0%). Extraordinary loss −39. Net income 2,729 vs 2,834 (−105, 96.3%).
Same table template as page 12 with nested indented cost lines.
Units: ¥100 million. Consolidated FY2026 forecast (new vs previous): operating revenue 20,490 vs 19,930 (+560), operating expenses 12,920, operating income 7,570 vs 7,020 (+550), ordinary income 7,150 vs 6,530 (+620), net income attributable to owners of parent 4,870 vs 4,470 (+400); versus FY2025 actual 5,528 that is −658 (88.1%). Non-consolidated: operating revenue 16,730 (+420), of which transportation revenue 15,940 (+400); operating expenses 9,670 (−50); operating income 7,060 (+470); ordinary income 6,590 (+530); net income 4,550 vs 4,210 (+340).
Wide table with FY2025 actual (A), previous forecast (B), new forecast (C, red outline), C−B and C/B, C−A and C/A columns; consolidated and non-consolidated blocks.
JR Central keeps a stable dividend because it must make safety investments while building retained earnings to fund Chuo Shinkansen construction. A dual-axis chart shows annual dividend per share (bars, left axis in yen) and non-consolidated net income (red line, right axis in ¥100 million) from FY1998 to FY2026 plan, with the last three dividends labelled 31, 32 and 34 (FY2026 plan); net income turned negative in FY2020–2021. Note: figures are adjusted for the 100-for-1 split on 1 October 2012 and the 5-for-1 split on 1 October 2023. Given solid ridership, H1 transportation revenue above plan and the upgraded forecast: interim and year-end dividends of ¥17 each (¥1 above the initial forecast) and an additional buyback of up to ¥10 billion on top of about ¥20 billion already executed.
Bullet on top, wide dual-axis combo chart in the middle, bullets beneath.
Map of main construction contract sections as of 30 September 2026 across Tokyo, Kanagawa, Yamanashi, Nagano, Gifu, Shizuoka and Aichi: contracted sections in red, uncontracted in blue, the Yamanashi Maglev Line in orange, contracted emergency exits/substations, stations and the rolling-stock depot marked, plus deep-underground sections at the Tokyo and Nagoya ends. Four photos: First Chukyo-ken Tunnel (Meijo section) in full-scale excavation, viaduct work at the planned Gifu Prefecture station, breakthrough of the Third Minami-Koma Tunnel main bore on the Shinagawa side, and superstructure work on the Sagamigawa bridge.
Large route map with legend across the top half, four captioned construction photos in a row below.
Plans and forecast figures in the material are outlooks based on information currently available and involve risks and uncertainties, such as economic and business conditions, consumer trends, competition involving the company and its subsidiaries, and changes in laws and regulations.
Blank slide with a single dotted-border text box at the bottom.
Units: ¥100 million. Interim results (including intersegment sales): operating revenue 10,129 — transportation 8,282, merchandise and other 950, real estate 464, other 1,326, adjustments −893. Segment profit (operating income) 4,471 — transportation 4,174 (−107), merchandise 83 (+11), real estate 137, other 86 (+23), adjustments −9. Full-year forecast (new vs previous): revenue 20,490 vs 19,930 — transportation 16,630, merchandise 1,940, real estate 950, other 3,240; operating income 7,570 vs 7,020 — transportation 6,980 (+470), merchandise 160, real estate 230, other 230 (+60).
Two side-by-side tables (actuals and forecast) with red-outlined current columns and footnotes.
Units: ¥100 million. H1 operating revenue / operating income: JR Tokai Takashimaya 326 / 42 (138.2%), JR Central Building 173 / 19, JR Tokai Hotels 144 / 1 (21.5%), Nippon Sharyo 470 / 52 (132.5%); Nippon Sharyo interim net income 54. Full-year plans (new): JR Tokai Takashimaya revenue 679, operating income 91; JR Central Building 359 / 23; JR Tokai Hotels 312 / 1; Nippon Sharyo 1,110 / 125 (145.3% of previous plan), ordinary income 133, net income 96.
Two blue-header tables (actuals and forecasts) with red-outlined current columns and black-outlined operating-income blocks; alternating lavender row shading.
Bilingual table of year-on-year passenger volume (%). Tokyo-gate Shinkansen total by month: 26/04 103, 26/05 105, 26/06 96, 26/07 103, 26/08 101, 26/09 99; H1 (26/04-09) total 101, Nozomi 101, Hikari 100, Kodama 105, weekdays 101, weekends 102; Osaka gate 98; conventional express 102; Nagoya area 102. Golden Week (4/24–5/6): Shinkansen total 104, Nagoya area 106. Obon (8/7–8/16): Shinkansen total 101, Nagoya area 105. Footnotes define the cross-section and ticket-gate counting bases.
Large Japanese/English monthly table with peach headers and highlighted quarterly subtotal rows, two smaller peak-season tables below, footnotes.
JR Nagoya Takashimaya and Takashimaya Gate Tower Mall sales (¥ million, fiscal year March 2026–February 2027): 26/03 21,021 (106.8%), 26/04 17,712 (106.1%), 26/05 19,669 (118.0%), 26/06 18,697 (109.5%), 26/07 18,679 (107.8%), 26/08 17,377 (105.1%), 26/09 17,637 (107.4%). Hotel occupancy April–September 2026: Nagoya Marriott Associa Hotel between 73.2% (August, −3.6 points) and 84.6% (September, +7.4 points); Nagoya JR Gate Tower Hotel between 80.6% (August) and 86.3% (July), with September at 83.8% (+1.3 points). Monthly figures are preliminary.
Two bilingual tables side by side (commercial facilities left, hotels right) with peach headers and a note line.
Levinud küsimused selle slaidi ja esitluse sisu kohta.
It is JR Central's results briefing deck (決算説明会資料) for the first half of the fiscal year ending March 2027, covering April–September 2026. It was released on 29 October 2026 and covers interim results, the upgraded full-year forecast, shareholder returns, a near-term growth strategy and the Chuo Shinkansen project.
The original deck is in Japanese (2027年3月期 第2四半期(中間期)決算説明会) and was filed on TDnet, the Tokyo Stock Exchange timely disclosure system. The page-by-page analysis on this page translates slide titles and key figures into English; amounts keep the company's unit of ¥100 million (億円).
JR Central's fiscal year runs from April to March. The deck labels the year from April 2026 to March 2027 as 2026年度 (FY2026); its formal Japanese name is the fiscal year ending March 2027 (2027年3月期). H1 is April–September 2026.
Consolidated operating revenue was ¥1,012.9 billion (10,129億円, 103.1%), operating income ¥447.1 billion (4,471億円, 98.5%) and net income attributable to owners of parent ¥288.4 billion (2,884億円, 96.8%). Non-consolidated transportation revenue was ¥794.5 billion (7,945億円), up 1%.
It raised the consolidated full-year forecast to operating revenue of 20,490億円, operating income of 7,570億円 and net income of 4,870億円. It also raised the interim and year-end dividends to ¥17 each (¥1 above the initial forecast) and announced a new buyback of up to 100億円, on top of about 200億円 already executed.
Three measures: run more Nozomi trains (more hours with 13 per hour, aiming for 14), raise the Nozomi surcharge to its approved ceiling from July 2027 and revise the Green surcharge from December 2027 (together about 500–600億円 a year), add Supreme Class at about 100億円 a year over around 15 years, and create demand through events held along the line.
Yes. The original PDF is available, along with a PPTX version converted from it, which you can open in PowerPoint, Keynote or Google Slides and adapt as a template for your own results presentation or guidance update.
Investors and analysts following Japanese railway and infrastructure stocks, IR teams preparing interim results briefings, and designers who want a clean, table-driven Japanese corporate reporting layout with waterfall, line, column and dual-axis charts.
Original Japanese-language presentation PDF filed on the Tokyo Stock Exchange timely disclosure system.

Create Your Own Slides
Turn your ideas into professional presentations in seconds with 2slides AI.
Võta eeskuju professionaalsetest disainidest, vali oma stiil ja genereeri slaidid täiusliku tekstirenderdusega. Nano Banana jõul – alusta oma esitluse loomist kohe.
Sinu AI-agent slaidide loomiseks. Säästa aega ja sära kiiremini nutika esitluste loomisega.


© 2026 2slides. Kõik õigused kaitstud.