
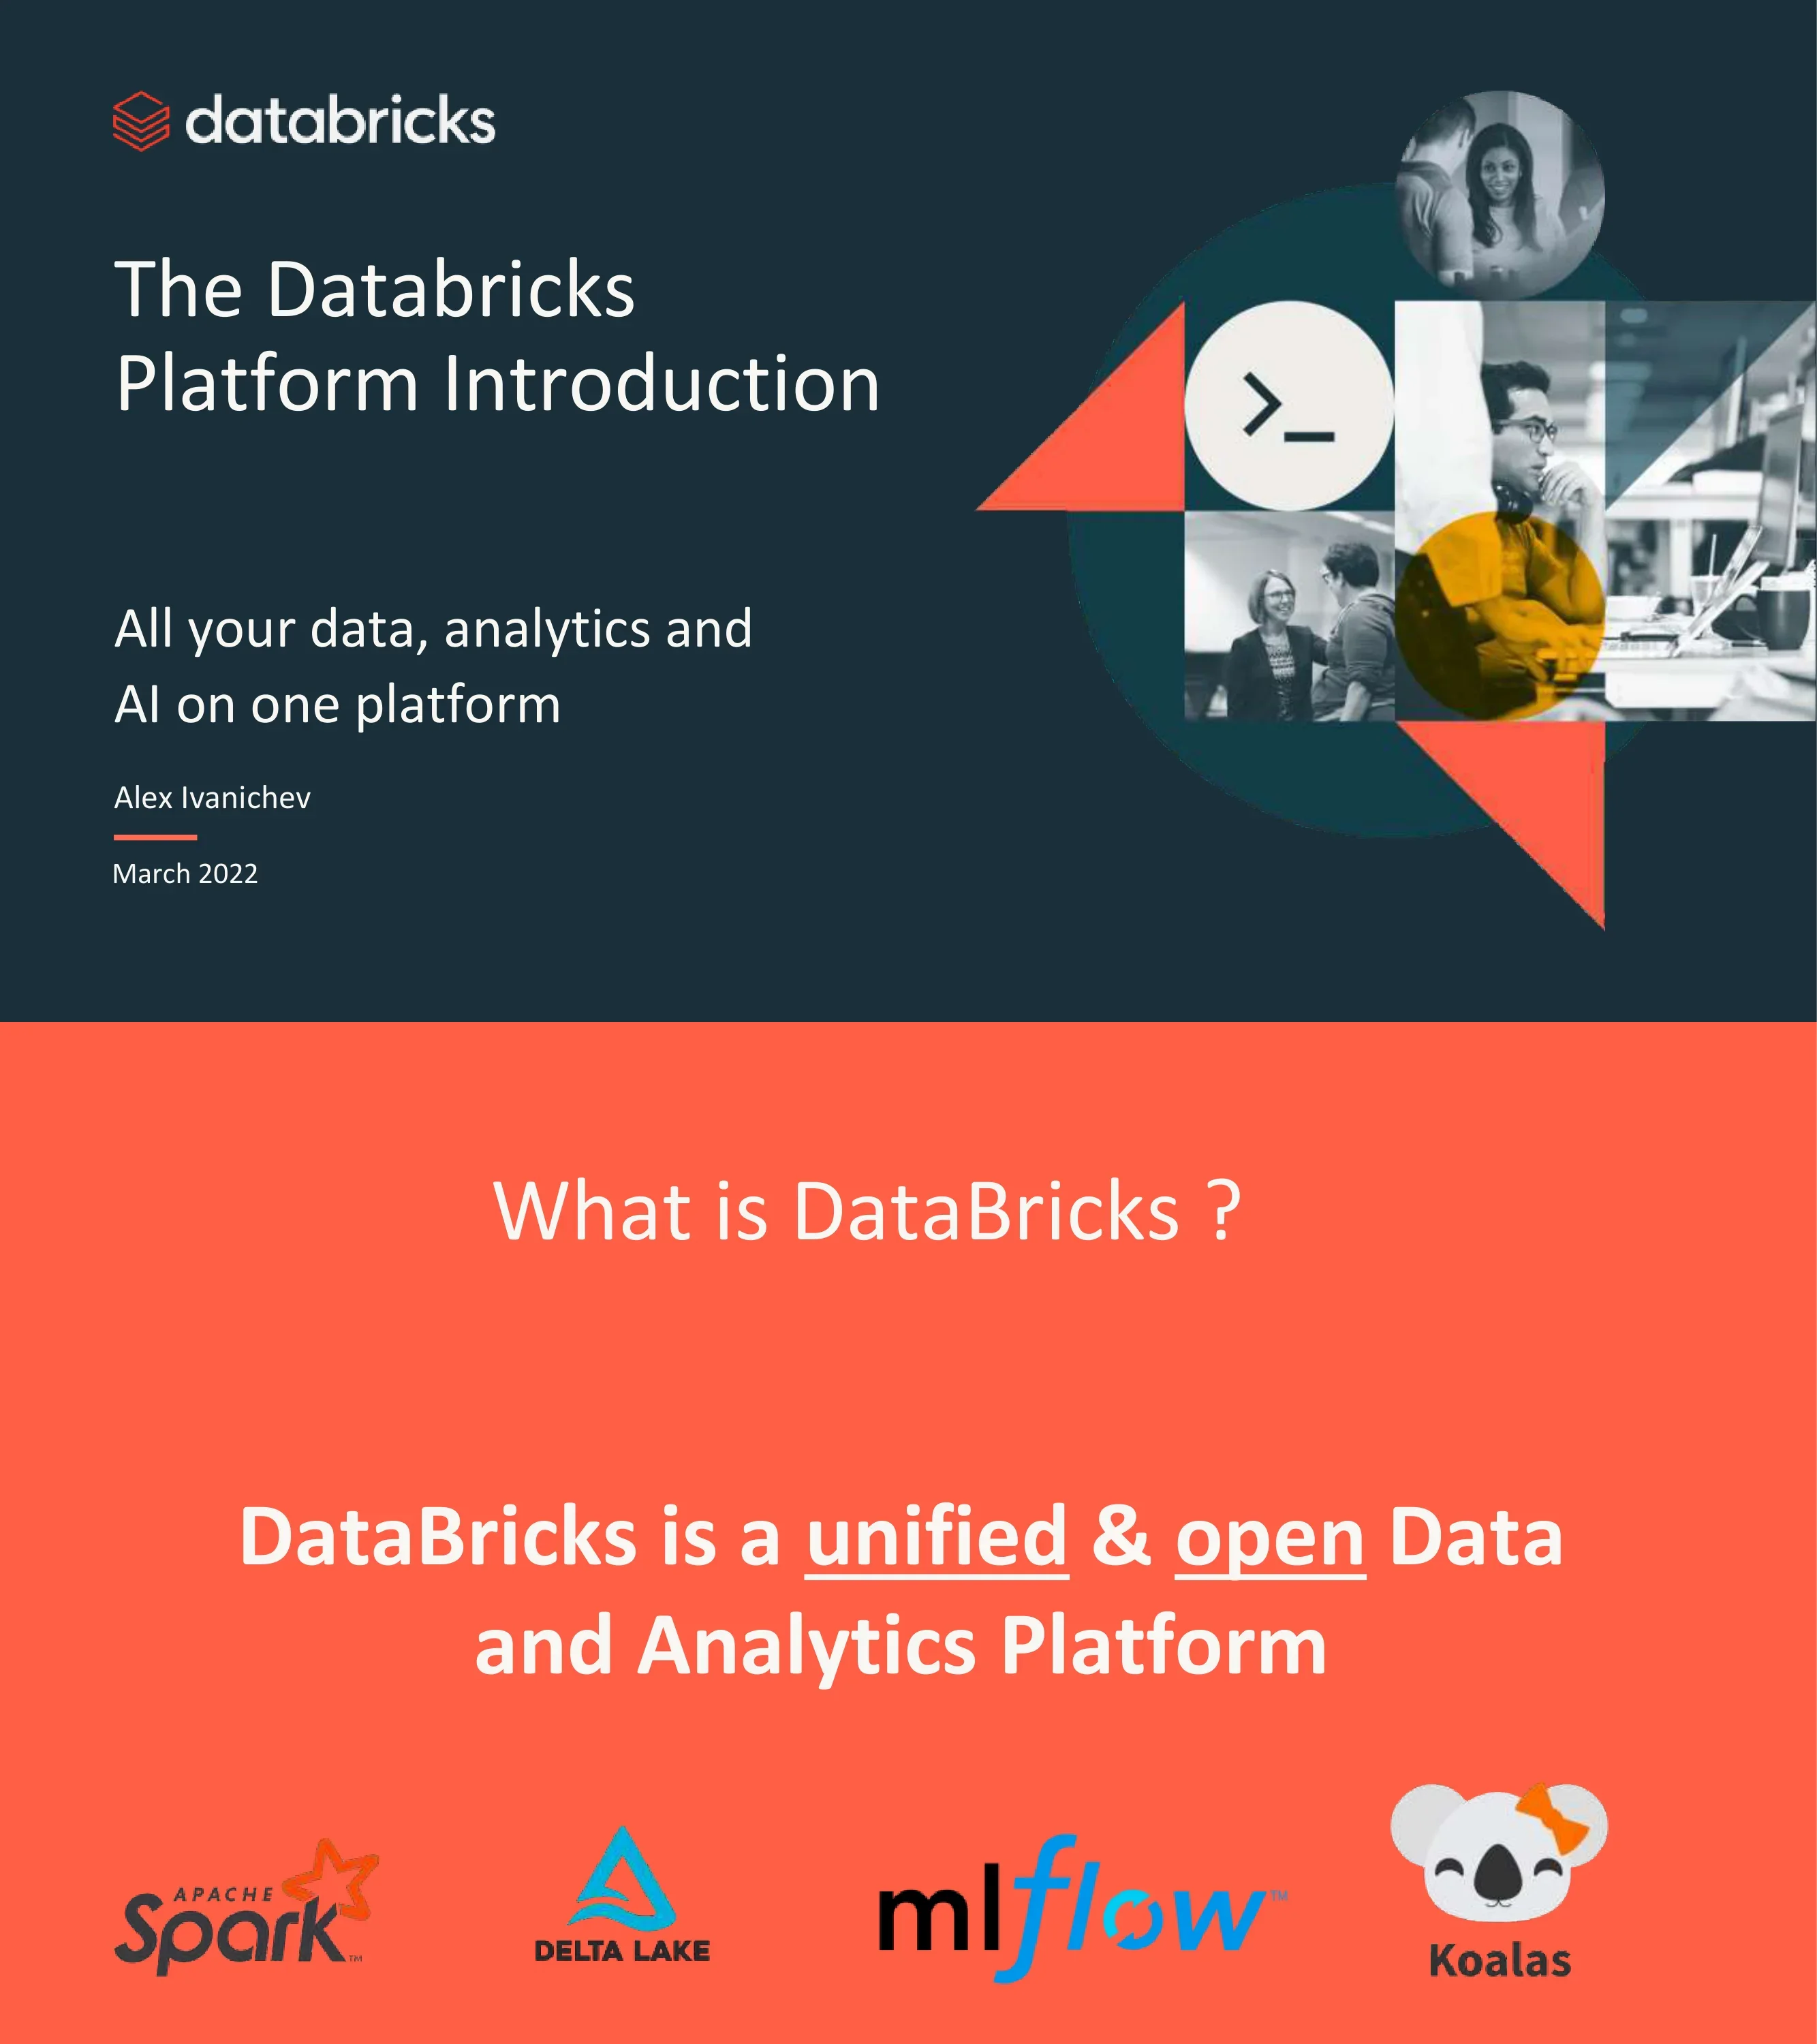
The Databricks Platform Introduction — All Your Data, Analytics and AI on One Platform
Schnellnavigation
Tags
Folien teilen
The Databricks Platform Introduction — All Your Data, Analytics and AI on One Platform
Detaillierte Ansicht jeder Folien-Seite, einschließlich Layout, wichtigem Inhalt und visuellen Elementen.
Title slide — All your data, analytics and AI on one platform. By Alex Ivanichev, March 2022
Left-aligned title with author/date, geometric photo collage on right
DataBricks is a unified & open Data and Analytics Platform. Built on open-source: Apache Spark, Delta Lake, MLflow, and Koalas
Centered text on coral background with four OSS logos at bottom
Visual navigation placeholder showing key sections of the presentation
Simple agenda layout
Section divider introducing the current state of data management challenges
Centered white text on green background
Three siloed stacks — Data Warehousing, Data Engineering, Data Science/ML — with disconnected systems and proprietary formats. Shows ETL flows between data warehouse, data lake, streaming, and ML pipelines
Three-column header with architecture flow diagram below
Triangle diagram showing the three key roles in modern data teams: Data Analysts, Data Engineers, and Data Scientists
Centered triangle with role icons at each vertex
Visual comparison of Data Warehouse (structured, database icon) vs Data Lake (unstructured, waves icon)
Two large icons side-by-side with labels
Three dimensions of complexity: two separate copies of data (Proprietary vs Open), incompatible interfaces (SQL vs Python), incompatible security/governance models (Tables vs Files)
Three comparison rows with warehouse vs lake columns
One platform to unify all data, analytics, and AI workloads. Combines Data Warehouse and Data Lake into a single layer supporting Streaming Analytics, BI, Data Science, and Machine Learning
Centered architecture diagram with data flow from both warehouse and lake into unified layer
Side-by-side comparison of Modern Data Stack (Fivetran → Airflow → dbt → Snowflake → Looker/Tableau) vs Databricks Ecosystem (Fivetran + 100 tools → Object Storage → Auto Ingest → Delta + Spark → Delta Live Tables → Databricks SQL)
Two-column vertical flow comparison
Lakehouse architecture stack: Cloud Data Lake at bottom (Azure, AWS, GCP), open format storage, data processing, security/governance, and role-based experiences on top. Benefits: lake-first, AI/ML native, high reliability, multi-cloud
Stacked architecture diagram on left, bullet points on right
Section divider for the Data Lakehouse Foundation chapter
White text on dark teal background with geometric accent shapes
Delta Lake bridges Data Lake and Data Warehouse — an open approach to data management and governance. Key benefits: better reliability with transactions, 48x faster processing with indexing, fine-grained access control
Three-column layout: Data Lake icon | Delta Lake logo + benefits | Data Warehouse icon
Open source project for Lakehouse architecture on data lakes. Storage layer with ACID transactions for Spark. Key features: ACID Transactions, Scalable Metadata, Time Travel, Open Format, Change Data Feed, Unified Batch/Streaming, Schema Enforcement/Evolution, Audit History
Title with bullet points in two columns
Three challenges solved: Reliability & Quality → ACID transactions, Performance & Latency → Advanced indexing & caching, Governance → Governance with Data Catalogs
Three rows with arrows from challenge to solution
Transaction log structure: Add File, Remove File, Update Metadata, Set Transaction, Change Protocol, Commit Info. Shows _delta_log directory with JSON commits and parquet file add/remove operations
Bullet list at top, two code/diagram panels below
Delta Lake generates checkpoint files every 10 commits in Parquet format. Shows checkpoint file structure, listFrom version mechanism, and concurrent read/write handling with optimistic concurrency
Two diagram panels showing file structure and read/write flow
Bronze-Silver-Gold medallion architecture: Bronze (raw ingestion/history) → Silver (filtered, cleaned, augmented) → Gold (business-level aggregates). Sources: Kafka, Kinesis, CSV/JSON, Spark. Consumers: Streaming Analytics, BI, Data Science/ML
Left-to-right data flow with three database tiers
Complex real-world data pipeline diagram showing tangled dependencies between multiple sources, processing stages, and consumers. Maintaining quality and reliability at scale is complex and brittle
Messy pipeline diagram with many crossing dashed lines
Data Engineering on Databricks Lakehouse Platform: Data ingestion → Data transformation → Data quality management → Automatic deployment & operations → Observability, lineage, and pipeline visibility. Scheduling & orchestration. Delta Lake open format storage at foundation
Layered platform diagram with data sources on left and consumers on right
Section divider for the workspace features chapter
Centered text on coral background
Clusters provide computation resources for Data Analytics, Data Science, or Data Engineering workloads. Shows cluster configuration UI with Databricks Runtime 7.5 ML, Spark 3.0.1, Community Optimized driver type
Description text at top, full-width UI screenshot below
Web interface for writing and executing code with runnable cells for files, tables, visualizations, and narrative text. Shows notebook with sampling strategies content and revision history
Description text at top, notebook screenshot below
Auto Loader incrementally processes new data files from cloud storage (GCS, DBFS). Before/After comparison: eliminates complex Notification Service + Message Queue + Airflow setup. Includes Scala code example
Description, before/after diagrams, and code snippet
Jobs run notebooks on scheduled basis for ETL, Model Building, etc. Shows a DAG workflow: Clicks_Ingest → Sessionize + Orders_Ingest → Match → Build_Features → Persist_Features + Train
Description text at top, DAG workflow diagram below
Framework for declaratively defining, deploying, testing, and upgrading data pipelines. Shows DLT pipeline UI with graph view of table dependencies and event log
Description text at top, full-width DLT pipeline screenshot
Repository-level integration with GitHub, GitLab, Bitbucket, and Azure DevOps. Developers can clone, manage branches, push/pull changes directly from the workspace
Description text at top, Repos UI screenshot with file browser
MLflow Model Registry for managing the entire lifecycle of ML models. Shows model versioning, stage transitions (Archived, Production, Staging), and pending requests
Description text at top, Model Registry screenshot with version table
Section divider for the governance chapter
Centered text on coral background
Diagram showing complexity: 4 data types (Structured, Semi-structured, Unstructured, Streaming) × 3 clouds × separate security policies × multiple output copies
Flow diagram from data types through clouds through security to outputs
Enterprises need to share and govern diverse data products: Files, Dashboards, Models, and Tables
Four icons in a row with labels
Centrally catalog, search, and discover data/AI assets. Unified cross-cloud governance model. Integration with existing Enterprise Data Catalogs. Secure live data sharing with Delta Sharing
Unity Catalog screenshot on left, four bullet points on right
Open protocol for secure data sharing: Data Provider → Delta Lake Table → Delta Sharing Server → Delta Sharing Protocol → Data Recipient (Power BI, Tableau, Spark, pandas, Java)
Left-to-right flow diagram from provider to recipient
Section divider for the ML workspace chapter
Centered text on green background
Side-by-side comparison: Data Warehouse (BI Apps → SQL Engine → Proprietary Storage) vs Data Lakehouse (ML Apps + BI Apps → Python/R + SQL Engine → Cloud Storage with OSS formats: PNG, UTF-8, Parquet)
Two architecture diagrams side by side
Data-native collaborative solution for full ML lifecycle: Collaborative Multi-Language Notebooks → Model Training/Tuning, Model Tracking/Registry, Model Serving/Monitoring, Automation/Governance → Open Multi-Cloud Data Lakehouse and Feature Store
Three-tier stacked platform diagram
Four requirements: Access to Unstructured Data (images, text, scale to petabytes), Open Source Libraries (TensorFlow, scikit-learn, R), Specialized Hardware (GPUs, cloud elasticity), Model Lifecycle Management (artifacts, lineage, productionization)
Four-quadrant layout with bullet points
Business Intelligence (SQL, BI tools, Big Data, Warehouse), Data Science (R, SAS, Python, statistical analysis, small datasets), Machine Learning (Python, deep learning, GPUs, big datasets, unstructured data). ML section highlighted with teal border
Three-column comparison with role icons
ML operates on unstructured data, requires massive datasets, uses open source DataFrames (not SQL), outputs models (not reports), and sometimes needs special hardware (GPUs)
Bullet list on left, large gear/person icon on right
Open tools for both training and operating models on the lakehouse. Models are data too. MLflow for MLOps: track/manage model data, lineage, inputs; deploy models as lakehouse services
Bullet list on left, delivery truck icon on right
Tables manage structured model input but lack: upstream lineage, downstream lineage, model caller integration, and real-time access. Feature stores solve these gaps
Bullet list on left, database icon on right
Section divider — Query data lake data using ANSI SQL with built-in query editor, alerts, visualizations, and interactive dashboards
Centered text on green background with description
SQL query editor with autocomplete, table browser, and endpoint connection. Shows NYC taxi dataset query with column suggestions
Description text at top, query editor screenshot below
SQL dashboards combining visualizations: Cash Generated ($16M), Number of Sales (103K), Monthly Growth (13%), Average Basket ($154), Customer Summary map, Amount per Day chart, Product Category pie chart
Full-width dashboard screenshot with multiple widget types
Alerts notify when scheduled query results meet thresholds. Shows alert creation UI, alert list with triggered/OK states, and Generic Alert configuration with destinations (Pops, Platform, Test Webhook)
Description text at top, four UI screenshots in grid
Query history showing SQL queries performed via SQL endpoints with execution details: duration breakdown (optimizing 35%, execution 64%, fetching 1%), rows returned, bytes read
Description at top, sidebar + query list + detail panel screenshot
Closing slide with Databricks branding
Simple thank you text on dark teal background with geometric shapes
Häufige Fragen zu dieser Folie und dem zugrunde liegenden Präsentationsinhalt.
Databricks is a unified and open data platform that combines the best of data warehouses and data lakes into a single Lakehouse architecture. It supports data engineering, data science, machine learning, and SQL analytics on one platform, built on open-source technologies like Apache Spark, Delta Lake, and MLflow.
This 46-slide deck covers: current data management challenges, the Data Lakehouse concept, Delta Lake foundation (ACID transactions, checkpoints, medallion architecture), Databricks workspace features (clusters, notebooks, jobs, repos, models, Delta Live Tables, AutoLoader), data governance with Unity Catalog and Delta Sharing, ML workspace and MLOps, and SQL Analytics workspace (queries, dashboards, alerts).
This presentation is designed for data engineers, data scientists, data analysts, and technical decision-makers who want to understand the Databricks platform. It serves as both a sales enablement tool and an educational onboarding resource for teams evaluating or adopting Databricks.
The presentation includes a direct comparison showing that the modern data stack requires multiple separate tools (Fivetran, Airflow, dbt, Snowflake, Looker, Tableau), while the Databricks ecosystem consolidates these into a unified platform with Auto Ingest, Delta + Spark, Delta Live Tables, and Databricks SQL.
Delta Lake is an open-source storage layer that brings ACID transactions, scalable metadata handling, and unified batch/streaming processing to data lakes. It provides 48x faster data processing with indexing, time travel for data versioning, schema enforcement, and fine-grained access control — making data lakes as reliable as data warehouses.
Yes, the presentation includes authentic Databricks UI screenshots for clusters, notebooks, AutoLoader, jobs, Delta Live Tables, repos, MLflow Model Registry, SQL queries, dashboards, alerts, query history, and Unity Catalog — providing a realistic view of the platform experience.
Yes, the PPTX file is fully editable. You can update data, add your company context, modify the architecture diagrams, and customize the content for your specific audience — whether for sales demos, internal training, or technical presentations.
Databricks is multi-cloud and works with Microsoft Azure, AWS, and Google Cloud. The presentation highlights this multi-cloud capability as a key advantage, with your data stored in your own cloud data lake using open formats.

Create Your Own Slides
Turn your ideas into professional presentations in seconds with 2slides AI.
Referenzieren Sie professionelle Designs, wählen Sie Ihren Stil und generieren Sie Folien mit perfekter Textdarstellung. Angetrieben von Nano Banana—beginnen Sie jetzt mit der Erstellung Ihrer Präsentation.
Ihr KI-Agent für Folien. Sparen Sie Zeit, glänzen Sie schneller mit intelligenter Präsentationserstellung.




© 2026 2slides. Alle Rechte vorbehalten.